Last updated: November 5, 2026 · Originally published: November 6, 2026 · By Alex Petrov
We analyzed rental property data across 14 US states to answer one question: where does rental investing actually work in 2026? Not where influencers say to buy. Not where your cousin made money in 2019. Where the math works right now — with 7%+ mortgage rates, rising insurance costs, and property taxes that vary 300% from one state to another.
This is the State of Rental Investing 2026 report. All data sourced from Tax Foundation, Federal Reserve FRED, US Census Bureau, state REALTOR associations, Zillow Research, and RentCafe. Updated quarterly. Bookmark this page — we update it every quarter with fresh data.
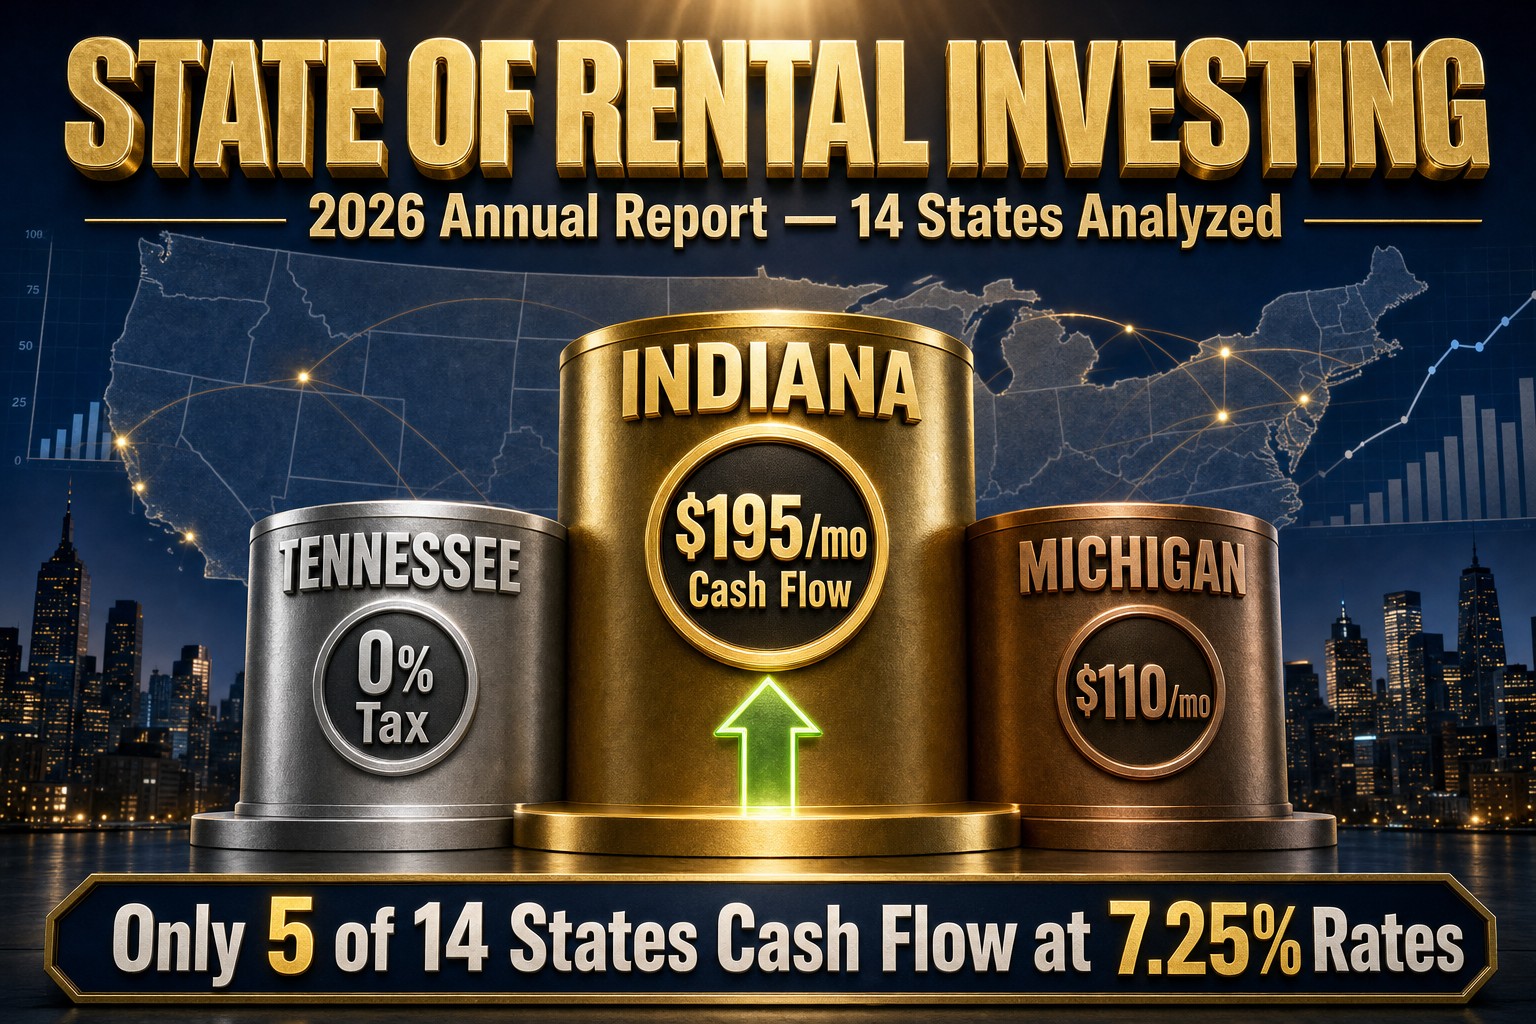
Key Findings: Rental Investing in 2026
- Only 5 of 14 states produce positive cash flow at 25% down and 7.25% rates. Indiana, Ohio, Michigan, Pennsylvania, and Tennessee. The rest require larger down payments or creative financing to cash flow.
- Property tax is the #1 cash flow killer — more than mortgage rates. Texas at 1.80% vs Colorado at 0.51% creates a $3,225/year gap on a $250,000 property. That is $269/month before you collect a dollar of rent.
- Insurance costs doubled the gap between inland and coastal. Inland South Carolina: $1,500/yr. Coastal Florida: $4,500/yr. A $3,000/year insurance gap eliminates cash flow on properties that look identical on a spreadsheet.
- Population growth predicts rent growth 2-3 years ahead. States growing 1%+ annually (SC, TX, AZ, GA) see 3-5% annual rent increases. Stagnant states (MI, PA, OH) see 1-2%.
- No-income-tax states (TX, TN, FL) save investors $2,000-$8,000/year on a $50,000 NOI portfolio versus states like California (13.3%) or Virginia (5.75%).
The 14-State Comparison: Full Data Table
| State | Median Price | Median Rent | Gross Yield | Prop Tax | Income Tax | Insurance | Vacancy | Pop Growth |
|---|---|---|---|---|---|---|---|---|
| Indiana | $185,000 | $1,150/mo | 7.5% | 0.85% | 3.23% | $1,800 | 5.5% | +0.4% |
| Michigan | $235,000 | $1,300/mo | 6.6% | 1.54% | 4.25% | $1,600 | 5.8% | +0.1% |
| Ohio | $235,000 | $1,250/mo | 6.4% | 1.36% | 0-3.99% | $2,100 | 6.5% | +0.3% |
| Pennsylvania | $260,000 | $1,350/mo | 6.2% | 1.58% | 3.07% | $1,500 | 6.5% | +0.1% |
| Tennessee | $280,000 | $1,450/mo | 6.2% | 0.56% | 0% | $2,200 | 6.5% | +0.8% |
| South Carolina | $280,000 | $1,400/mo | 6.0% | 0.86% | 0-6.5% | $2,200 | 6.5% | +1.7% |
| Georgia | $355,000 | $1,600/mo | 5.4% | 0.79% | 5.49% | $2,100 | 7.0% | +1.3% |
| Virginia | $370,000 | $1,600/mo | 5.2% | 0.82% | 5.75% | $1,800 | 5.5% | +0.5% |
| Texas | $335,000 | $1,450/mo | 5.2% | 1.80% | 0% | $3,300 | 8.0% | +1.7% |
| Arizona | $400,000 | $1,700/mo | 5.1% | 0.62% | 2.5% | $2,000 | 6.0% | +1.6% |
| North Carolina | $380,000 | $1,500/mo | 4.7% | 0.66% | 4.5% | $3,000 | 6.0% | +1.3% |
| Colorado | $500,000 | $1,900/mo | 4.6% | 0.51% | 4.4% | $2,800 | 5.5% | +0.8% |
| Florida | $410,000 | $1,900/mo | 5.6% | 0.86% | 0% | $3,800 | 7.0% | +1.4% |
| California | $650,000 | $2,300/mo | 4.2% | 0.75% | 13.3% | $2,400 | 4.5% | -0.3% |
Sources: Tax Foundation (2026 property tax data), Federal Reserve FRED (vacancy rates), US Census Bureau (population estimates), Zillow Research and RentCafe (median prices and rents). Last updated: November 2026.
Cash Flow Rankings: Which States Actually Work at 7.25%?
We modeled a standard rental acquisition in each state: median-priced property, 25% down, 7.25% 30-year fixed, 8% management, state-specific tax/insurance/vacancy. Here is what cash flows and what does not:
| Rank | State | Monthly Cash Flow | Cash-on-Cash | DSCR | Verdict |
|---|---|---|---|---|---|
| 1 | Indiana | +$195 | 3.8% | 1.14 | Best cash flow in the US |
| 2 | Tennessee | +$155 | 2.9% | 1.10 | No income tax + cash flow |
| 3 | Michigan | +$110 | 2.2% | 1.07 | High taxes offset by low prices |
| 4 | Ohio | +$85 | 1.7% | 1.05 | Cash flows but tight at current rates |
| 5 | Pennsylvania | +$45 | 0.9% | 1.02 | Barely positive — needs good deal |
| 6 | South Carolina | -$25 | -0.4% | 0.98 | Breakeven — growth play |
| 7 | Florida | -$85 | -1.2% | 0.94 | Insurance kills cash flow |
| 8 | Georgia | -$110 | -1.5% | 0.92 | Appreciation, not income |
| 9 | Virginia | -$180 | -2.3% | 0.87 | NoVA drives prices above fundamentals |
| 10 | Texas | -$210 | -2.8% | 0.85 | 1.80% prop tax destroys cash flow |
| 11 | Arizona | -$220 | -2.6% | 0.84 | Prices outpaced rents |
| 12 | North Carolina | -$260 | -3.2% | 0.81 | Insurance + rising prices |
| 13 | Colorado | -$450 | -4.3% | 0.72 | Appreciation market only |
| 14 | California | -$890 | -6.5% | 0.55 | Impossible to cash flow |
Run your own scenario in any state with the rental property calculator — pre-loaded with state-specific defaults for all 14 states.
Property Tax: The Hidden Variable
Property tax varies more than any other operating expense — from 0.51% (Colorado) to 1.80% (Texas). On the same $300,000 property:
| State | Tax Rate | Annual Tax | Monthly Impact |
|---|---|---|---|
| Colorado | 0.51% | $1,530 | $128 |
| Tennessee | 0.56% | $1,680 | $140 |
| Arizona | 0.62% | $1,860 | $155 |
| North Carolina | 0.66% | $1,980 | $165 |
| California | 0.75% | $2,250 | $188 |
| Georgia | 0.79% | $2,370 | $198 |
| Virginia | 0.82% | $2,460 | $205 |
| Indiana | 0.85% | $2,550 | $213 |
| South Carolina | 0.86% | $2,580 | $215 |
| Florida | 0.86% | $2,580 | $215 |
| Ohio | 1.36% | $4,080 | $340 |
| Texas | 1.80% | $5,400 | $450 |
| Michigan | 1.54% | $4,620 | $385 |
| Pennsylvania | 1.58% | $4,740 | $395 |
The spread between Colorado ($128/mo) and Texas ($450/mo) is $322/month — $3,864/year. That single line item can flip a deal from profitable to unprofitable. Compare tax impacts with our cap rate calculator and state-specific tools.
Insurance: The Coastal Penalty
Insurance costs split into two tiers: inland states ($1,500-$2,200/year) and coastal/hurricane states ($2,800-$4,500/year). The gap is widening every year as reinsurance costs rise.
| Tier | States | Avg Annual | Monthly Impact |
|---|---|---|---|
| Low ($1,500-$1,800) | PA, MI, IN, VA | $1,675 | $140 |
| Moderate ($2,000-$2,200) | OH, GA, TN, AZ, SC (inland), CA | $2,150 | $179 |
| High ($2,800-$3,300) | CO, NC, TX, SC (coastal) | $3,025 | $252 |
| Very High ($3,800-$4,500) | FL (coastal) | $4,150 | $346 |
Florida’s insurance crisis is the single biggest shift in rental investing since 2020. Properties that cash flowed at $2,000/year insurance now lose money at $4,500. Every Florida deal must be modeled with actual insurance quotes — not state averages. See our landlord insurance guide and insurance cost by state for detailed breakdowns.
Population Growth: The Leading Indicator
States with population growth above 1% consistently see stronger rent growth 2-3 years later. The migration pattern in 2026 continues the post-2020 trend: movement from high-cost Northeast/West Coast to Southeast and Sun Belt.
| Growth Tier | States | Annual Growth | Rent Growth (trailing) |
|---|---|---|---|
| Fast (1.3%+) | SC, TX, AZ, FL, GA, NC | 1.3-1.7% | 3-5%/yr |
| Moderate (0.5-1.2%) | TN, CO | 0.8% | 2-3%/yr |
| Slow (0-0.5%) | IN, OH, VA | 0.1-0.5% | 1-2%/yr |
| Declining | CA, MI (flat), PA (flat) | -0.3 to 0.1% | 0-1%/yr |
The strategic tradeoff: fast-growth states (SC, TX, AZ) offer appreciation but lower current yields. Slow-growth states (IN, OH) offer higher current cash flow but limited appreciation. Census Bureau population data updated annually.
The Tax Efficiency Matrix
State income tax on rental income ranges from 0% to 13.3%. Combined with property tax, the total tax burden varies enormously:
| State | Income Tax | Prop Tax | Combined Tax on $50K NOI | Tax Efficiency Rank |
|---|---|---|---|---|
| Tennessee | 0% | 0.56% | $1,680 | #1 |
| Texas | 0% | 1.80% | $5,400 | #2 (despite high prop tax) |
| Florida | 0% | 0.86% | $2,580 | #3 |
| Arizona | 2.5% | 0.62% | $3,110 | #4 |
| Indiana | 3.23% | 0.85% | $4,165 | #5 |
| Pennsylvania | 3.07% | 1.58% | $6,275 | #6 |
| Ohio | 3.99% | 1.36% | $6,075 | #7 |
| Colorado | 4.4% | 0.51% | $3,730 | #8 |
| Michigan | 4.25% | 1.54% | $6,745 | #9 |
| Georgia | 5.49% | 0.79% | $5,115 | #10 |
| Virginia | 5.75% | 0.82% | $5,335 | #11 |
| South Carolina | 6.5% | 0.86% | $5,830 | #12 |
| North Carolina | 4.5% | 0.66% | $4,230 | #13 |
| California | 13.3% | 0.75% | $8,900 | #14 |
Combined tax = (income tax × $50,000 NOI) + (property tax × $300,000 property value). According to Tax Foundation 2026 state income tax data.
The Investor Decision Matrix
Every state falls into one of four quadrants based on two axes: current cash flow yield and future growth potential. Understanding which quadrant your target market occupies determines your strategy:
High Yield + Low Growth: The Cash Cow States
Indiana, Ohio, Michigan, Pennsylvania. These states produce the highest current cash flow because prices are low relative to rents. The tradeoff: population growth is flat (0.1-0.4%), meaning rent growth will be modest (1-2% annually) and appreciation limited. Buy here for income — not equity. The ideal investor profile: someone who needs cash flow now, plans to hold long-term, and does not depend on appreciation for their return. Run deals in these markets through the rental property calculator with the “Growth” tab set to 1-2% rent increase.
Low Yield + High Growth: The Appreciation States
Arizona, North Carolina, Colorado, California. Prices outpace rents, making cash flow difficult at current rates. But population growth of 0.8-1.6% drives 3-5% annual rent increases and 4-6% appreciation. Buy here if you have a 7-10 year horizon and can absorb negative cash flow for the first 3-5 years. The math works on total return (appreciation + equity buildup + tax benefits) even when monthly cash flow is negative. These are markets where the IRR calculator matters more than the cap rate calculator.
High Yield + High Growth: The Sweet Spot
Tennessee, South Carolina. The rarest combination — affordable prices, decent yields, AND strong population growth. Tennessee leads: 0% income tax, 0.56% property tax, 6.2% gross yield, and 0.8% population growth. South Carolina offers the fastest growth in our dataset (1.7%) with a 6.0% yield. Both states are landlord-friendly with fast eviction timelines. These are the two states where the fundamentals support both cash flow and appreciation simultaneously.
Low Yield + Low Growth: The Avoid Zone
Virginia (outside NoVA), parts of Georgia suburbs. High prices driven by local demand that does not translate to rental yield, combined with moderate growth that does not compensate for the negative cash flow. These markets work for house hackers and owner-occupant investors — not for traditional rental investment at current rates.
What Changed Since 2025
Three shifts reshaped the rental investing landscape in the past 12 months:
- Insurance repricing in Florida and coastal markets. Average Florida landlord insurance rose from $2,800/year (2024) to $3,800/year (2026) — a 36% increase in two years. Coastal South Carolina and North Carolina followed. This single factor moved Florida from a cash-flow-positive to cash-flow-negative state for many investors. The inland advantage (Midwest, Tennessee, inland SC) widened dramatically.
- Mortgage rates stabilized at 7-7.5%. After two years of rate volatility, the market has accepted 7%+ as the new normal. This permanence is actually helpful for investors — you can now underwrite deals with confidence that rates will not spike another 200bps. The investors who waited for rate drops lost 18 months of rent collection and equity buildup. Rates are not the obstacle — deal selection and market choice determine returns at any rate environment.
- Property tax reassessments hit in multiple states. Texas, Ohio, and Michigan all completed reassessment cycles that raised valuations 15-25% on investment properties purchased in 2021-2023. If you bought at the 2021 low and have not been reassessed yet, budget for a significant tax increase at your next cycle.
Methodology
This report uses data from the following sources, cross-referenced and validated quarterly:
- Property taxes: Tax Foundation effective rates (2026)
- State income tax: Tax Foundation marginal rates (2026)
- Median prices/rents: Zillow Research ZHVI + RentCafe median rent data (Q3 2026)
- Vacancy rates: Federal Reserve FRED + US Census Bureau CPS/HVS (latest available)
- Insurance: State insurance department filings + Insurance.com/Bankrate surveys (2026)
- Population growth: US Census Bureau annual population estimates (2025 release)
- Cash flow modeling: ArvCalc rental property calculator with 25% down, 7.25% rate, 30yr fixed, 8% PM, state-specific defaults
Data is updated quarterly. Last update: November 2026. Next update: February 2027.
Run Your Own Analysis
This report shows state-level averages. Your deal is specific. Run any property through our state-specific calculators with local data pre-loaded:
- Rental Property Calculator — full deal analysis with cash flow, ROI, and sensitivity
- Cap Rate Calculator — compare cap rates across properties and markets
- DSCR Calculator — check if your deal qualifies for investor financing
- NOI Calculator — calculate net operating income with detailed expenses
- Deal Comparison Tool — compare multiple properties side by side
State-specific calculators: Ohio · Indiana · Tennessee · South Carolina · Georgia · Texas · Florida · Arizona · California · Colorado · Pennsylvania · Virginia · Michigan · North Carolina
Frequently Asked Questions
What is the best state for rental property investing in 2026?
For cash flow: Indiana (#1 with +$195/month at median). For tax efficiency: Tennessee (0% income tax, 0.56% property tax). For growth + cash flow balance: South Carolina (1.7% population growth, 6.0% gross yield). For appreciation: Arizona (1.6% growth, low taxes). There is no single “best” — it depends on whether you prioritize current income or long-term growth.
Can you cash flow a rental property in 2026?
Yes — in 5 of 14 states at 25% down and 7.25% rates: Indiana (+$195/mo), Tennessee (+$155/mo), Michigan (+$110/mo), Ohio (+$85/mo), and Pennsylvania (+$45/mo). Other states require larger down payments (30-40%), below-market purchase prices, or BRRRR strategy to achieve positive cash flow at current rates.
Why does Texas not cash flow despite 0% income tax?
Property tax. Texas charges 1.80% — the highest of all 14 states analyzed. On a $335,000 property, that is $6,030/year ($503/month) in property tax alone. The income tax savings of ~$2,500/year are completely offset by the additional $3,870/year in property tax versus a state like Tennessee (0.56%).
How often is this data updated?
Quarterly. We pull fresh data from Tax Foundation, Census Bureau, Zillow Research, and FRED every quarter. The cash flow models are re-run with current mortgage rates. Last update: November 2026. Next update: February 2027.
What mortgage rate was used for cash flow calculations?
7.25% — the average investment property rate in November 2026. All models use 25% down, 30-year fixed, 8% property management, and state-specific property tax, insurance, and vacancy rates. You can adjust these assumptions in the rental property calculator.
Why is California ranked last?
Price-to-rent ratio. California’s median price ($650,000) divided by annual rent ($27,600) equals a 23.6 ratio — meaning you pay $23.60 for every dollar of annual rent. Cash flow positive markets have ratios under 15. California also has the highest state income tax (13.3%) and population decline (-0.3%). It is an appreciation-only market that requires very specific strategies (house hacking, ADU conversion) to generate any positive return.
Can I cite this data in my blog or publication?
Yes. This report is free to cite with attribution. Please link to this page (https://arvcalc.com/blog/state-of-rental-investing-2026/) as the source. For press inquiries or custom data requests, contact us at the contact page.
Download and Share
This report is free to use, cite, and share. If you reference this data in your blog, article, podcast, or YouTube video, please link back to this page as the source. We update quarterly so your audience always has access to current data.
Citation format: “State of Rental Investing 2026 Report, ArvCalc.com. Data from Tax Foundation, US Census Bureau, Federal Reserve FRED, Zillow Research.”