In this article:
Every landlord has a number they dread but need to know. The vacancy rate calculator tells you that number. It measures how much rental income you lose to empty units, tenant turnover, and gaps between leases. Get this wrong and your cash flow projections are fiction.
I started tracking vacancy seriously after a duplex sat empty for six weeks between tenants. The lost rent plus turnover costs wiped out two months of profit. That experience taught me something: the vacancy rate you assume in your analysis matters more than most investors realize.
What Vacancy Rate Is and Why Landlords Should Care
Vacancy rate measures the percentage of potential rental income lost to unoccupied units over a period. If your property could generate $24,000 annually but collects $21,600, your vacancy rate is 10%.
This sounds simple. In practice it gets complicated fast. That is why running a vacancy rate calculator before buying any rental property is one of the most useful habits you can build.
Physical vacancy is just part of the story. There is also economic vacancy, which includes rent concessions, free months, and collection losses. A unit might be occupied but the tenant is two months behind on rent. That counts against you even though someone is living there.
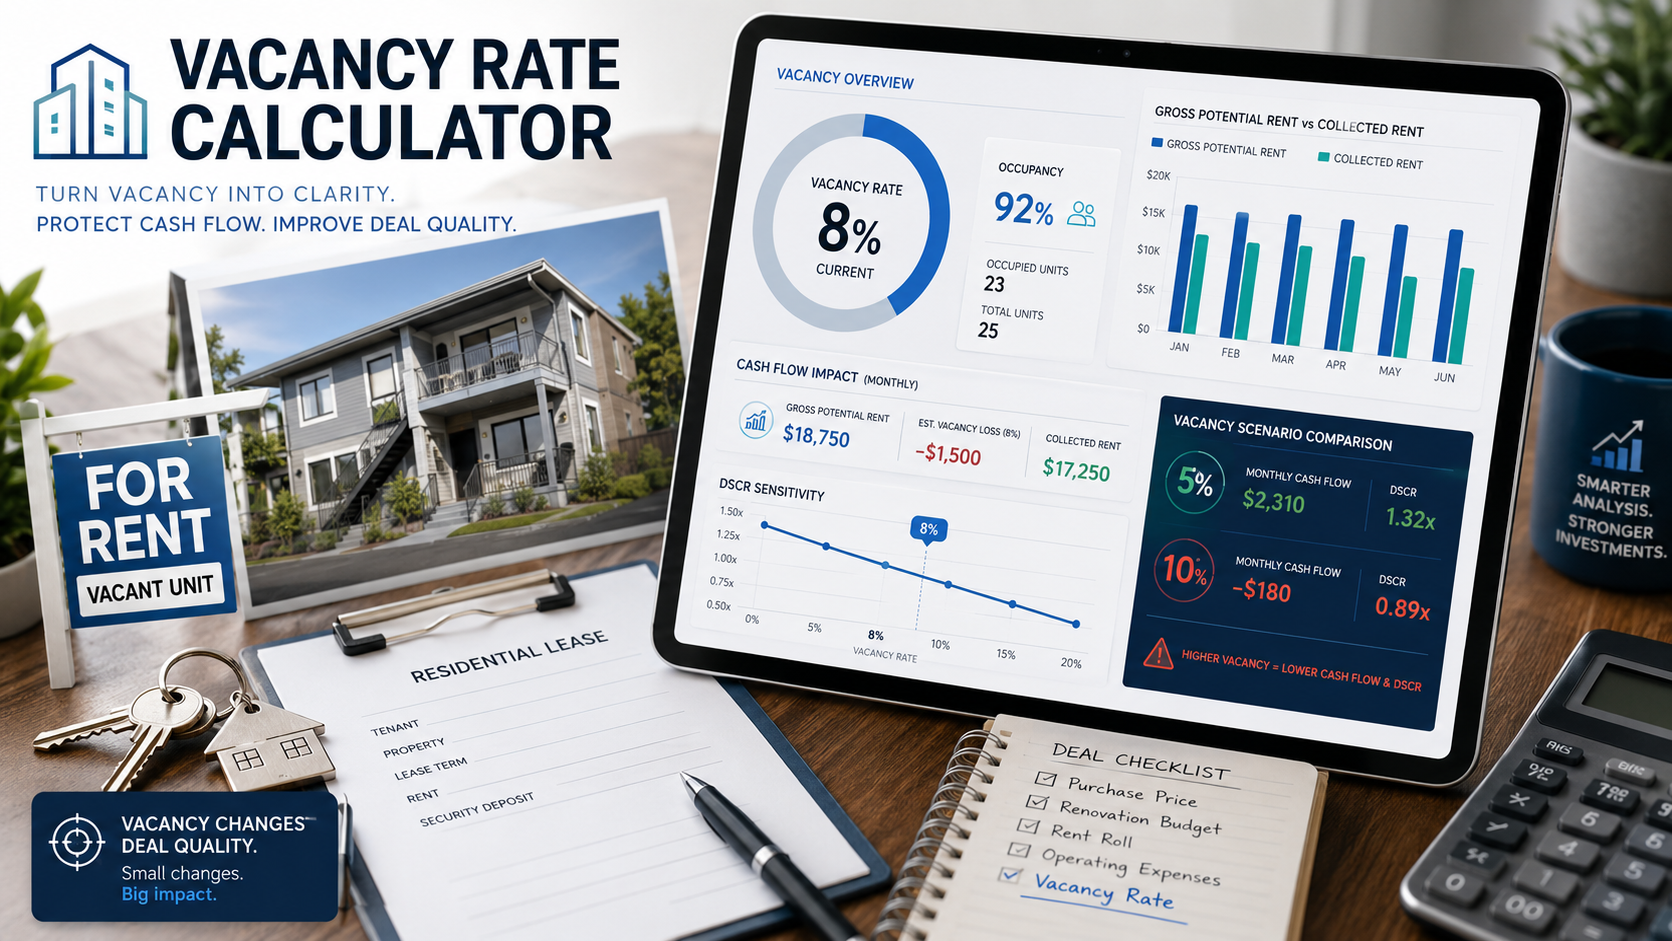
The vacancy rate calculator at RealCalc handles both scenarios. You enter your gross potential rent and actual collected rent, and it shows where the gap is.
How the Vacancy Rate Calculator Works
The math behind vacancy rate is straightforward. Two formulas cover most situations.
| Method | Formula | When to Use |
|---|---|---|
| Unit-Based | Vacant Units / Total Units x 100 | Quick snapshot of a portfolio |
| Income-Based | (Gross Potential Rent – Collected Rent) / Gross Potential Rent x 100 | Accurate income loss measurement |
The income-based method is more useful for investment analysis because it captures partial-month vacancies and rent loss from concessions. A property might show 0% physical vacancy while losing 8% of income to late payments and turnover gaps.
Step-by-Step: Using the Vacancy Rate Calculator
Step 1: Enter your total units. For a single-family rental, that is 1. For a fourplex, enter 4. The vacancy rate calculator adjusts the analysis based on unit count because vacancy hits small portfolios harder.
Step 2: Enter gross potential rent. This is the maximum annual rent if every unit were occupied at market rate for 12 months straight. No gaps, no concessions, no collection issues.
Step 3: Enter actual collected rent. What you actually deposited over the past 12 months. Include everything that reduced collections: empty months, rent concessions, non-paying tenants, and turnover gaps.
Step 4: Review the vacancy rate. The calculator shows your vacancy rate as a percentage and compares it against common planning assumptions. It also shows the dollar impact on your annual income.
Step 5: Test scenarios. Change the vacancy assumption and see how it affects NOI, monthly cash flow, and DSCR. A 3-percentage-point change in vacancy can flip a deal from cash-flow positive to negative.
What Is a Good Vacancy Rate for Rental Property?
This depends on your market, property type, and how you define “good.” But here are some planning ranges that most investors use as starting points.
| Vacancy Rate | What It Usually Means |
|---|---|
| 3-5% | Tight market, strong demand, minimal turnover. Common in supply-constrained areas. |
| 5-8% | Balanced market. Most lenders and underwriters use this range as a planning assumption. |
| 8-12% | Softer market, or properties with higher tenant turnover. Student housing often falls here. |
| 12%+ | Concerning. May indicate pricing issues, property condition problems, or a weak submarket. |
These are planning references only. Your property might run at 2% vacancy in a hot neighborhood or 15% in a seasonal market. Local data matters more than national averages. The vacancy rate calculator lets you test different assumptions quickly to see how sensitive your deal is.
One thing I have learned: always underwrite at a higher vacancy than you expect. If you think vacancy will be 5%, model at 8%. If the deal still works at 8%, you have a buffer. If it only works at 5%, one bad tenant wipes out your year.
Vacancy Rate vs Occupancy Rate
These two metrics are mirror images. If your vacancy rate is 8%, your occupancy rate is 92%. Simple math but investors sometimes confuse which one they are looking at.
Occupancy Rate = 100% minus Vacancy Rate
Lenders tend to talk about occupancy. Investors tend to talk about vacancy. Both describe the same thing from different angles. When someone says “we underwrite at 93% occupancy,” that is the same as saying “we assume 7% vacancy.”
The vacancy rate calculator shows both numbers so there is no confusion.
How Vacancy Directly Affects Cash Flow and DSCR
Vacancy is not just a metric you track. It flows directly into every other number in your rental analysis.
Effective Gross Income = Gross Potential Rent x (1 minus Vacancy Rate). This is where vacancy enters the equation. Every percentage point of vacancy reduces your income before you even start paying expenses.
NOI drops because it starts with effective income. Lower income means lower NOI, even if expenses stay the same. Run this through the NOI calculator with different vacancy assumptions and watch the result move.
Cash Flow gets hit twice. Lower NOI means less money after debt service. On a financed property, a few percentage points of extra vacancy can take you from positive to negative. The cash flow calculator shows this clearly.
DSCR falls because the numerator (NOI) drops while the denominator (debt service) stays fixed. A property with 1.25x DSCR at 5% vacancy might show 1.05x at 10% vacancy. That is the difference between a comfortable lender cushion and a red flag. Check this with the DSCR calculator.
Practical Ways to Reduce Vacancy
Some vacancy is unavoidable. Tenants move. Leases end. But there are things you can do to minimize the gap.
- Price correctly from day one. An overpriced unit that sits empty for 45 days costs more than pricing it $50 lower and filling it in two weeks. Do the math on lost rent vs lower monthly rate.
- Start marketing before the lease ends. If your tenant gives 60-day notice, list the unit on day one. Schedule showings while the current tenant is still there (with proper notice).
- Make turnover fast. Have a contractor ready to paint, clean, and repair within 3-5 days of moveout. Every day of turnover is a day of lost rent.
- Screen tenants carefully. A tenant who pays reliably for 3 years is worth more than one who pays $100 more but leaves after 8 months. Turnover is expensive.
- Offer renewal incentives. A small rent concession or minor upgrade for lease renewal is almost always cheaper than vacancy plus turnover costs.
Common Mistakes When Estimating Vacancy
Using 0% vacancy. No property runs at zero vacancy over time. Even the best properties have turnover. A 0% assumption makes every deal look profitable. Reality will correct that assumption painfully.
Ignoring economic vacancy. Physical occupancy can be 100% while economic occupancy is 90% due to collection issues, concessions, and late payments. Track what you actually collect, not just whether someone is living there.
Using national averages for local analysis. National vacancy rates include every market from Manhattan to rural Mississippi. Your duplex in Cleveland does not care about national averages. Use local data from your property manager, local rental associations, or Census Bureau housing vacancy surveys.
Not stress-testing. If your deal works at 5% vacancy but falls apart at 10%, that is a fragile deal. Run multiple scenarios. The vacancy rate calculator makes this fast.
Forgetting turnover costs. Vacancy is not just lost rent. It includes cleaning, painting, minor repairs, marketing, showing the unit, and screening new tenants. Budget $1,000-3,000 per turnover depending on the property.
Worked Example: How Vacancy Changes a Deal
Here is an illustrative scenario showing why vacancy assumptions matter.
| Metric | 5% Vacancy | 10% Vacancy |
|---|---|---|
| Gross Potential Rent | $24,000 | $24,000 |
| Vacancy Loss | $1,200 | $2,400 |
| Effective Gross Income | $22,800 | $21,600 |
| Operating Expenses (40%) | $9,120 | $8,640 |
| NOI | $13,680 | $12,960 |
| Annual Debt Service | $12,000 | $12,000 |
| Annual Cash Flow | $1,680 | $960 |
| Monthly Cash Flow | $140/mo | $80/mo |
A 5-percentage-point difference in vacancy cuts monthly cash flow almost in half. Same property, same rent, same expenses. Only the vacancy assumption changed. This is why running a vacancy rate calculator with multiple scenarios before making an offer is so important.
This is why running the vacancy rate calculator before committing to a deal matters. Your vacancy assumption is one of the most sensitive inputs in rental property analysis.
Related Tools for Rental Analysis
Vacancy feeds into every other rental metric. Start with the vacancy rate calculator, then run results through the NOI calculator for operating income, the cash flow calculator for after-debt numbers, and the DSCR calculator for lender coverage.
For purchase decisions, the cap rate calculator compares properties using NOI and value. The rental property calculator ties Year 1 assumptions together. For long-term holds, the rental property ROI calculator models how vacancy compounds over multiple years.
Seasonal Vacancy and Lease Timing
Vacancy is not constant throughout the year. Summer months see highest demand because families move before school starts and weather makes moving easier. Winter months are slower.
If a tenant leaves in November, you might face 30-45 days of vacancy instead of the usual 14-21 days during summer. Smart landlords time lease terms to expire during peak season. A 14-month initial lease ending in June gives a better shot at quick turnaround than a standard 12-month starting in October.
This seasonal effect does not show up in annual vacancy calculations, but it matters for cash flow planning month to month.
Single-Family vs Multifamily Vacancy Risk
With a single-family rental, vacancy is binary. One tenant leaving means zero income until you fill the unit. No diversification. The vacancy rate calculator makes this risk visible by showing the dollar impact at different vacancy percentages.
With a fourplex, one vacancy drops income by 25%. Painful but survivable. The other three units keep generating rent. This is one reason many investors move from single-family to small multifamily. The vacancy risk per dollar invested is lower.
When analyzing single-family rentals, I budget 8-10% vacancy even in strong markets. For multifamily with 4+ units, 5-7% is more reasonable. But these are planning assumptions. Your local data should drive the number.
Frequently Asked Questions
Vacancy rate measures the percentage of rental income lost to unoccupied units over a specific period. It is calculated by dividing vacant unit-months (or lost income) by total available unit-months (or gross potential rent).
Most lenders and investors use 5-8% as a planning assumption. However, your actual vacancy depends on local market conditions, property type, tenant quality, and management. Use local data whenever possible and stress-test at higher rates.
Physical vacancy counts empty units. Economic vacancy measures actual income loss, which includes empty units plus rent concessions, collection losses, and non-paying tenants. Economic vacancy is usually higher and more useful for investment analysis.
Vacancy reduces effective gross income, which directly lowers NOI. Since NOI equals effective income minus operating expenses, a higher vacancy rate means lower NOI even if expenses stay the same.
Price competitively, start marketing before current tenants leave, minimize turnover time with fast maintenance, screen tenants carefully for long-term reliability, and offer renewal incentives. Every day of vacancy is lost income that cannot be recovered.
No. Even well-managed properties experience tenant turnover. Using 0% vacancy in your analysis will overstate income and make every deal look better than reality. Always budget for some vacancy, even in strong markets.
Disclaimer: This article and the vacancy rate calculator are for educational planning purposes only. Results are estimates based on user-entered assumptions. They are not financial, tax, legal, or property management advice. Local vacancy data from Census Bureau surveys and property managers is more reliable than broad assumptions. Consult qualified professionals before making investment decisions.
Leave a Reply