
In this article: Use the free Gross Rent Multiplier Calculator to run your own numbers.
- What Is the Gross Rent Multiplier?
- The GRM Formula Explained
- How to Use a Gross Rent Multiplier Calculator
- GRM Ranges by Market Type
- GRM vs Cap Rate vs Cash-on-Cash
- Worked Examples: Comparing 3 Properties
- GRM for Multifamily vs Single-Family
- Limitations of GRM Every Investor Must Know
- When GRM Is Misleading
- Common Mistakes Investors Make with GRM
- Frequently Asked Questions
What Is the Gross Rent Multiplier?
If you’ve ever screened a dozen rental listings in a single afternoon, you already know the problem: running full underwriting on every deal is exhausting. This is why the gross rent multiplier calculator exists. It’s a back-of-the-napkin ratio that tells you, at a glance, how many years of gross rent it would take to pay off a property’s purchase price — no expense data, no loan terms, no spreadsheet required. Punch in two numbers, get a ratio, decide whether the deal deserves a deeper look. That covers it.
GRM has been around since commercial real estate brokers needed a fast way to compare income-producing properties without running a full pro forma. It’s not a valuation model. It’s a sorting tool. Used correctly, it filters out obvious overpriced dogs before you waste time on inspections and income statements.
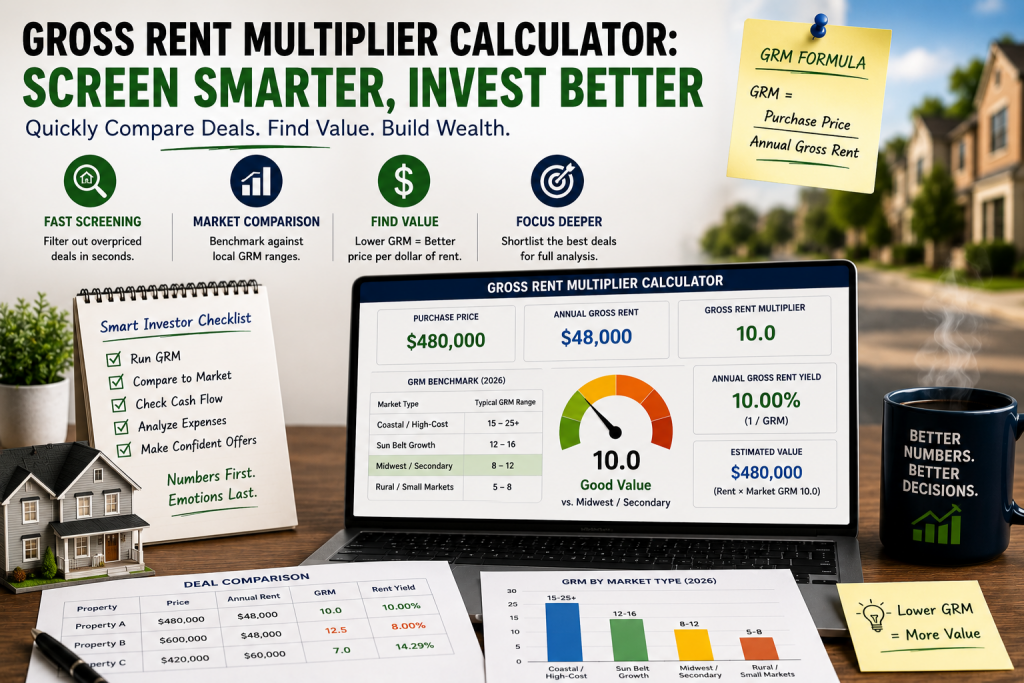
The ratio itself is deceptively simple. A property selling for $480,000 that generates $48,000 in annual gross rent has a GRM of 10. A competing property at $600,000 with the same $48,000 rent has a GRM of 12.5. All else equal, the first deal looks more attractive — you’re paying less per dollar of rent. But “all else equal” is rarely true, which is why GRM is a starting point, not a finish line.
The GRM Formula Explained
The formula:
GRM = Property Purchase Price ÷ Annual Gross Rent
Annual gross rent means the total rent income before any deductions — before vacancy, before property taxes, before maintenance, before management fees. Just scheduled rent collected if every unit is full every month of the year.
Working Backwards: Estimating Value from GRM
You can also flip the formula to estimate what a property should be worth given the prevailing GRM in a market:
Estimated Value = Annual Gross Rent × Market GRM
If comparable rentals in your target neighborhood sell at a GRM of 11 and you’re looking at a duplex generating $36,000/year in rent, the implied market value is $396,000. If the seller is asking $430,000, you’ve got room to negotiate or you walk.
Monthly Rent vs. Annual Rent
Some investors use monthly gross rent instead of annual, which produces a different ratio (often called the Gross Rent Multiplier expressed in months, or just monthly GRM). To avoid confusion, always confirm whether a GRM figure you’re comparing is annual or monthly. This article uses annual gross rent throughout.
What Counts as “Gross Rent”?
Gross rent typically includes base rent only — not laundry income, parking fees, storage fees, or pet rent. Some investors include all ancillary income to get a fuller picture, but for comparison purposes, stick to base rent across all properties so you’re measuring the same thing.
How to Use a Gross Rent Multiplier Calculator Step by Step
A gross rent multiplier calculator automates the division and often adds market context so you know whether your result is high, low, or average for your target area. The process:
Step 1: Get the Purchase Price
Use the actual asking price or your expected offer price. Don’t use the Zestimate or automated valuation — use the number you’d actually write on a contract.
Step 2: Calculate Annual Gross Rent
Take current monthly rent (or projected market rent if vacant) and multiply by 12. For a duplex with one unit at $1,400/month and one at $1,550/month, that’s ($1,400 + $1,550) × 12 = $35,400/year.
Step 3: Enter Both Numbers
Drop both figures into the gross rent multiplier calculator, hit calculate, and read your GRM. Most calculators also show you the gross rent yield (the inverse of GRM expressed as a percentage), which is the same metric looked at from a different angle.
Step 4: Compare to Market Benchmarks
A raw GRM number means nothing without context. A GRM of 14 might be excellent in San Francisco and terrible in Memphis. Match your result against comparable sales in the same zip code or submarket.
Step 5: Shortlist, Then Go Deeper
Use GRM to build a shortlist of deals worth underwriting. Then run each through a rental property calculator that accounts for vacancy, operating expenses, debt service, and cash flow before making any decisions.
GRM Ranges by Market Type
There’s no universal “good” GRM. The ratio reflects local price-to-rent dynamics, which vary enormously across the country. Typical ranges break down in 2026:
| Market Type | Typical GRM Range | Examples | What It Means |
|---|---|---|---|
| Coastal / High-Cost | 15–25+ | LA, NYC, Seattle, Miami | Appreciation-driven markets; cash flow often negative |
| Sun Belt Growth | 12–16 | Austin, Phoenix, Charlotte | Balanced; rent growth catching up with prices |
| Midwest / Secondary | 8–12 | Cleveland, Indianapolis, Kansas City | Cash flow–friendly; slower appreciation |
| Rural / Small Markets | 5–8 | Smaller towns, tertiary markets | High yield but liquidity and vacancy risk are real |
These ranges reflect data from general market data from NAR research reports and regional transaction records. The key takeaway: always benchmark within your target submarket, not nationally.
High GRM markets aren’t automatically bad investments — they’re just different investment theses. Coastal investors often accept thin or negative cash flow in exchange for equity appreciation and long-term wealth building. Midwest investors typically demand cash flow from day one. Neither approach is wrong; they’re different strategies with different risk profiles.
GRM vs Cap Rate vs Cash-on-Cash: What Each Tells You
These three metrics get used interchangeably by newer investors, but they measure very different things. The breakdown:
Gross Rent Multiplier
GRM uses gross rent and ignores all expenses. It’s the fastest calculation but the least precise. Use it for initial screening only.
Cap Rate (Capitalization Rate)
Cap rate uses Net Operating Income (NOI) — gross rent minus vacancy and operating expenses — divided by purchase price. It gives you a truer picture of the property’s income performance independent of how it’s financed. A NOI calculator can help you get there faster. Cap rate is better than GRM for real underwriting, but it still ignores your specific financing terms.
Cash-on-Cash Return
Cash-on-cash compares annual pre-tax cash flow to the actual cash you invested (down payment + closing costs + immediate repairs). This is what you actually earned on your out-of-pocket investment. Run it through a cash-on-cash calculator to see whether the deal pencils with your specific loan terms and down payment.
| Metric | Formula | Includes Expenses? | Includes Financing? | Best Used For |
|---|---|---|---|---|
| GRM | Price ÷ Gross Rent | No | No | Quick screening |
| Cap Rate | NOI ÷ Price | Yes | No | Comparing operating performance |
| Cash-on-Cash | Annual Cash Flow ÷ Cash Invested | Yes | Yes | Evaluating your specific deal |
For deals with more complex debt structures, also check DSCR (Debt Service Coverage Ratio) — especially if you’re using DSCR loans, which lenders increasingly require to exceed 1.25x before approving investment property financing in 2026.
Worked Examples: Comparing 3 Properties with Different GRMs
How a gross rent multiplier calculator works in practice when you’re actually shopping deals.
Property A: Single-Family in Indianapolis
- Purchase Price: $195,000
- Monthly Rent: $1,650
- Annual Gross Rent: $19,800
- GRM: 195,000 ÷ 19,800 = 9.8
At a GRM of 9.8, this is right in the middle of the Midwest range. Looks reasonable. Worth running through a property cash flow calculator to see what’s left after taxes, insurance, maintenance, and vacancy.
Property B: Duplex in Phoenix
- Purchase Price: $520,000
- Monthly Rent (both units): $3,800 combined
- Annual Gross Rent: $45,600
- GRM: 520,000 ÷ 45,600 = 11.4
For a Sun Belt market, GRM of 11.4 is on the lower end — decent for Phoenix in 2026, where prices have moderated. Still needs full underwriting, especially given Phoenix’s seasonal vacancy patterns and HOA costs on newer builds.
Property C: Condo in Miami Beach
- Purchase Price: $875,000
- Monthly Rent: $4,200
- Annual Gross Rent: $50,400
- GRM: 875,000 ÷ 50,400 = 17.4
A GRM of 17.4 is high, but not unusual for coastal Florida. The question isn’t whether GRM is good — it’s whether Miami Beach appreciation over 5–10 years justifies accepting negative cash flow today. That’s a strategy decision, not a GRM decision.
Side-by-side summary:
| Property | Price | Annual Rent | GRM | Market Context |
|---|---|---|---|---|
| Indianapolis SFR | $195,000 | $19,800 | 9.8 | Solid for Midwest |
| Phoenix Duplex | $520,000 | $45,600 | 11.4 | Good for Sun Belt |
| Miami Beach Condo | $875,000 | $50,400 | 17.4 | Expected for coastal |
Use a rental property ROI calculator to take these three from GRM comparison to full return analysis.
GRM for Multifamily vs Single-Family
The gross rent multiplier calculator works for both property types, but the benchmarks and interpretation differ.
Single-Family Rentals
SFRs typically carry lower GRMs in the same market compared to multifamily — partly because buyers include both investors and owner-occupants bidding up prices. A single-family home in a strong school district might trade at a GRM of 14 while a nearby fourplex sells at 11, even though the fourplex has more rental income per dollar invested.
SFR investors should also pay attention to price-to-rent ratios published by sources like the U.S. Census Bureau’s American Housing Survey, which tracks housing cost burdens and rental market data across metro areas.
Multifamily (2–4 Units)
Small multifamily deals are where GRM gets really useful. You can calculate the GRM for each unit individually to spot rent laggards, then figure out the property’s potential GRM if you brought all units to market rent. That spread between current GRM and potential GRM is your value-add opportunity. Use a multifamily property calculator to model those scenarios properly.
Large Multifamily (5+ Units)
Commercial multifamily investors use GRM as a first pass, but they move quickly to cap rate analysis because operating expense ratios vary wildly across older apartment buildings. A 20-unit building with deferred maintenance might have a great GRM but terrible NOI once you account for real expenses. That’s where GRM’s limitations bite hardest. Always supplement with a NOI calculator and a full expense analysis.
Limitations of GRM Every Investor Must Know
The calculator is fast and useful precisely because it ignores complexity. That’s also why it can mislead you.
GRM Ignores Vacancy
A property showing $24,000 in annual gross rent might actually collect $19,200 after a 20% vacancy rate. GRM doesn’t care. Use a vacancy rate calculator to stress-test your assumptions before trusting any gross rent figure.
GRM Ignores Operating Expenses
Two properties with identical GRMs could have wildly different profitability if one has high property taxes, older mechanicals, or deferred maintenance. A Class A building with a GRM of 12 might outperform a Class C building with a GRM of 9 once you account for real expenses.
GRM Ignores Financing
Whether you pay cash or finance 80% of the purchase price, GRM is the same. But your actual returns are completely different. A deal with a GRM of 10 can be a cash flow winner with the right loan or a cash flow loser with a 7.5% rate and minimal down payment. Always run the full analysis through a investment mortgage calculator to see how financing changes the picture.
GRM Uses Gross Rent, Not Net Rent
This is the core limitation. Two properties side by side with the same GRM could have expense ratios of 35% and 55% — which translates to enormous differences in actual cash flow. Once you have expense data, switch to cap rate and cash-on-cash analysis.
When GRM Is Misleading — and When It’s Actually Useful
Here’s when to trust GRM and when to set it aside.
GRM Is Misleading When…
- Rents are below market. A landlord who hasn’t raised rents in years might show a GRM of 16, but at market rents the actual GRM could be 11. Always verify current market rents independently, not just the existing leases.
- The property has high capital expenditure needs. A 1970s building with original HVAC and roof has a hidden cost the GRM ignores entirely.
- Expense structures vary significantly. Properties where tenants pay all utilities vs. landlord-paid utilities look the same to GRM, but the cash flow reality is very different.
- You’re comparing across different market types. Comparing a rural Ohio GRM of 7 to a Denver GRM of 14 tells you nothing useful — these are different asset classes for different investor strategies.
- Short-term rental income is involved. If you’re analyzing an Airbnb property, gross rent figures can be wildly inconsistent from season to season. GRM means very little without stabilized income data.
GRM Is Useful When…
- You’re screening 20 listings and need to eliminate 15 before doing real work.
- You’re checking whether a listing is in the right ballpark before calling the broker.
- You’re estimating market value when comparable sales data is limited.
- You’re tracking a market over time to see whether price-to-rent ratios are compressing or expanding.
- You’re doing a quick sense-check on a seller’s asking price before writing an offer.
For any deal you’re serious about, pair your GRM screen with a rental property calculator, a full expense analysis, and a property management fee calculator if you’re planning on using a manager.
Common Mistakes Investors Make with GRM
The patterns worth watching for.
Using Asking Price Instead of Actual Purchase Price
Sellers price high. If you’re negotiating a deal down $30,000 from asking, run the GRM on your expected purchase price — not the listing price. A GRM of 13 at asking might be a GRM of 11 at your offer, which completely changes the picture.
Using Pro Forma Rents Instead of Actual Rents
Listing brokers often show “potential” or “market” rents in their marketing materials. Unless the property is actually leased at those numbers, you’re looking at a fantasy GRM. Verify current leases and compare to actual comps from platforms like Zillow Rental Manager or local property management data.
Forgetting to Annualize Correctly
Monthly rent × 12 seems obvious, but investors occasionally make errors with partial-year leases, furnished rentals with all-inclusive pricing, or commercial ground-floor spaces mixed into residential buildings. Double-check that your annual gross rent figure represents a full, stabilized 12-month period.
Treating GRM as a Valuation Tool
GRM can give you a rough value estimate, but it’s not a substitute for a proper appraisal or full income approach valuation. Using GRM to justify an offer price without comparable sales data is a mistake that can cost you significantly in a thin or unusual market.
Ignoring Property Management in the GRM Comparison
If one property needs professional management (maybe you’re out of state) and another is local and self-managed, the cash flow difference can easily be 8–10% of gross rent. GRM doesn’t capture that. Factor management costs through a property management fee calculator before finalizing your analysis.
Skipping the Full Stack of Metrics
GRM → Cap Rate → Cash-on-Cash → ROI. That’s the progression for a proper deal analysis. Skipping steps because the GRM “looks good” is how investors end up with properties that underperform or bleed cash. Use a rental property ROI calculator and DSCR calculator to complete the picture.
Frequently Asked Questions
There’s no single “good” GRM — it depends on your market. In Midwest cash flow markets, a GRM of 8–12 is typical and competitive. In coastal high-appreciation markets, GRMs of 15–25 are common and accepted by investors betting on price growth rather than immediate cash flow. Always benchmark against comparable sales in the specific submarket you’re targeting, not national averages.
GRM uses gross rent and ignores expenses entirely. Cap rate uses Net Operating Income (NOI), which is gross rent minus vacancy and all operating expenses, divided by purchase price. Cap rate is more accurate for comparing actual profitability because it accounts for the real cost of running the property. GRM is faster to calculate but less precise. Use GRM for screening and cap rate for underwriting.
To estimate value using the calculator, multiply the property’s annual gross rent by the prevailing market GRM for that area. For example, if comparable properties in your target zip code sell at a GRM of 11 and your subject property generates $42,000/year in gross rent, the implied value is $462,000. If the seller is asking significantly more, you have room to negotiate or a reason to walk away.
You can use GRM on both property types, but comparing them directly can be misleading. Multifamily typically has higher operating expenses as a percentage of income than single-family, so the same GRM doesn’t represent the same profitability. Use GRM to compare properties within the same category — SFRs against SFRs, small multifamily against small multifamily — and supplement with cap rate and cash-on-cash analysis when crossing asset classes.
The gross rent multiplier ignores vacancy rates, operating expenses, property taxes, insurance, capital expenditures, and financing costs. Two properties with identical GRMs can have completely different actual returns once you account for real-world expenses. GRM is useful for initial screening but should never be the primary metric for deciding whether to purchase a property. Always follow up with a full income, expense, and cash flow analysis.
Use the calculator at the very beginning of your deal review process — within the first 60 seconds of looking at a listing. It’s your first filter, not your last. If the GRM is wildly out of range for the market, you can move on without investing hours in full underwriting. If it passes the GRM test, then run the property through a full rental property calculator, cap rate analysis, and cash-on-cash model before making any decisions.
Disclaimer: This article is for educational purposes only and does not constitute financial, investment, or legal advice. Real estate investing involves significant risk, including the potential loss of capital. GRM and other metrics discussed here are analytical tools to assist in property evaluation — they are not guarantees of investment performance. Always conduct thorough due diligence, consult with qualified financial advisors, tax professionals, and real estate attorneys before making any investment decisions. Market conditions, interest rates, and local regulations may differ from examples used in this article.
Leave a Reply