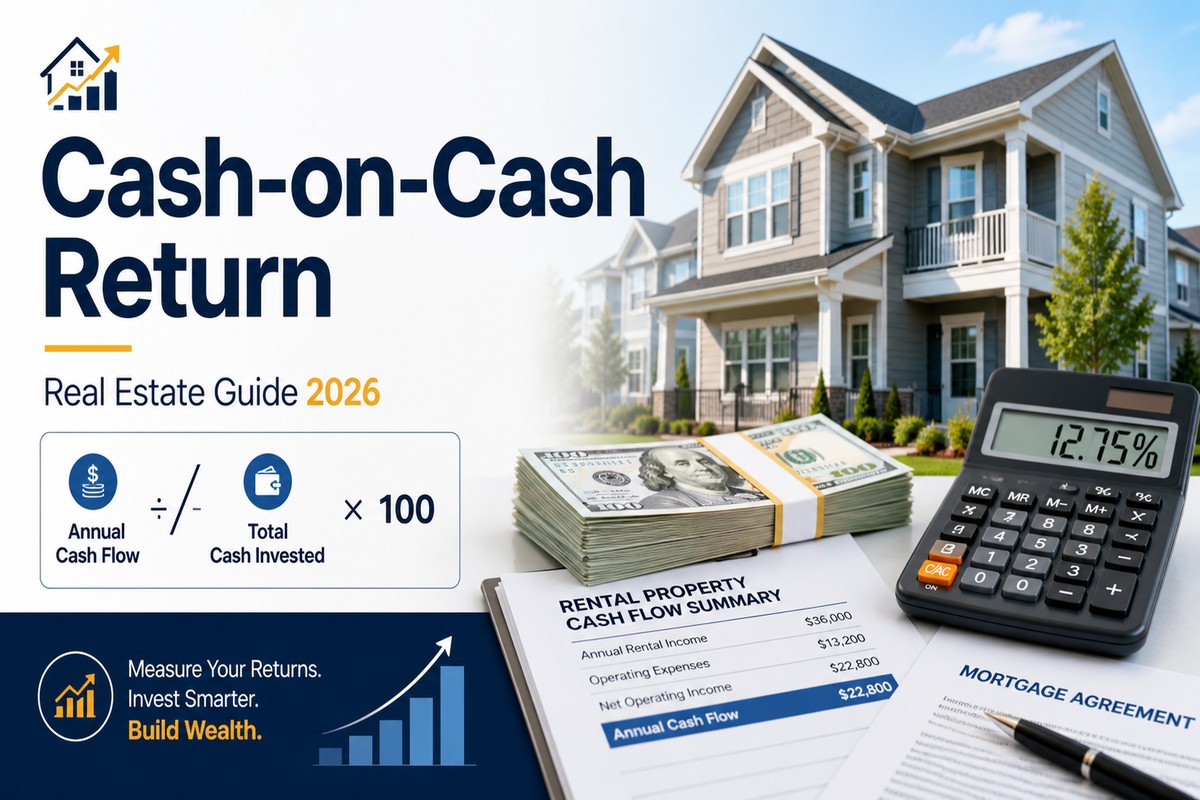
Cash-on-cash return tells you how hard your actual dollars are working in a rental property. Unlike cap rate, which ignores financing, cash-on-cash measures the annual return on the cash you physically put into the deal: down payment, closing costs, and rehab.
A property can have a strong cap rate and still deliver a negative levered return if the mortgage eats the income. In 2026, with rates above 7%, that happens more often than most investors expect.
This guide covers the cash-on-cash formula, how to calculate it step by step, what return to target and the mistakes that make investors overestimate their yield.
Every section connects to our Cash-on-Cash Calculator, so you can run your own numbers alongside.
In This Article:
What Is Cash-on-Cash Return?
Cash-on-cash return (CoC) measures how much annual pre-tax cash flow you earn relative to the total cash you invested. It answers one question: what percentage return am I getting on my actual out-of-pocket money this year?
CoC is a levered metric. It accounts for your mortgage, unlike cap rate which pretends you paid all cash. Two investors can buy the same property at the same price, but the one with 20% down will have a different cash-on-cash return than the one with 25% down because their cash invested and monthly payments differ.
How to Calculate Cash-on-Cash Return: Step by Step
Step 1: Calculate total cash invested. Add your down payment, closing costs, any upfront rehab, and cash reserves you set aside. For a $160,000 property with 25% down and 2.5% closing costs, total cash is $40,000 + $4,000 = $44,000.
Step 2: Calculate annual cash flow. Start with gross rent, subtract vacancy and operating expenses to get NOI, then subtract annual mortgage payments. What remains is your pre-tax cash flow.
Step 3: Divide cash flow by cash invested. If annual cash flow is $828 and you invested $44,000, your CoC is $828 / $44,000 = 1.9%.
Inputs and Outputs
Inputs:
- Purchase Price — the contract price
- Monthly Rent — gross rent per unit times number of units
- Vacancy Rate — percentage of rent lost to turnover (5% to 8%)
- Operating Expenses — taxes, insurance, management (8%), maintenance
- Down Payment % — typically 20% to 25% for investment properties
- Interest Rate — current mortgage rate (7% to 8% in 2026)
- Loan Term — 15, 20, 25, or 30 years
- Closing Costs — typically 2% to 3% of purchase price
- Rehab / Reserves — any additional upfront cash
Outputs:
- Cash-on-Cash Return (%) — the primary result
- Annual Cash Flow ($) — income after all expenses and debt
- NOI — net operating income before debt service
- DSCR — does NOI cover the mortgage?
- Monthly Payment — mortgage amount
- Sensitivity Table — how CoC changes with different inputs
The Cash-on-Cash Return Formula
Cash-on-Cash Return = Annual Pre-Tax Cash Flow / Total Cash Invested x 100
Where:
- Annual Cash Flow = NOI – Annual Debt Service
- NOI = Gross Rent x (1 – Vacancy) – Operating Expenses
- Total Cash Invested = Down Payment + Closing Costs + Rehab + Reserves
Worked example (duplex, Cleveland OH, 2026 assumptions):
- Purchase price: $160,000
- 2 units at $800/mo each = $1,600/mo total rent
- Vacancy: 8%
- Down payment: 25% ($40,000)
- Closing costs: 2.5% ($4,000)
- Total cash invested: $44,000
- Loan: $120,000 at 7.25%, 30-year term
Step 1 — Income:
- Gross rent: $1,600 x 12 = $19,200/yr
- EGI after 8% vacancy: $19,200 x 0.92 = $17,664
Step 2 — Expenses & NOI:
- Taxes: $2,200, Insurance: $1,400, PM (8%): $1,413, Maintenance: $2,000
- Total expenses: $7,013
- NOI: $17,664 – $7,013 = $10,651
Step 3 — Cash Flow & CoC:
- Monthly mortgage: $819
- Annual debt service: $9,823
- Annual cash flow: $10,651 – $9,823 = $828
- this tool Return: $828 / $44,000 = 1.9%
Result: 1.9% CoC. That is below a high-yield savings account in 2026. This deal barely cash flows. The investor is betting on rent growth and appreciation to justify the purchase. At 7.25% rates, even Midwest duplexes produce thin levered returns. Run your own numbers with the calculator Calculator.
Now compare: if the same investor negotiates the price down to $140,000, total cash drops to $39,500, monthly payment drops to $717, and this tool jumps to 5.6%. A $20,000 price reduction more than triples the return. This is why running the numbers before making an offer changes everything.
What Your Result Means
| Rating | the calculator | What It Means |
|---|---|---|
| Exceptional | 12%+ | Rare in 2026 at market rates. Usually distressed properties, off-market deals, or seller financing at below-market rates. |
| Strong | 9% – 11.9% | Above-market yield. Common in Midwest and Southeast with low purchase prices and strong rents. |
| Solid | 6% – 8.9% | Market-average for a well-underwritten deal in most US metros. Acceptable for buy-and-hold. |
| Weak | 3% – 5.9% | Below average. May work if you have a strong appreciation thesis or plan to raise rents significantly. |
| Critical | 0% – 2.9% | Barely positive. A money market fund pays more. Only justified if property appreciates fast enough. |
| Negative | Below 0% | You lose cash every month. Common in 2026 in coastal markets at 7%+ rates. Renegotiate or walk. |
A 4% CoC in San Francisco means something different than 4% in Memphis. In San Francisco, most deals produce 0% to 3%, so 4% is above average for the market. In Memphis, the same 4% is below market. Compare against local benchmarks, not national averages.
CoC Return Benchmarks by Market and Property Type
| Property Type | Typical CoC (2026) | Notes |
|---|---|---|
| Single-Family Rental | 0% – 5% | Hardest to cash flow at current rates. Relies on appreciation. |
| Small Multifamily (2-4) | 2% – 7% | Better per-unit economics than SFR. Sweet spot for CoC. |
| Large Multifamily (5+) | 4% – 9% | Professional management scales. Higher NOI margins. |
| Short-Term Rental | -2% – 12% | Wide range. Market-dependent. Revenue swings seasonally. |
| State / Market | Typical CoC | Notes |
|---|---|---|
| Ohio (Cleveland, Columbus) | 3% – 8% | Low prices. Higher vacancy and turnover in some areas. |
| Texas (DFW, Houston) | 1% – 5% | Property taxes (2.0-2.5%) eat into cash flow heavily. |
| Georgia (Atlanta) | 2% – 6% | Rent growth 3-4%/yr helps offset thin Year 1 returns. |
| Florida (Tampa, Jacksonville) | 0% – 4% | Insurance costs ($3,000-$6,000/yr) compress CoC. |
| California | -2% – 2% | Most deals negative CoC. Investors rely on appreciation. |
| North Carolina (Charlotte, Raleigh) | 2% – 6% | Strong job growth supports rent increases. |

When the calculator Return Matters Most
Buy and Hold. CoC tells you what your cash earns right now. If you need rental income to live on or reinvest, CoC is your primary screening metric. A deal with 8% cap rate but 1% CoC means the mortgage absorbs most of the income.
Comparing financing options. Run the same deal at 20% down vs 25% down vs all cash. CoC changes with each scenario because your cash invested and debt service both change. The calculator’s sensitivity table shows this instantly.
BRRRR strategy. After refinancing, your cash left in the deal drops (ideally to zero). CoC on the remaining cash can be infinite if you pulled all your money out. This is why BRRRR investors obsess over CoC.
Evaluating rate impact. At 6% rate, a deal might produce 7% CoC. At 7.5%, the same deal drops to 2%. CoC is the most rate-sensitive metric in real estate. Use it to stress-test deals against rate changes.
How Interest Rates Affect this tool Return
Interest rates have a direct, outsized impact on the calculator return. Every 0.5% rate increase on a $200,000 loan adds roughly $70/month to your payment, which translates to $840/year less cash flow. On $50,000 of cash invested, that single rate bump cuts CoC by 1.7 percentage points.
In practice, the relationship between rates and CoC is non-linear. At 5% rates, a Midwest duplex might produce 10% CoC. At 7%, the same deal drops to 3%. At 8.5%, it goes negative. The property did not change. The income did not change. Only the cost of borrowing changed.
This is why experienced investors watch the Freddie Mac Primary Mortgage Market Survey weekly. A 0.25% rate drop on a $250,000 loan saves $42/month, which adds 1% to CoC on a $50,000 investment. Timing your purchase around rate movements can mean the difference between a deal that produces income and one that drains your reserves.
Rate buydowns are another tool. Paying 1 point (1% of loan amount) at closing to reduce the rate by 0.25% costs $2,500 on a $250,000 loan but saves $504/year. That is a 20% return on the buydown cost in Year 1, and the savings compound over the life of the loan. Run both scenarios in the this tool Calculator to see which produces better CoC.
Real-World Applications
Setting minimum return thresholds. Decide your floor before looking at deals. If you won’t accept less than 6% CoC, you can screen out 90% of listings in 30 seconds and focus underwriting on the top 10%.
Negotiating price. The “Find Property Value” mode tells you the maximum price that still hits your CoC target. If your target is 6% and the calculator says max price is $145,000, but the seller wants $170,000, you know exactly how far apart you are.
Portfolio performance tracking. Calculate CoC for every property you own each year. Properties with declining CoC may need rent increases, expense reduction, or should be sold to redeploy capital into higher-yielding deals.
Industry Standards
- A 2025 industry survey of buy-and-hold investors: 62% of buy-and-hold investors target 8% to 12% CoC. However, only 34% of respondents reported actually achieving 8%+ in 2025 due to improved rates.
- CCIM Institute (CI 101): Teaches CoC as the primary year-1 levered return metric. Distinguishes it from IRR (multi-year) and cap rate (unlevered). CCIM curriculum uses CoC to evaluate the impact of different financing structures on the same property.
- Fannie Mae / Freddie Mac: Do not use CoC directly. They underwrite based on DSCR (1.20x-1.25x minimum). However, a property that meets DSCR requirements at 25% down typically produces 4% to 8% CoC.
- Private equity / syndications: LPs in multifamily syndications typically receive 7% to 10% preferred return (the calculator equivalent) before the sponsor takes a promote. This sets the floor for institutional CoC expectations.
Limitations
Year-1 only. CoC captures one year of cash flow. It does not account for rent growth, expense inflation, loan paydown, or appreciation. A property with 2% CoC in Year 1 might reach 8% by Year 5 if rents grow 4% annually. Use the Rental Property Calculator for multi-year projections.
Pre-tax metric. CoC does not account for depreciation deductions, mortgage interest deductions, or capital gains at sale. Your after-tax yield may be significantly higher (or lower) depending on your bracket. Use the Depreciation Calculator to estimate tax benefits.
Ignores equity buildup. Each mortgage payment reduces your loan balance. Over 10 years, you build tens of thousands in equity that CoC does not capture. Your total return is higher than what CoC alone suggests.
When Not to Rely on this tool
All-cash purchases. If you pay cash, CoC equals cap rate (no debt service). The metric adds no information beyond what cap rate already tells you. Use cap rate for unlevered analysis and CoC only when financing is involved.
Short hold periods. If you plan to flip in 6 to 12 months, annual cash flow is irrelevant. Your return comes from the spread between purchase price and sale price. Use the Fix & Flip Calculator instead.
Common Mistakes
Forgetting closing costs and reserves. The calculator divides by total cash invested, not just the down payment. If you put $40,000 down but also paid $4,000 in closing costs and set aside $5,000 in reserves, your denominator is $49,000, not $40,000. Missing these understates your true cost and inflates CoC by 10% to 20%.
Using gross rent instead of NOI. Cash flow is not rent minus mortgage. Operating expenses (taxes, insurance, management, maintenance, vacancy) typically consume 35% to 50% of gross rent. Skipping them makes a deal look profitable when it actually bleeds cash.
Comparing CoC across different advantage levels. An investor with 10% down will show a higher CoC than one with 25% down on the same property, because lower down payment means less cash invested (but higher monthly payments). Always compare deals at the same use level.
FAQ
What is a good CoC return for rental property?
In 2026 with rates above 7%, achieving 6% to 8% CoC is solid. Above 10% is exceptional and usually requires off-market deals, seller financing, or Midwest markets with low purchase prices. Below 3%, your cash earns less than a money market fund.
Does this tool return include mortgage payments?
Yes. That is the entire point. CoC measures return after debt service, unlike cap rate which excludes financing. CoC = (NOI minus annual mortgage payments) divided by total cash invested.
What is the difference between the calculator return and cap rate?
Cap rate measures the property’s yield without financing (NOI / purchase price). CoC measures your personal return with financing (cash flow / cash invested). Same property, same cap rate, but two investors with different down payments will have different CoC returns. Use both: cap rate to evaluate the property, CoC to evaluate the deal for you specifically.
Should I include property management even if I self-manage?
Yes. Always budget 8% to 10% management in your CoC calculation. Self-managing inflates CoC artificially. When you sell or refinance, appraisers and buyers will deduct management regardless. Budget it now so your numbers match reality.
Can this tool return be negative?
Yes. If your annual debt service exceeds NOI, cash flow is negative and CoC is negative. This is common in 2026 in coastal markets where purchase prices are high relative to rents and rates are above 7%. A negative CoC means you pay out of pocket every month to hold the property.
Why did my the calculator return drop when rates went up?
Higher rates increase your monthly mortgage payment. That reduces cash flow, which reduces CoC. A 1% rate increase on a $300,000 loan adds roughly $200/month to your payment, which can drop CoC by 3 to 5 percentage points. This is why CoC is the most rate-sensitive metric in real estate.
How does down payment affect this tool return?
More down payment means less debt service (higher cash flow) but more cash invested (larger denominator). The net effect depends on the spread between your cap rate and mortgage rate. If cap rate exceeds mortgage rate, less advantage gives higher CoC. If mortgage rate exceeds cap rate (common in 2026), less advantage actually improves CoC because you avoid negative leverage (debt cost exceeds cap rate).
What is the 50% rule for estimating the calculator?
The 50% rule estimates operating expenses at 50% of gross rent, giving a rough NOI. Subtract debt service from that NOI and divide by cash invested for a quick CoC estimate. It works for 30-second screening but is unreliable for actual underwriting. Real expense ratios range from 30% to 65% depending on property type and market.
Calculate Your this tool Return
3 modes: find CoC, find max price, find required NOI. Instant sensitivity analysis across rate and down payment scenarios.
Open the calculator Calculator
Related Calculators
- Cap Rate Calculator — unlevered property yield (no financing)
- DSCR Calculator — does rent cover the mortgage?
- NOI Calculator — detailed operating income breakdown
- Rental Property Calculator — multi-year total return projection
- ROI Calculator — total return on investment
- IRR Calculator — annualized return with time value of money
- Mortgage Calculator — investment property loan payments
- BRRRR Calculator — buy, rehab, rent, refinance, repeat
Disclaimer: This article is for educational purposes only and does not constitute financial, investment, legal, or tax advice. Real estate investing involves significant risk, including the potential loss of capital. All numbers, rates, and projections are illustrative examples and may not reflect your specific situation. Consult qualified financial, legal, and tax professionals before making any investment decisions.
Leave a Reply