In this article:
Single-family rental analysis does not translate to multifamily. I learned this the hard way on a 6-unit building where my spreadsheet said $800/month cash flow and reality delivered negative $200. The multifamily property calculator is built for the math that actually matters when you have multiple units under one roof.
The difference between a good multifamily deal and a money pit is usually in the expense ratio, not the rent. Most buyers focus on gross income and ignore what it costs to keep a larger building running.
Why the Multifamily Property Calculator Exists
A single-family rental has one tenant, one lease, one vacancy risk. A 10-unit building has ten tenants, ten leases, and a statistically smoother vacancy pattern. One empty unit is 10% vacancy, not 100%.
That diversification is the main appeal of multifamily investing. The multifamily property calculator captures this dynamic. But multifamily also brings costs that single-family investors do not encounter.
Common area maintenance. Shared hallways, parking lots, landscaping, exterior lighting, trash removal. On a house these costs are minimal or tenant-covered. On an apartment building they come out of your pocket every month.
Professional management becomes practical at 4+ units, but it also becomes a real expense. A property manager charging 8% on a 10-unit building with $15,000 monthly gross income takes $1,200/month before you fix a single faucet.
Higher insurance, commercial lending requirements, more complex bookkeeping, and larger capital expenditure reserves all factor in. The multifamily property calculator accounts for these line items instead of hiding them inside a generic expense ratio.
How This Multifamily Property Calculator Works
The calculator takes unit-level income and property-level expenses to build a realistic operating model.
| Input Category | What You Enter |
|---|---|
| Units & Income | Number of units, rent per unit (or total), other income |
| Vacancy | Vacancy rate, economic vacancy adjustment |
| Operating Expenses | Taxes, insurance, management, maintenance, utilities, common areas |
| Financing | Purchase price, down payment, rate, term |
| CapEx Reserves | Per-unit annual reserve for roofs, HVAC, appliances |
The multifamily property calculator outputs include NOI, cash flow, DSCR, cap rate, cash-on-cash return, operating expense ratio, and break-even occupancy. These are the numbers lenders and experienced operators actually look at.
How to Use the Multifamily Property Calculator
Step 1: Enter unit count and rent. If all units rent for the same amount, enter per-unit rent. If rents vary (common in older buildings with different floor plans), use total monthly income. The multifamily property calculator handles both approaches.
Step 2: Set vacancy realistically. Multifamily vacancy runs 5-10% in most markets. Do not use 0%. Even in tight markets, tenant turnover happens. Budget 7-8% as a starting point and adjust based on local data.
Step 3: Enter each expense category. This is where multifamily analysis gets real. Do not use a single percentage for expenses. Break out property taxes, insurance, management, maintenance, utilities, common area costs, and administrative expenses separately. The NOI calculator can help validate individual line items.
Step 4: Enter financing terms. Commercial loans for 5+ units typically require 25% down and carry rates slightly higher than residential. If you are using a DSCR loan, the lender cares about whether the property income covers the mortgage, not your personal income.
Step 5: Review the operating model. Look at NOI, DSCR, expense ratio, and cash flow per unit. If DSCR is below 1.20, lenders may decline financing. If expense ratio is above 55%, investigate which line items are high.
Key Metrics for Multifamily Analysis
| Metric | What It Tells You | Planning Range |
|---|---|---|
| NOI | Income after all operating expenses, before debt | Positive required |
| Cap Rate | NOI as % of property value | 5-9% varies by market |
| DSCR | NOI divided by annual debt service | 1.20+ for most lenders |
| Cash-on-Cash | Annual cash flow / total cash invested | Varies by strategy |
| OER | Operating expenses / effective gross income | 40-55% for residential multi |
| Break-Even Occupancy | Occupancy needed to cover expenses + debt | Below 85% preferred |
Use the cap rate calculator and cash-on-cash calculator alongside the multifamily tool to cross-check individual metrics.
Worked Example: 8-Unit Apartment Building
| Item | Amount |
|---|---|
| Purchase Price | $650,000 |
| Units | 8 |
| Avg Rent/Unit | $1,100 |
| Gross Monthly Income | $8,800 |
| Annual Gross | $105,600 |
| Vacancy (7%) | -$7,392 |
| Effective Gross Income | $98,208 |
| Total Operating Expenses (48%) | -$47,140 |
| NOI | $51,068 |
| Annual Debt Service (25% down, 7.5%, 30yr) | -$40,920 |
| Annual Cash Flow | $10,148 |
| Cash Flow Per Unit/Month | $106 |
| Cap Rate | 7.9% |
| DSCR | 1.25x |
At $106 per unit per month, this building generates modest but positive cash flow. DSCR at 1.25x meets most lender requirements. The 7.9% cap rate is reasonable for a Class B/C suburban property.
But change vacancy to 12% and cash flow drops to $55 per unit. Change the expense ratio to 55% and cash flow goes negative. These sensitivities are why running numbers through the multifamily property calculator with multiple scenarios matters before making an offer.
Single-Family vs Multifamily: The Math Is Different
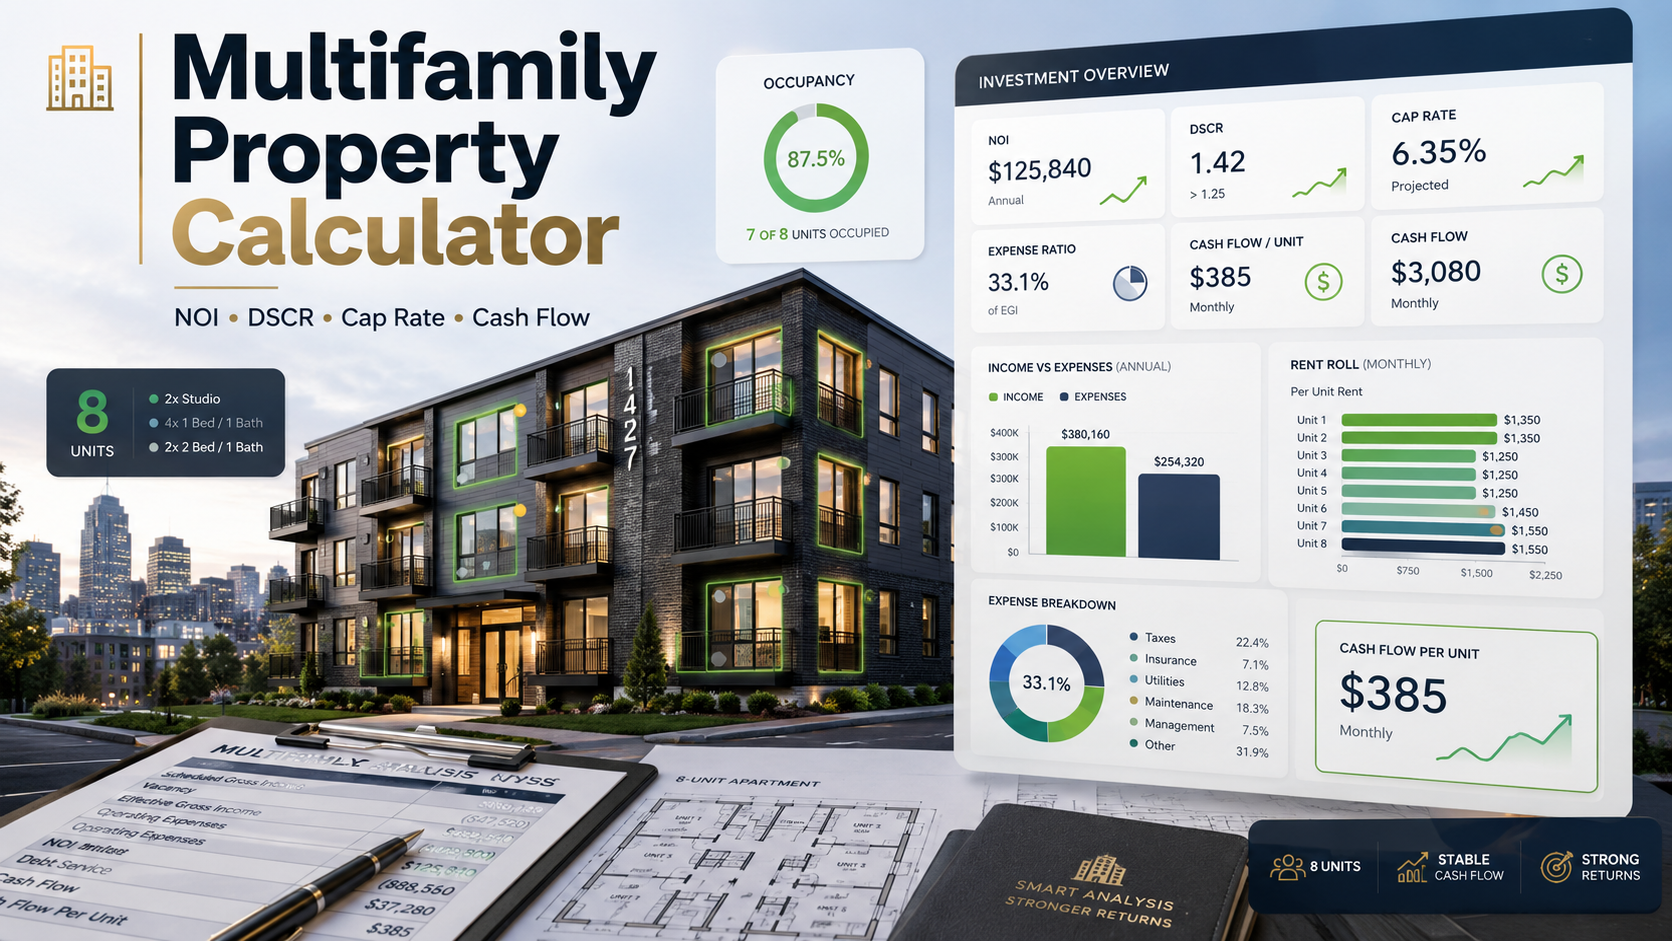
With a single-family rental, one vacancy means zero income. With an 8-unit building, one vacancy means 87.5% occupancy. You still collect rent from seven units while turning the empty one.
But multifamily expenses are proportionally higher. Common areas, shared systems, commercial insurance, professional management, and higher property taxes per unit add up. A typical single-family runs 35-45% expense ratio. A typical small multifamily runs 45-55%.
The trade-off is clear: lower per-unit risk, higher per-unit expense. Whether that trade-off works depends on your specific deal. This tool helps you compare by modeling rent levels, purchase price, and how well the building is managed. Use the rental property calculator for SFR analysis and the calculator for 2+ units to compare fairly.
Expenses the Multifamily Property Calculator Breaks Down
Water and sewer. On buildings where the owner pays water (common in older multifamily), this can run $80-150 per unit per month. On an 8-unit building that is $8,000-14,000 per year. Many buyers assume tenants pay all utilities.
Common area maintenance. Hallways, parking lots, snow removal, landscaping, exterior lighting, trash dumpster rental. Budget $500-1,000 per unit per year minimum.
Turnover costs. Each unit turn costs $1,500-3,000 in cleaning, paint, minor repairs, and lost rent during vacancy. With 8 units averaging one turn per year each, that is $12,000-24,000 annually that does not show up in a simple expense percentage.
Capital reserves. Roof, parking lot, boiler, individual HVAC systems, windows, common area flooring. Budget $500-1,000 per unit per year for CapEx reserves on top of routine maintenance.
Run these through the analysis tool and you will see they alone can add $3,000-5,000 per unit per year that a generic 40% expense ratio misses.
Common Mistakes When Using a Multifamily Property Calculator
Using the seller’s expense numbers. Sellers present pro forma numbers showing minimal expenses. Always verify with actual utility bills, tax records, insurance quotes, and maintenance history. A seller claiming 35% OER on an older building is probably not showing you everything.
Ignoring deferred maintenance. That cheap 8-unit building might need a $40,000 roof in year two. Inspect systems, get contractor estimates for major items, and factor those into your purchase price negotiation.
Assuming all units rent at market rate. Below-market tenants are common in multifamily. You might buy a building with rents at $900 where market is $1,100. That is upside, but it takes time and turnover to capture it. This tool should not be loaded with $1,100 on day one.
Underestimating management complexity. Eight tenants means eight leases, eight sets of maintenance requests, and eight potential headaches. If you are self-managing your first multifamily, your time cost is real even if you do not pay a management fee. The property management fee calculator shows the true cost if you hire it out.
Frequently Asked Questions
Cap rates vary by market, asset class, and property condition. Planning ranges for small multifamily (2-20 units) run 5-9% depending on location and quality. Use the cap rate calculator to compare specific properties rather than relying on broad averages.
Small residential multifamily typically runs 45-55% operating expense ratio. This is higher than single-family (35-45%) because of common area costs, shared utilities, and management complexity. Always use actual expenses rather than a generic percentage when available.
The calculation is the same (NOI divided by annual debt service) but multifamily lenders often require higher DSCR minimums (1.20-1.35x vs 1.00-1.25x for residential). Multifamily loans are also underwritten primarily on property income rather than borrower income.
Break-even occupancy is the minimum occupancy needed for income to cover operating expenses and debt service. Below 85% is generally preferred. Above 92% means thin margins where one or two vacancies could push you negative.
Both. Analyze the whole building for NOI, DSCR, and cap rate since those drive the purchase and financing decision. Analyze per-unit for cash flow and expense allocation since that drives operating decisions and rent strategy.
Generally 5+ units requires commercial or portfolio lending rather than conventional residential mortgages. Properties with 2-4 units can often use conventional residential financing with better rates and terms. The threshold matters because commercial loans typically require higher down payments and carry different terms.
Disclaimer: This article and the calculator are for educational planning purposes only. Results are estimates based on user-entered assumptions. Multifamily investment involves additional complexity including commercial lending, property management, local regulations, and tenant law. Data from Census Bureau housing surveys and local property managers may be more reliable than broad assumptions. Consult qualified professionals before making investment decisions.
Leave a Reply