
In this article: Use the free Debt Yield Calculator to run your own numbers.
- What Is Debt Yield in Commercial Real Estate?
- The Debt Yield Formula Explained
- How to Use a Debt Yield Calculator for Deal Screening
- Debt Yield vs. DSCR, LTV, and Cap Rate
- Debt Yield Thresholds by Property Type in 2026
- Worked Example: Running the Numbers on a Real Deal
- Why Debt Yield Matters More in Rising Rate Environments
- Debt Yield in CMBS vs. Bank Lending
- Common Mistakes Investors Make with Debt Yield
- When Debt Yield Kills a Deal
- Frequently Asked Questions
If you’ve ever had a lender come back with a lower loan amount than your LTV suggested was possible, there’s a good chance debt yield was the constraint — not the limiting factor. A debt yield calculator takes a single ratio — Net Operating Income divided by the loan amount — and turns it into the metric that CMBS lenders and institutional banks increasingly use to cap their exposure. Understanding how to run this number before you get to underwriting saves you from structuring a deal around financing that will never close. This article breaks down exactly what debt yield means, how the formula works, where thresholds sit across property types in 2026, and how to use a debt yield calculator at the screening stage so you stop wasting time on deals that don’t pencil.
What Is Debt Yield in Commercial Real Estate?
Debt yield is the ratio of a property’s Net Operating Income to the total loan amount, expressed as a percentage. It answers one question from the lender’s perspective: if I have to take this property back tomorrow, what yield am I earning on the outstanding balance?
That framing matters. Unlike LTV, debt yield doesn’t depend on an appraised value that can be manipulated by selecting favorable comps or capitalizing income at an aggressive rate. Unlike DSCR, it doesn’t fluctuate with whatever interest rate is on the term sheet. The NOI-to-loan ratio is a direct, rate-agnostic measure of how much income cushion backs the debt.
Commercial lenders — particularly life companies, CMBS conduits, and agency lenders — started emphasizing debt yield heavily after the 2008 cycle, when appraised values proved unreliable and loan sizing based on value alone left lenders holding underwater assets. By the mid-2010s, minimum debt yield floors had become standard underwriting policy at most institutional shops. By 2026, with a full rate cycle in the rearview mirror, lenders have reinforced those floors rather than loosened them.
Who Uses Debt Yield and Why
Agency lenders (Fannie Mae, Freddie Mac) publish debt yield floors in their product matrices. CMBS conduits set minimums that are often 8–9% for core property types. Life insurance companies can be tighter, sometimes requiring 9–10% depending on their balance sheet targets. Regional banks and credit unions use it less formally, but sophisticated borrowers who understand the metric can anticipate sizing constraints before the first lender call.
On the borrower side, running a debt yield calculator early in due diligence tells you the maximum loan amount a property’s NOI can support — regardless of what valuation might suggest. That’s the number that actually limits your borrowing power.
The Debt Yield Formula Explained
The formula:
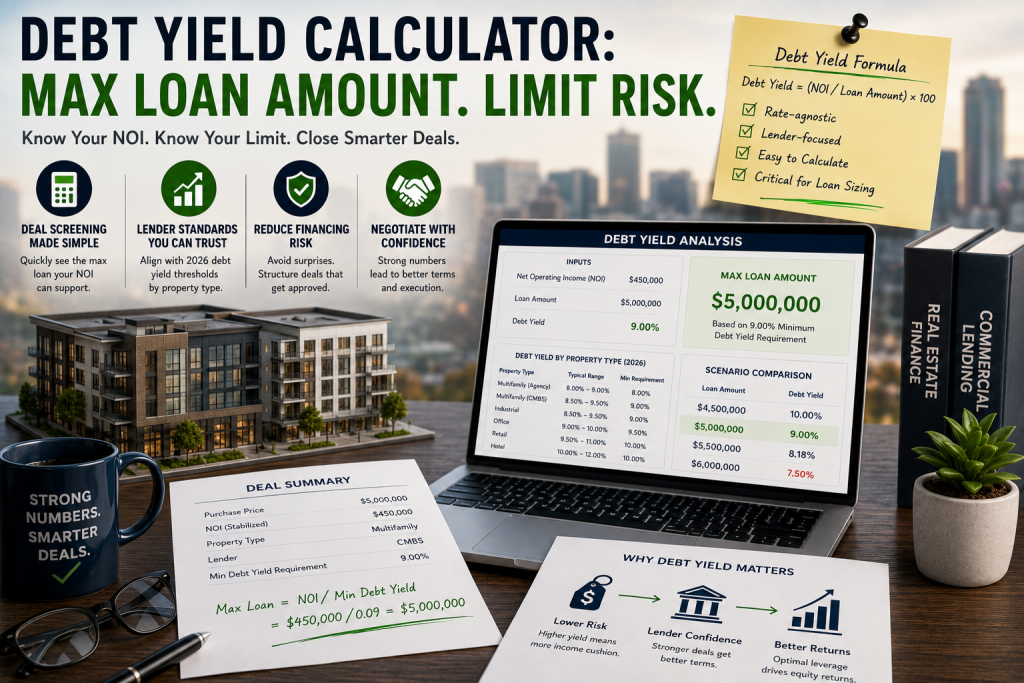
Debt Yield = (NOI ÷ Loan Amount) × 100
Where:
- NOI — Net Operating Income: gross rental income minus vacancy and operating expenses, before debt service and income taxes. This is the same NOI you’d use to calculate a cap rate.
- Loan Amount — the total principal being requested, not the property value.
Example: a property generates $180,000 in NOI and you’re requesting a $2,000,000 loan.
Debt Yield = ($180,000 ÷ $2,000,000) × 100 = 9.0%
Most institutional lenders want to see a minimum of 8–9% for stabilized multifamily and 9–10% for retail, office, and industrial. If your number comes in below the floor, the lender either passes or cuts the loan amount until the ratio clears — which often means a bigger equity check than you modeled.
Why NOI Accuracy Is Everything
The formula has two inputs, and only one of them you control heading into a deal: the loan request. The other — NOI — has to be real. Lenders underwrite to trailing 12-month actuals and their own stabilized projections, not to your pro forma. If you’re using a NOI calculator with management fees understated, or vacancy at 2% when the market runs 7%, the lender’s underwritten NOI will be lower than yours, and the debt yield they calculate will fail their test even if yours passes.
Get the NOI right first. Use a NOI calculator with conservative inputs before you ever talk to a lender about loan sizing.
How to Use a Debt Yield Calculator for Deal Screening
A debt yield calculator is most valuable at the LOI stage — before you spend money on appraisals, environmental reports, or legal fees. Here’s the workflow that makes it useful:
The Three-Step Screening Workflow
- Run your NOI. Pull trailing 12-month actuals from the offering memorandum or rent rolls. Adjust for management fees if the seller is self-managing, normalize one-time expenses, and apply a realistic vacancy rate for the submarket. Use a NOI calculator to be systematic.
- Determine the lender’s minimum debt yield. Know your lender’s floor before you run the number. For CMBS, that’s typically 8.5–9.5% in 2026. For Fannie/Freddie multifamily, check current pricing supplements. For banks, ask directly — most will tell you their minimum.
- Back-solve for maximum loan amount. Rearrange the formula: Max Loan = NOI ÷ Minimum Debt Yield. That’s your ceiling. If the purchase price requires more debt to hit your target returns, the deal either needs to be repriced or is not financeable at those terms.
A debt yield calculator handles this back-solve instantly. Enter your NOI and the lender’s minimum yield floor, and it returns the maximum loan amount the property can support under those constraints. Pair that output with your DSCR calculator and LTV calculator to see which metric is actually binding — sometimes it’s LTV, sometimes DSCR, and with current cycle, debt yield is frequently the tightest constraint.
After you know your max loan, run the full return stack: cash-on-cash, ROI, and cash flow at that loan amount. If the returns don’t work with the debt yield-constrained loan, that’s your answer at the screening stage — not after you’ve spent $25,000 in due diligence.
Debt Yield vs. DSCR, LTV, and Cap Rate
Commercial real estate has no shortage of underwriting metrics. How debt yield fits relative to the others — and why it often overrides them.
| Metric | Formula | What It Measures | Rate-Sensitive? |
|---|---|---|---|
| Debt Yield | NOI ÷ Loan Amount | Lender’s yield on outstanding balance | No |
| DSCR | NOI ÷ Annual Debt Service | Coverage of debt payments | Yes |
| LTV | Loan ÷ Appraised Value | Loan-to-value exposure | Indirect |
| Cap Rate | NOI ÷ Property Value | Return on asset at full equity | Indirect |
Debt Yield vs. DSCR: The Key Distinction
DSCR is the ratio most borrowers know best. It measures whether property income covers debt service — and lenders typically require 1.20–1.25x minimum. The problem with DSCR as a primary underwriting metric: it changes with interest rates. A property at a 1.25x DSCR on a 6.5% loan becomes a 1.10x DSCR if the rate rises to 8%. That’s a compliance failure with the same asset and the same loan amount.
Debt yield doesn’t move with rate fluctuations. If a lender is holding a loan and rates spike, the NOI-to-loan ratio is unchanged. That stability is exactly why CMBS programs lean on it heavily — the pool of loans needs to perform through rate cycles, not just at origination.
Use both metrics. A DSCR calculator tells you whether the deal cash flows under current terms. A debt yield calculator tells you whether the lender can live with the loan amount through a downturn. You need to clear both hurdles.
Debt Yield vs. Cap Rate
Cap rate and debt yield share the same numerator — NOI — but differ in the denominator: cap rate divides by asset value, debt yield divides by loan amount. Because loan amount is almost always less than asset value (unless you’re over-borrowed), debt yield will typically be higher than cap rate on a given deal.
The relationship matters. If cap rates compress — meaning asset values rise while NOI stays flat — the spread between cap rate and debt yield narrows if the loan grows with the value. Lenders noticed this pattern in 2021–2022 when low cap rates and aggressive loan-to-value ratios combined to produce debt yields that left almost no cushion. That’s part of why floors tightened heading into 2023 and have stayed tight through 2026.
Use a cap rate calculator alongside your debt yield analysis to understand both the asset’s yield and the lender’s exposure.
Debt Yield Thresholds by Property Type in 2026
These ranges reflect current market conditions based on CBRE lending surveys and Federal Reserve commercial credit data. Individual lenders vary — always confirm floors with your specific capital source.
| Property Type | CMBS Floor | Agency / Life Co. | Bridge / Bank |
|---|---|---|---|
| Multifamily (Class A/B) | 8.0–8.5% | 7.5–8.5% | 8.0–9.0% |
| Industrial / Logistics | 8.5–9.0% | 8.0–9.0% | 8.5–9.5% |
| Anchored Retail | 9.0–10.0% | 9.0–10.0% | 9.0–11.0% |
| Office (Suburban) | 10.0–11.0% | 10.0%+ | 10.0–12.0% |
| Mixed-Use | 8.5–9.5% | 8.5–9.5% | 9.0–10.0% |
| Hospitality | 10.5–12.0% | N/A | 11.0–13.0% |
Office is the obvious outlier — floors have pushed up sharply as lenders price in structural vacancy risk. Suburban office that would have cleared a 9% minimum in 2019 now faces floors of 10–11% from most institutional programs, effectively requiring either lower purchase prices, less borrowing power, or both. CBD trophy office is largely a specialty lender conversation at this point.
Multifamily remains the most accommodating category. Agency programs (Fannie DUS, Freddie Optigo) have published debt yield floors as low as 7.5% for certain affordable and workforce housing products, making it the easiest property type to finance at higher loan amounts. For a multifamily deal analysis, use the multifamily property calculator alongside your debt yield number.
Worked Example: Running the Numbers on a Real Deal
Here’s a concrete walkthrough of how a debt yield calculator changes the underwriting on a typical deal.
The Property
48-unit Class B apartment complex in a mid-size Sun Belt market. The seller is asking $7,200,000. You’re targeting 70% LTV, which means a $5,040,000 loan. Let’s check whether that loan is supportable using debt yield.
Income:
- Gross Potential Rent: $672,000/year (48 units × $1,400/month average)
- Vacancy (6%): −$40,320
- Other Income: $12,000
- Effective Gross Income: $643,680
Operating Expenses:
- Property Taxes: $72,000
- Insurance: $28,800
- Utilities (common area): $14,400
- Repairs & Maintenance: $38,400
- Property Management (8%): $51,494
- Administrative / Other: $12,000
- Total Expenses: $217,094
NOI: $643,680 − $217,094 = $426,586
Now run the debt yield calculator:
Debt Yield = $426,586 ÷ $5,040,000 × 100 = 8.46%
If the lender’s floor is 8.0%, this deal clears. If their floor is 8.5%, it doesn’t — and you need to either reduce the loan amount or accept that price doesn’t work at the loan amount they need.
Back-solving for the minimum NOI or maximum loan at 8.5%:
Max Loan = $426,586 ÷ 0.085 = $5,018,659
So at an 8.5% floor, the maximum supportable loan is $5,018,659 — about $21,000 less than the 70% LTV target. That’s a small gap; the deal is close. Now run the full picture: check your DSCR calculator at $5,018,659 and today’s rate, your cash-on-cash calculator, and your rental property calculator to confirm total returns still make sense at the adjusted equity position.
Then use a mortgage calculator for investment property to confirm debt service at that loan amount before finalizing the offer.
Why Debt Yield Matters More in Rising Rate Environments
Between 2022 and 2024, the Federal Reserve raised the Fed Funds Rate by 525 basis points. DSCR-based underwriting fell apart — deals that looked fine at 3.5% borrowing costs turned negative at 7.5%. Debt yield floors, by contrast, didn’t change with rates. A 9% minimum is a 9% minimum regardless of whether you’re borrowing at 5% or 8%.
This asymmetry explains the shift in institutional lending practice. When rates are low and stable, DSCR is a sufficient safety check because the rate environment is predictable. When rates are volatile, lenders need a rate-independent floor. Debt yield provides that. FDIC guidance on commercial real estate lending has emphasized income-based stress testing over valuation-based metrics, and debt yield fits that framework cleanly.
Using Debt Yield to Stress-Test a Deal
One underrated use of a debt yield calculator is stress-testing a deal against a market downturn scenario. If the property’s NOI drops 10% due to increased vacancy or expense creep, what does debt yield look like at the outstanding balance in year 3?
Using the example above: if NOI falls from $426,586 to $383,927 (10% decline) and the loan is still at $5,000,000, debt yield drops to 7.68%. That’s below most institutional floors. In a refinance scenario at that point, the borrower would face a loan paydown to restore the debt yield — exactly the situation that caught many 2019–2021 vintage deals off guard during the 2023 refinance crunch.
Running this scenario takes 30 seconds with a debt yield calculator. Not running it can cost you your equity.
Debt Yield in CMBS vs. Bank Lending
The way lenders apply debt yield floors varies significantly by loan type, and knowing the difference matters when you’re sourcing capital.
CMBS Conduit Lending
CMBS loans are securitized — pooled and sold to bond investors. The servicer and special servicer have to manage the loan through the entire 10-year term without the flexibility to renegotiate. That inflexibility makes CMBS programs the strictest on debt yield floors, because there’s no workout option if the income drops below the threshold. Most CMBS conduit programs in 2026 apply floors of 8.5–9.5% depending on property type, and underwriters will test debt yield on both as-is and stabilized NOI.
For deals with lease-up risk or value-add components, CMBS is often the wrong capital source precisely because the debt yield requirement ties to stabilized income — which you may not have yet. Bridge lenders are more flexible on current debt yield if the business plan clearly supports a path to stabilization.
Bank and Balance Sheet Lending
Smaller regional banks and credit unions hold loans on their balance sheets, giving them more flexibility. Many apply informal debt yield guidance rather than hard floors — meaning they might make an exception for a strong sponsor or market. However, post-2023 regulatory pressure on bank CRE concentrations (driven by FDIC and OCC guidance) has pushed banks to formalize their underwriting, including debt yield minimums. Don’t assume your local community bank doesn’t have a floor just because they’ve never mentioned it.
Life insurance companies sit in the middle — balance sheet lenders with conservative underwriting. They often require the highest debt yields (9–10%+) on stabilized assets, but for the right product in the right market, they offer the most competitive rates and terms.
Common Mistakes Investors Make with Debt Yield
After walking through dozens of failed deals, the same errors come up repeatedly when investors misuse or ignore the debt yield calculator.
Using Pro Forman NOI Instead of Stabilized Actuals
This is the most expensive mistake. Lenders underwrite to their own stabilized NOI, which in most cases is lower than what’s in your acquisition model. If you’re using projected rents that assume 15% mark-to-market upside, a lender will either use in-place rents or apply a haircut to your projections. The debt yield that clears on your numbers may not clear on theirs. Always run the debt yield calculator against the most conservative defensible NOI, not the upside case.
Running LTV and DSCR Without Checking Debt Yield
Many residential investors moving into commercial real estate are LTV-focused — they’ve built their mental model around loan-to-value. If the appraisal supports 70% LTV and DSCR clears 1.25x, they assume the financing is locked. Then the term sheet comes back with a loan amount 15% smaller than expected, and they’re scrambling to find equity or renegotiate the purchase price. The fix is simple: run a debt yield calculator alongside your LTV calculator before you make an offer.
Not Stress-Testing the Debt Yield Forward
Debt yield at closing isn’t the only number that matters. If you’re taking on a 10-year CMBS loan, the loan balance at maturity combined with the property’s NOI at that point determines whether you can refinance. A deal that barely clears a 9% floor at origination with aggressively low operating expenses may fail to refinance if operating costs normalize or rents soften. Run the forward scenario before you commit.
When Debt Yield Kills a Deal
Debt yield is deal-specific. The most common scenarios where it becomes the binding constraint that makes a deal unfundable at the target structure.
Scenario 1: Value-add multifamily with high current vacancy. You’re buying a 30-unit building at 65% occupancy. The projected NOI at stabilization supports 9% debt yield on the loan you need, but the as-is NOI produces 5.5% debt yield. CMBS won’t touch it. Agency programs won’t touch it. Bridge debt is the only path — which means higher rates, shorter terms, and extension risk if the business plan takes longer than expected.
Scenario 2: Office in a secondary market. A suburban office park at 82% occupancy with a weighted average lease term of 2.4 years. NOI at $410,000 on a requested loan of $4,500,000 produces 9.1% debt yield — which would clear on multifamily but falls short of the 10%+ floors most lenders require for office in 2026. The only way to make it fundable is to reduce the loan to $4,100,000 (10% debt yield), which requires a larger equity check or a lower purchase price.
Scenario 3: Retail with one dominant tenant. A single-tenant net lease retail property leased to a regional grocery chain. Cap rate is 6.5%, NOI is $325,000, and you’re requesting $3,800,000. Debt yield: 8.55%. For a CMBS program requiring 9% on retail, that’s a fail. Max loan at 9%: $3,611,111. The deal works at a lower price or with more equity. Run the closing costs calculator and 1031 exchange calculator to see if the full capital stack still makes sense before proceeding.
In each scenario, a debt yield calculator surfaces the problem in minutes. The alternative is finding out after LOI acceptance — when you’ve spent money on due diligence and relationship capital on a deal that was never going to close at your target terms.
For multi-property portfolio analysis, run each asset through the multifamily property calculator, rental property calculator, and property cash flow calculator to build a complete picture before presenting to lenders.
Frequently Asked Questions
Most institutional lenders require a minimum debt yield of 8–9% for multifamily and 9–10% for retail, office, and industrial. CMBS conduit programs typically floor at 8.5–9.5% depending on property type, while life insurance companies often require 9–10%+. Office assets face the tightest standards, with many lenders requiring 10–11% given ongoing structural vacancy concerns. Use a DSCR calculator alongside debt yield to ensure the deal clears both hurdles before making an offer.
Both metrics use NOI as the numerator, but the denominator differs. Cap rate divides NOI by property value — it measures the asset’s return at an all-equity purchase. Debt yield divides NOI by the loan amount — it measures the lender’s return on the outstanding balance. Because loan amount is typically less than property value, debt yield will be higher than cap rate on the same deal. A deal can have a 5.5% cap rate and a 9% debt yield simultaneously. Use a cap rate calculator for asset pricing and this tool for loan sizing.
Technically yes, but it’s rarely a problem in practice. Very high debt yield — say, 15%+ — typically signals that the deal is either under-financingd (low loan relative to NOI) or that the asset generates unusually strong income. While lenders won’t reject a deal for having too high a debt yield, extremely high values often indicate the borrower is leaving financing on the table. The more common issue is debt yield that barely clears the floor or fails it. Run a debt yield calculator to find the optimal loan amount that maximizes financing while clearing the lender’s minimum threshold.
Not all, but most institutional lenders do. CMBS conduit programs universally publish minimum debt yield floors. Agency programs (Fannie Mae, Freddie Mac) include debt yield tests in their sizing matrices. Life insurance companies apply them as formal underwriting criteria. Smaller community banks and credit unions may apply them informally or not at all — but FDIC guidance on CRE concentration risk has pushed more banks to formalize income-based metrics, including debt yield. Always ask your lender for their floor before modeling a loan amount.
Significantly. If a property’s NOI declines between origination and loan maturity — due to vacancy, expense increases, or rent softening — the debt yield at refinance may fall below the new lender’s minimum. This forces the borrower to either pay down the loan balance to restore the ratio, accept a smaller loan with increased equity, or sell the asset. Deals that barely clear debt yield floors at origination have the highest refinance risk. Stress-test your debt yield 3–5 years forward using a debt yield calculator before closing, especially on 5- or 10-year fixed-rate loans.
A debt yield calculator requires just two inputs: Net Operating Income (NOI) and loan amount. NOI is gross income minus vacancy and operating expenses, before debt service. Loan amount is the principal requested, not the purchase price or appraised value. For back-solving maximum loan amount, you also input the lender’s minimum debt yield floor. To calculate accurate NOI, use a NOI calculator with actual income and expense data from the property’s financials rather than pro forma projections.
Disclaimer: This article is for educational purposes only and does not constitute financial, investment, or legal advice. Debt yield thresholds, lender requirements, and market conditions change frequently. Always verify current lending criteria directly with your capital sources and consult qualified financial and legal professionals before making investment decisions. Past market conditions are not indicative of future performance.
Leave a Reply