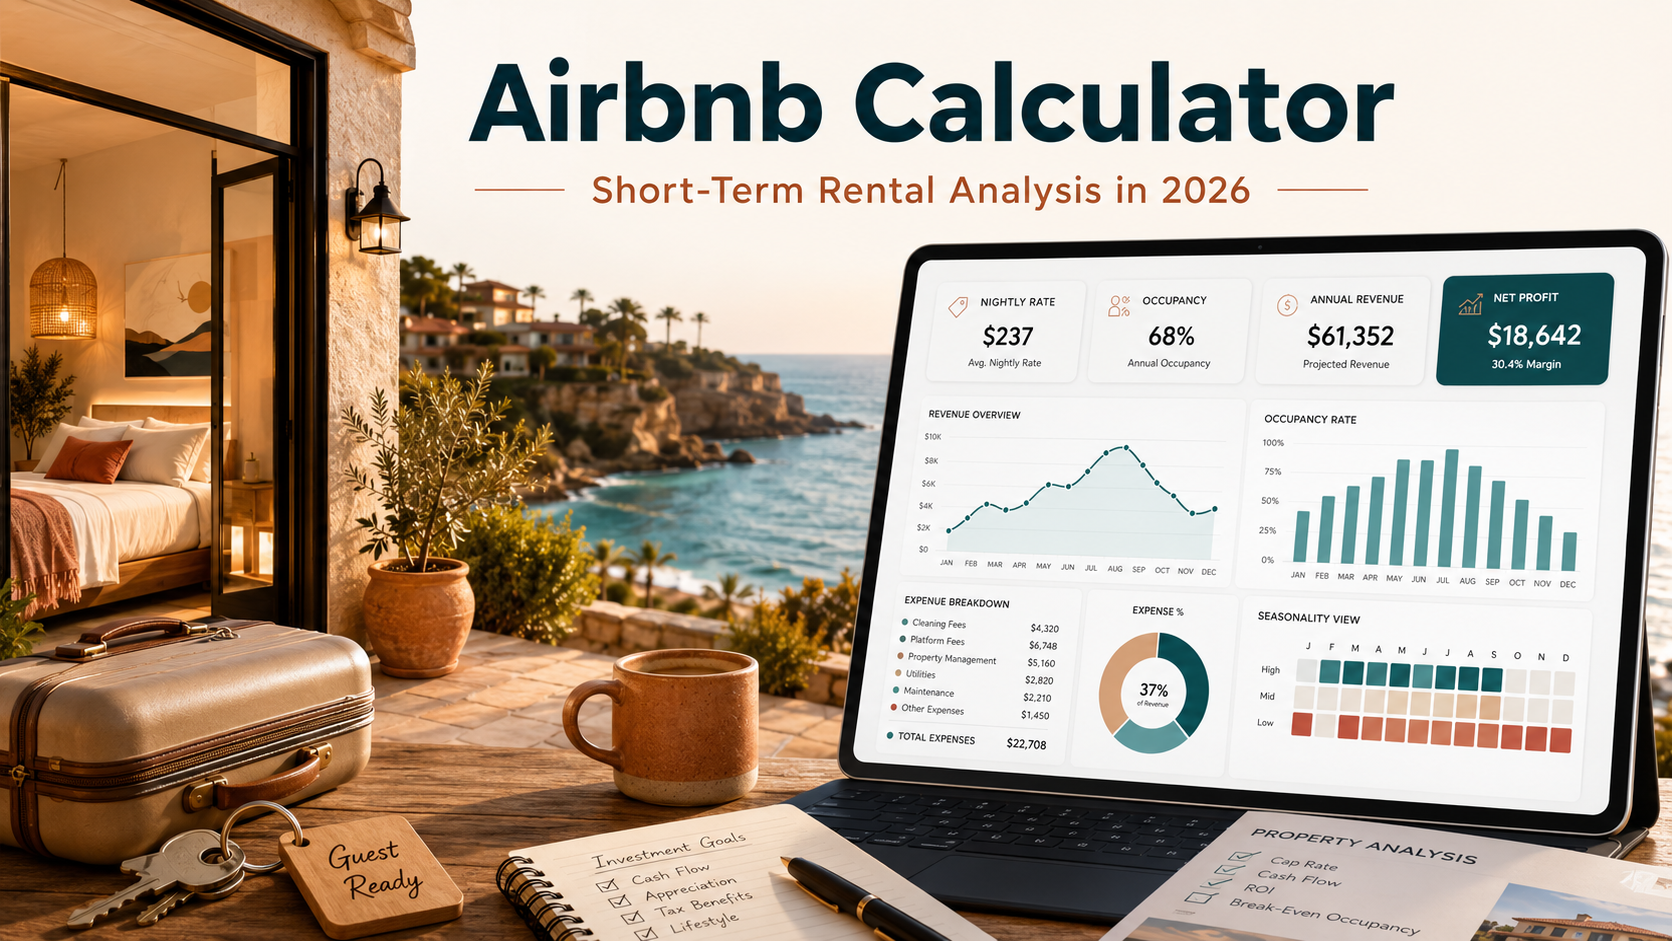
In this article: Use the free Airbnb/STR Calculator to run your own numbers.
- Why STR Analysis Is Different from Long-Term Rental Analysis
- How to Estimate Nightly Rates and Occupancy
- STR-Specific Expenses You Can’t Ignore
- Using an Airbnb Calculator to Model Real Profit
- STR vs. Long-Term Rental: A Side-by-Side Comparison
- Regulatory Risks and Market Saturation
- Common Mistakes STR Investors Make
- When STR Makes Sense — and When It Doesn’t
- FAQ
If you’ve ever tried to underwrite a short-term rental using a standard spreadsheet built for buy-and-hold properties, you already know the problem: the numbers don’t translate. An airbnb calculator built specifically for STR analysis accounts for variable occupancy, cleaning fees, platform commissions, seasonal swings, and furnishing costs — none of which show up in a basic long-term rental model. This guide walks through every variable you need to stress-test a short-term rental deal in 2026, and shows you exactly how to use the right tools so you’re not guessing at returns before you close.

Why STR Analysis Is Different from Long-Term Rental Analysis
Long-term rentals are relatively predictable. You set a monthly rent, sign a 12-month lease, and model a vacancy rate of 5–8%. The biggest variables are your financing costs, property taxes, and the occasional capital expenditure. Short-term rentals work on an entirely different operating model — closer to a hotel business than a passive rental.
Three structural differences change the math completely:
Revenue Is Dynamic, Not Fixed
A long-term rental generates $2,200/month whether it’s January or July. An STR in a beach market might pull $4,500 in August and $800 in February. Annual revenue is the product of nightly rate × occupancy — and both variables move independently. A standard rental property calculator assumes flat monthly income. That assumption breaks immediately when you’re dealing with peak/shoulder/off-season pricing.
In 2026, the national average nightly rate across Airbnb listings sits around $168, but that number is almost meaningless at the property level. Urban condo markets like Phoenix and Nashville are seeing rates compress to $110–$130 as supply has grown faster than demand. Coastal and mountain markets — think Joshua Tree, the Smoky Mountains, coastal Maine — still command $250–$400+ on peak nights.
Operating Expenses Are Higher and More Variable
A typical long-term rental runs expenses at 35–45% of gross rents (the 50% rule is a rough heuristic). STR operating expense ratios routinely run 50–65% of gross revenue once you account for platform fees, cleaning, supplies, property management, and utilities. That’s before furnishing amortization. The cash flow margin is tighter than it looks on the surface, which is exactly why you need a dedicated airbnb calculator rather than a back-of-napkin estimate.
Management Intensity Is Exponentially Higher
Self-managing a long-term rental might cost you 2–3 hours per month. Self-managing an STR — handling guest communications, coordinating cleaning crews, restocking supplies, managing reviews — is a part-time job. If you outsource to a professional STR management company, expect to pay 20–30% of gross revenue. That’s a line item that can flip a deal from marginally profitable to cash-flow negative.
How to Use an Airbnb Calculator to Estimate Nightly Rates and Occupancy
This is where most first-time STR investors go wrong. They look at the top listings in a market, see $350/night, and model that rate at 80% occupancy. The reality is almost never that clean.
Use Market Data, Not Wishful Thinking
AirDNA, Rabbu, and Mashvisor all publish market-level STR data. For 2026 underwriting, focus on the following metrics:
- Average Daily Rate (ADR): What comparable listings in your submarket actually charge, not what they list for.
- Occupancy Rate: National STR occupancy averaged around 54% in 2025 and has held relatively flat into 2026. High-demand markets run 62–72%. Saturated urban markets are seeing 40–48%.
- RevPAR (Revenue Per Available Room): ADR × Occupancy — this is the single most useful top-line metric for STR comparison.
Pull data for listings with similar bedroom count, amenity set, and location radius. A 2BR condo downtown is not comparable to a 4BR house with a pool in the same zip code. The vacancy rate calculator can help you model different occupancy scenarios and their impact on annual revenue.
Model Three Scenarios
Professional STR underwriters don’t model one occupancy rate. They build a base case, a bear case, and a bull case:
- Bear case: ADR 15% below market average, occupancy at 45%. This is what the deal needs to survive.
- Base case: Market ADR, occupancy at 55–60%.
- Bull case: ADR 10% above market (seasoned listing with strong reviews), occupancy at 65–70%.
If the bear case still cash flows, the deal is worth serious consideration. If it only works in the bull case, you’re speculating, not investing.
Run these scenarios through a property cash flow calculator to see how revenue swings affect your bottom line at the annual level before you ever talk to a lender.
STR-Specific Expenses You Can’t Ignore
The expense side is where STR deals most often get underestimated. Here’s a complete breakdown of costs that don’t apply to long-term rentals or that apply at a significantly higher magnitude.
Platform Fees and Channel Distribution
Airbnb charges hosts a service fee of approximately 3% per booking on the split-fee model. VRBO typically runs 5% on the host fee. If you’re using a channel manager to distribute across multiple platforms, add another $50–$150/month in software costs. Total platform costs typically represent 5–8% of gross revenue depending on your distribution strategy.
Cleaning and Turnover Costs
This is the expense that surprises people most. Professional cleaning for a 2BR STR in most metros runs $120–$180 per turnover in 2026. At 60% occupancy with an average stay of 3 nights, you’re turning the property roughly 73 times per year. That’s $8,760–$13,140 in cleaning costs alone. For a property generating $40,000 in gross revenue, cleaning might represent 22–33% of gross — a number that never appears in any long-term rental model.
Many operators pass some cleaning cost to guests via a cleaning fee. This partially offsets the expense but can suppress booking rates if the fee is too high relative to the nightly rate.
Supplies and Consumables
Toilet paper, soap, shampoo, coffee pods, paper towels, dishwasher pods — an STR functions like a hotel and guests expect hotel-level stocking. Budget $300–$600/month for consumables depending on property size and turnover frequency.
Furnishing and Setup Costs
Unlike long-term rentals, STRs must be fully furnished and photo-ready. A professional 2BR STR setup — furniture, linens, kitchen equipment, decor — runs $15,000–$35,000 in most markets in 2026. Higher-end listings in competitive markets may require $50,000+ to stand out. This is a capital cost you’ll amortize over 5–7 years. On a $25,000 furnishing cost amortized over 6 years, you’re adding roughly $347/month to your effective expense load.
Utilities
STR owners cover utilities in almost all cases. Budget $250–$450/month for electricity, gas, water, and internet depending on climate and property size. Summer and winter peaks can spike electric bills significantly in HVAC-intensive climates.
Property Management
Professional STR management runs 20–30% of gross revenue — roughly double what you’d pay for long-term rental management. Use the property management fee calculator to model the impact of management costs across different gross revenue scenarios. For a property grossing $48,000/year, a 25% management fee is $12,000 — a line item that fundamentally changes your return profile.
Insurance
Standard homeowner’s insurance does not cover commercial short-term rental activity. STR-specific insurance (from providers like Proper Insurance or CBIZ) runs $2,000–$5,000/year depending on property size, location, and coverage level. This is non-negotiable; Airbnb’s AirCover program is not a substitute for actual property insurance.
Using an Airbnb Calculator to Model Real Profit
A purpose-built airbnb calculator pulls all of these variables together into a coherent picture of annual cash flow, cash-on-cash return, and net operating income. Here’s how to use one effectively rather than just plugging in optimistic numbers and calling it underwriting.
Start with gross revenue. Enter your projected ADR and occupancy rate for each month — or use an annual average if you don’t have seasonal data. The airbnb calculator should output annual gross revenue. For a 2BR in a mid-tier market at $165 ADR and 58% occupancy: $165 × 0.58 × 365 = $34,951.
Next, model the full expense stack:
- Platform fees (6%): $2,097
- Cleaning (73 turnovers × $150): $10,950
- Supplies/consumables: $4,800
- Utilities: $4,200
- Insurance (STR-specific): $3,200
- Property taxes: market-dependent, assume $4,500
- Property management (25%): $8,738
- Furnishing amortization: $4,167
- Maintenance and repairs: $2,500
- Total expenses: $45,152
In this scenario, gross revenue of $34,951 is negative after expenses — the deal doesn’t work at these inputs. Bump occupancy to 70% and ADR to $185 and gross revenue jumps to $47,267, which leaves $2,115 in net operating income before debt service. Still thin.
This is exactly why running the numbers through a proper airbnb calculator before falling in love with a property is so important. The math is not forgiving, and optimistic assumptions compound quickly.
For the NOI figure, cross-reference with the NOI calculator to confirm your operating expense assumptions are complete. Then run the deal through the cap rate calculator — note that STR cap rates need to be compared against STR-specific market benchmarks, not residential long-term rental cap rates, which are typically lower.
Use the cash-on-cash calculator to determine your actual return on invested capital after accounting for your down payment, closing costs, and furnishing setup. Cash-on-cash return is the most practical metric for STR investors because it reflects what your actual dollars are earning, not a theoretical stabilized value. The rental property ROI calculator can layer in appreciation assumptions if you want a total return picture.
If you’re financing the deal, plug your debt service into the DSCR calculator. Most STR-friendly lenders in 2026 require a DSCR of 1.20–1.25 based on either projected STR income (using a market income letter) or the property’s long-term rental equivalent. Know which method your lender uses before you model.
STR vs. Long-Term Rental: A Side-by-Side Comparison
The decision between operating a property as an STR versus a long-term rental isn’t always obvious. The higher gross revenue of STR comes with higher expenses, higher management intensity, and higher regulatory risk. Here’s how the same property might look under both operating models.
Example: 3BR house, purchase price $380,000, mid-tier market
| Metric | STR (Airbnb) | Long-Term Rental |
|---|---|---|
| Gross Annual Revenue | $58,400 | $28,800 |
| Operating Expense Ratio | 58% | 42% |
| Net Operating Income | $24,528 | $16,704 |
| Cap Rate | 6.45% | 4.40% |
| Management Intensity | High | Low |
| Regulatory Risk | High | Low |
| Furnishing Capital Required | $20,000–$35,000 | $0 |
The STR produces meaningfully higher NOI in this example, but the spread narrows quickly if occupancy drops, a management company is added, or local regulations force conversion to long-term rental. Use the gross rent multiplier calculator to compare how both scenarios are valued relative to purchase price — and whether the STR premium justifies the operational complexity.
The mortgage calculator for investment properties can model your debt service under both scenarios, which is critical if you’re evaluating whether the STR premium is enough to cover a higher interest rate (STR loans often price at 0.25–0.75% above standard investment property rates in 2026).
Regulatory Risks and Market Saturation
The single largest underappreciated risk in STR investing is regulatory change. Cities across the country have significantly tightened STR rules since 2022, and the trend has accelerated into 2026. New York City’s Local Law 18 effectively eliminated most Airbnb listings in Manhattan and Brooklyn. Boston, San Francisco, New Orleans, and dozens of smaller markets have enacted permitting caps, owner-occupancy requirements, or outright bans in certain zones.
According to data from the U.S. Census Bureau, housing affordability pressure has driven municipal governments to prioritize long-term housing supply over STR activity — a trend that shows no signs of reversing. The National Association of Realtors has documented the policy shift extensively in its housing market reports, noting that 28% of top STR markets have enacted some form of new restriction since 2023.
Before closing on any STR deal, you need to confirm:
- Whether STR permits are available and how many are issued per zone
- Whether owner-occupancy is required (which eliminates the investment model entirely)
- Whether there are pending ordinances that could change the rules within 12–24 months
- What the penalty structure is for operating without a permit
- Whether HOA rules permit STR activity (many newer condo buildings have banned it outright)
Market saturation is a separate but related issue. In markets where supply has grown faster than demand — Nashville, Phoenix, Dallas, and parts of Florida — occupancy rates have declined 8–12 percentage points since 2022 peaks while ADR has stagnated. Running an airbnb calculator with 2021 occupancy data in these markets will dramatically overstate your expected income.
Common Mistakes When Using an the calculator
After looking at hundreds of STR deals, the same errors appear repeatedly. Avoiding these is worth more than any single optimization strategy.
Modeling Peak Performance as the Base Case
Searching “top Airbnb listings in Scottsdale” and modeling $280/night at 75% occupancy is not underwriting — it’s a fantasy built on survivorship bias. The listings you see on the first page of Airbnb search are the top 5% performers with years of reviews, professional photography, and optimized pricing algorithms. New listings don’t get that treatment. Model your first year at 20–30% below market average occupancy while you build your review base.
Ignoring the Furnishing Capital Requirement
Many investors calculate their down payment, closing costs, and cash reserves — and then forget that they need to spend another $20,000–$35,000 before the first guest books. This capital comes out of your liquidity. Use the closing costs calculator to map your total cash-to-close, and then add furnishing costs on top so you have a realistic picture of total capital deployed. That total is what goes in the denominator of your cash-on-cash return calculation.
Not Accounting for Seasonality in Cash Flow Projections
An STR that generates $7,000 in July and $1,200 in January creates cash flow timing problems even if the annual average looks fine. Your mortgage payment doesn’t adjust for your slow season. Model monthly cash flow, not just annual averages, and make sure you have 3–4 months of operating expenses in reserve to cover the shoulder season trough.
Underestimating Management Time or Cost
Self-management of an STR is a genuine second job. Investors who underestimate this either burn out and hire a manager (at 25% of revenue they didn’t budget for) or let guest experience suffer and watch their reviews — and therefore their occupancy — decline. Be honest about your bandwidth before you buy. The property management fee calculator will show you exactly what professional management costs across different revenue scenarios.
Buying in a Market Without Checking Permit Availability
This is the mistake that ends careers. Buying a property in a jurisdiction where STR permits are capped, unavailable, or require owner occupancy — without checking first — can leave you holding a property that generates 40% less revenue than your model assumed. Always verify permit status before earnest money goes hard.
When the this tool Shows a Green Light — and When It Doesn’t
The airbnb calculator is a tool for answering a specific question: does this property generate enough STR income to justify the premium over long-term rental returns? The answer is highly market-specific.
STR tends to make sense when:
- The property is in a destination market with genuine year-round or strong seasonal demand (beach towns, ski towns, national park adjacency, major event cities)
- STR gross revenue exceeds long-term rental gross revenue by at least 40–50% — enough to absorb the higher expense ratio and still produce superior NOI
- Permits are available, regulations are stable, and there’s no owner-occupancy requirement
- You (or a manager) have the operational capacity to run a hospitality business
- The property has amenities that command a premium (pool, hot tub, unique design, walkability) rather than competing on price alone
STR tends not to make sense when:
- The market is saturated and occupancy rates are trending below 50%
- Regulatory risk is high or permits are actively being restricted
- The STR revenue premium over long-term rental is less than 30% — not enough to cover the additional operating costs
- The property is in a purely residential area without tourism demand drivers
- You need a passive investment — STR is not passive
- The deal only works in the bull case scenario of the airbnb calculator
When STR doesn’t pencil out, that doesn’t necessarily mean the property is a bad investment — it might be an excellent long-term rental. Use the rental property calculator to model LTR returns alongside your STR model. Sometimes the cleaner, lower-maintenance long-term rental structure produces better risk-adjusted returns even if the gross income is lower.
The airbnb calculator gives you one picture. The full investment analysis requires comparing it against the alternatives, stress-testing it against regulatory scenarios, and being honest about what happens to your returns if occupancy comes in 15 points below your base case. Run all the numbers. Then decide.
Frequently Asked Questions
An this tool is a tool designed specifically for short-term rental financial analysis. Unlike a standard rental property calculator, it accounts for variable occupancy rates, nightly pricing, platform fees (typically 3–6%), cleaning costs per turnover, seasonal revenue swings, furnishing amortization, and STR-specific insurance. The output includes projected gross revenue, net operating income, cap rate, and cash-on-cash return based on your actual invested capital.
National average STR occupancy sits around 54% in 2026, but market-level data matters far more than national averages. High-demand destination markets like the Smoky Mountains or coastal Cape Cod run 62–72%. Saturated urban markets — Phoenix, Nashville, parts of Florida — are seeing 40–50%. For underwriting, use a bear case of 45%, a base case of 55–60%, and model the deal surviving at the bear case. Pull actual market data from AirDNA or Rabbu rather than relying on listed averages.
Beyond the down payment and closing costs, expect to spend $15,000–$35,000 furnishing and equipping a 2–3 bedroom STR in 2026. Higher-end properties in competitive markets may require $50,000+ to achieve the visual quality needed to rank well in search and command above-average nightly rates. This capital is typically amortized over 5–7 years in your expense model. Many first-time STR investors forget this cost entirely when calculating their total capital deployed and cash-on-cash return.
Airbnb’s split-fee model charges hosts approximately 3% per booking. If you add VRBO at 5% and distribute across additional channels, total platform fees typically run 5–8% of gross revenue. On top of that, if you use a professional STR property manager, they’ll charge 20–30% of gross revenue. Combined, platform and management costs can consume 25–35% of your gross income before you’ve paid a single property-level expense. Running these numbers through an the calculator makes the cumulative impact immediately clear.
It depends entirely on the market and the property. STR gross revenue is typically 40–100% higher than long-term rental income for the same property in destination markets, but STR operating expense ratios run 55–65% versus 35–45% for long-term rentals. The net result varies: in strong STR markets, NOI can be 30–50% higher than a comparable long-term rental. In saturated urban markets, the STR premium barely covers the additional operating costs. The only way to know is to run both scenarios through the appropriate calculators and compare actual NOI, not just gross revenue.
Permit caps are the most immediate risk — many cities issue a fixed number of STR permits and when they’re gone, they’re gone. Owner-occupancy requirements effectively eliminate the investment model for non-primary residences. Outright bans in certain zoning districts can strand a property you assumed was STR-eligible. HOA rules in condo buildings are increasingly prohibiting STR activity entirely. Before closing on any STR deal, confirm current permit availability, check for pending ordinances, review HOA documents, and consult a local real estate attorney who specializes in short-term rental regulations.
Disclaimer: This article is for educational purposes only and does not constitute financial, legal, or investment advice. Short-term rental regulations, market conditions, and tax rules vary by location and change frequently. All financial figures and projections are illustrative examples only. Consult qualified financial, legal, and tax professionals before making any real estate investment decision. Past performance of any market or investment strategy does not guarantee future results.
Leave a Reply