Last updated: September 15, 2026 · Originally published: July 16, 2026 · By Alex Petrov
Texas gets marketed as the ultimate cash flow state — no income tax, booming population, landlord-friendly laws — but investors who run the actual numbers often walk away surprised. The state’s property tax rate, averaging close to 2% of assessed value annually, quietly guts net operating income in ways that out-of-state buyers rarely anticipate. Before you wire a down payment on a Dallas duplex or a Houston fourplex, you need to understand what a realistic Texas cap rate actually looks like in 2026.
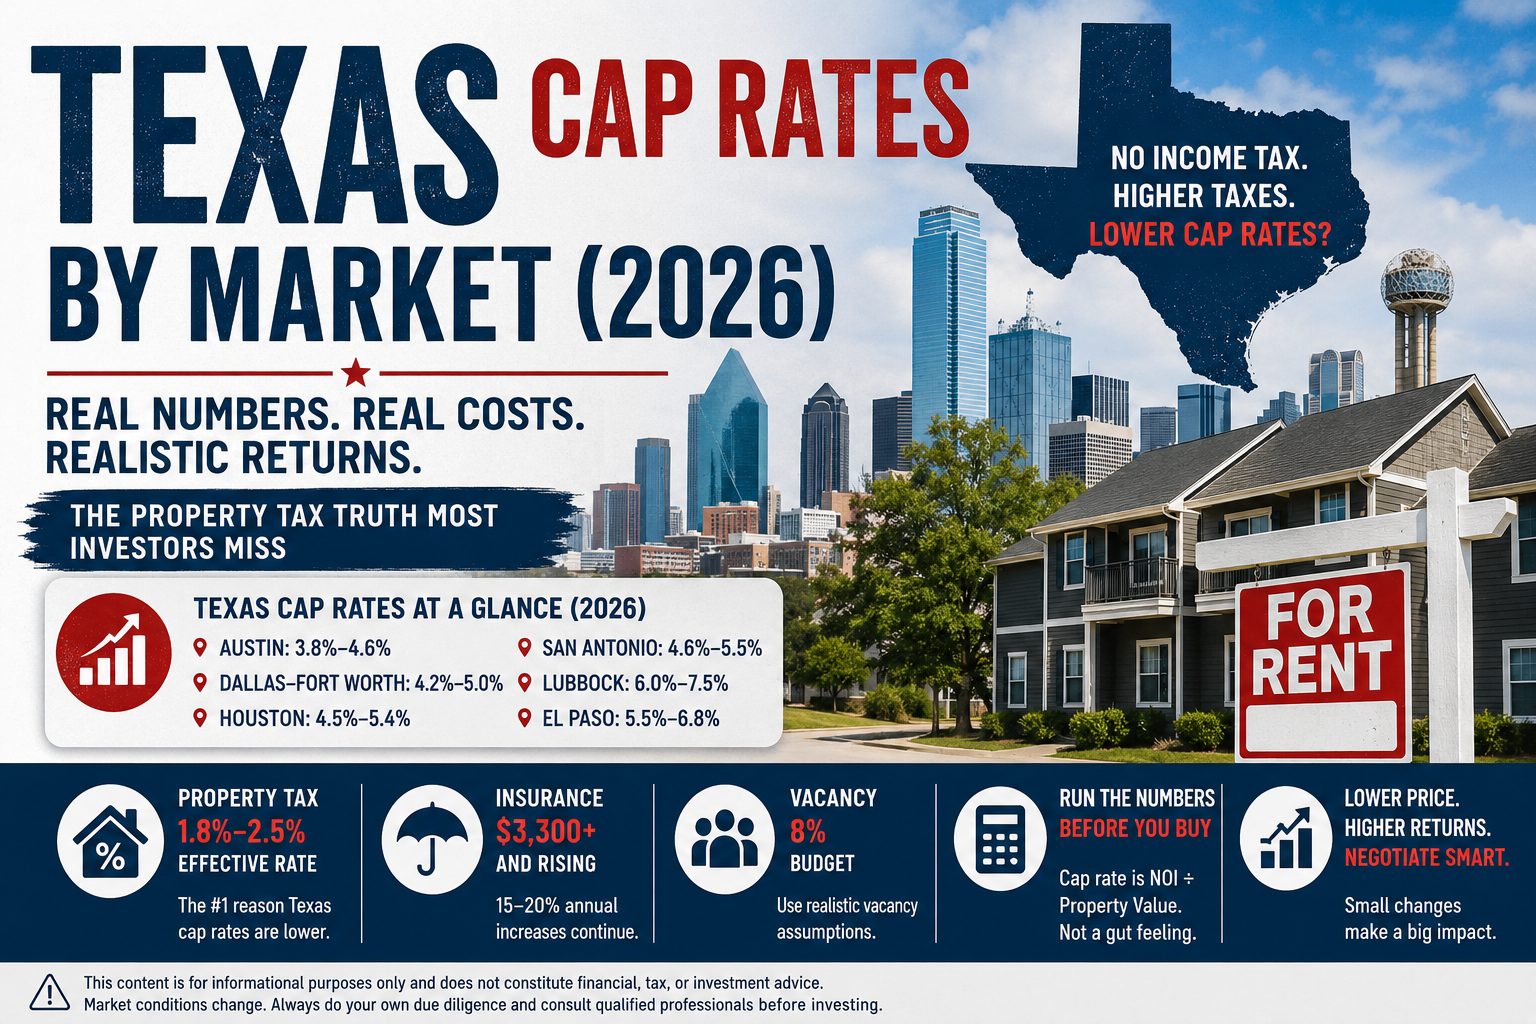
- Austin: SFR 3.8–4.6% | Small multifamily 4.2–5.1% | Commercial 5.0–6.5%
- Dallas–Fort Worth: SFR 4.2–5.0% | Small multifamily 4.8–5.8% | Commercial 5.5–7.0%
- Houston: SFR 4.5–5.4% | Small multifamily 5.0–6.2% | Commercial 5.8–7.2%
- San Antonio: SFR 4.6–5.5% | Small multifamily 5.2–6.4% | Commercial 6.0–7.5%
- Lubbock: SFR 6.0–7.5% | Small multifamily 6.5–8.0% | Commercial 7.0–8.5%
- El Paso: SFR 5.5–6.8% | Small multifamily 6.0–7.5% | Commercial 6.5–8.0%
Numbers reflect stabilized assets at current market prices. High property taxes, Improved insurance, and 8%+ vacancy are already baked in. Use the Texas cap rate calculator to model your specific deal.
What Is Texas Cap Rate and Why It Matters
Capitalization rate — cap rate — is the ratio of a property’s net operating income to its purchase price or current market value:
Cap Rate = Net Operating Income (NOI) ÷ Property Value × 100
NOI is gross rental income minus all operating expenses — property taxes, insurance, property management, maintenance, vacancy allowance, and any recurring capital costs. It does not include mortgage payments. Cap rate is a pre-financing metric, which makes it useful for comparing deals regardless of how they are funded.
In most states, property tax runs 0.5–1.2% of assessed value per year. In Texas, the effective rate for residential investment property in major metros typically lands between 1.8% and 2.5%. That difference is not a rounding error. On a $420,000 fourplex:
- At a 1.0% effective tax rate: annual tax bill ≈ $4,200
- At a 2.0% effective tax rate: annual tax bill ≈ $8,400
- At a 2.5% effective tax rate: annual tax bill ≈ $10,500
That $4,200–$6,300 swing goes straight out of NOI. On a $420,000 asset, a $6,300 NOI reduction by itself lowers the Texas cap rate by roughly 1.5 percentage points before you touch any other expense. This is the single most important mechanical fact about investing in Texas — and most investors from lower-tax states learn it the hard way.
The cap rate calculator on ArvCalc lets you input your actual local tax rate so the output reflects Texas reality, not a national average.
Texas Cap Rates by Metro
Cap rates vary significantly across the state’s six major investment markets. The table below reflects stabilized, fully-leased assets at late-2025 and early-2026 transaction pricing. Values assume professional management, normalized vacancy, and current insurance costs.
| Metro | SFR Cap Rate | Small Multifamily (2–4 units) | Commercial / 5+ Units | Median Home Price (2026 est.) |
|---|---|---|---|---|
| Austin | 3.8–4.6% | 4.2–5.1% | 5.0–6.5% | ~$525,000 |
| Dallas–Fort Worth | 4.2–5.0% | 4.8–5.8% | 5.5–7.0% | ~$385,000 |
| Houston | 4.5–5.4% | 5.0–6.2% | 5.8–7.2% | ~$310,000 |
| San Antonio | 4.6–5.5% | 5.2–6.4% | 6.0–7.5% | ~$280,000 |
| Lubbock | 6.0–7.5% | 6.5–8.0% | 7.0–8.5% | ~$195,000 |
| El Paso | 5.5–6.8% | 6.0–7.5% | 6.5–8.0% | ~$210,000 |
Sources: Texas Real Estate Research Center market reports, Redfin price data, local county appraisal district records. Cap rate ranges represent observed market transactions; individual deals vary based on condition, submarket, and lease terms.
The pattern is clear: secondary and tertiary markets like Lubbock and El Paso offer meaningfully higher Texas cap rates than Austin or Dallas, primarily because purchase prices are lower relative to rent levels. The trade-off is thinner tenant demand, narrower buyer pools when you exit, and less institutional capital setting pricing floors. See how Texas stacks up against the rest of the country on the cap rate by state comparison.
Why Texas Cap Rates Are Lower Than You Expect
Four expense categories consistently surprise investors who underwrite Texas deals using out-of-state assumptions.
Property Tax: The 2% Problem
Texas has no state income tax, but it funds local services almost entirely through property taxes. According to the Tax Foundation, Texas ranks in the top five states nationally for effective property tax rates on owner-occupied homes. For investment properties — which do not qualify for the homestead exemption — effective rates in Harris, Dallas, Tarrant, and Travis counties often run 2.1–2.6% of appraised value. Every dollar paid in property tax is a dollar removed from NOI, which directly compresses the Texas cap rate.
Insurance: $3,300 and Rising Fast
Average landlord insurance on a Texas rental property runs approximately $3,200–$3,500 per year in 2026, depending on location, age, construction type, and coverage limits. That is already well above the national median. More critically, Texas insurance premiums have been rising 15–20% annually following a string of hailstorms, winter storm Uri legacy claims, and Hurricane Beryl flooding losses. Underwriting that assumes flat insurance costs will be wrong within two years.
Vacancy: Budget 8%, Not 5%
National underwriting templates often use 5% vacancy. Texas major metro vacancy for small residential rentals has been running closer to 7–9% in 2025–2026 as new apartment supply — particularly in Austin and DFW — works through the market. The Texas Real Estate Research Center at Texas A&M University tracks vacancy by market; investors should pull current data for their specific submarket rather than using statewide averages.
No State Income Tax Does Not Help Cap Rate
This point trips up a lot of first-time Texas investors. The absence of state income tax improves your after-tax cash-on-cash return — a personal finance metric — but it does not touch cap rate at all. Cap rate is calculated before financing costs and before income taxes. It is a property-level metric, not an investor-level one. Texas’s no-income-tax advantage is real, but it cannot compensate for the property tax drag on NOI.
Use the Texas rental property calculator to model all four of these expense categories together so you see the full NOI picture before committing to a deal.
Worked Example: Cap Rate on a Houston Fourplex
Let’s ground the math in a real deal. A fourplex in northwest Houston — a B-class neighborhood, built 1985, recently renovated — lists at $420,000. All four units rent for $1,200 per month.
Step 1: Gross Scheduled Income
4 units × $1,200/month × 12 months = $57,600/year
Step 2: Vacancy Allowance (8%)
$57,600 × 8% = $4,608 vacancy loss
Effective Gross Income = $57,600 − $4,608 = $52,992
Step 3: Operating Expenses
| Expense | Annual Amount |
|---|---|
| Property Tax (2.0% of $420K) | $8,400 |
| Insurance | $3,400 |
| Property Management (8% EGI) | $4,239 |
| Maintenance & Repairs | $4,000 |
| CapEx Reserve | $2,800 |
| Landscaping / Utilities (common) | $1,200 |
| Total Operating Expenses | $24,039 |
Step 4: Net Operating Income and Cap Rate
NOI = $52,992 − $24,039 = $28,953
Cap Rate = $28,953 ÷ $420,000 = 6.9%
That looks reasonable for Houston. But watch what happens when we adjust only the property tax rate — a variable that is entirely outside the investor’s control at purchase:
| Tax Rate Scenario | Annual Tax Bill | NOI | Cap Rate |
|---|---|---|---|
| 1.5% (favorable assessment) | $6,300 | $31,053 | 7.4% |
| 2.0% (base case) | $8,400 | $28,953 | 6.9% |
| 2.5% (post-purchase reassessment) | $10,500 | $26,853 | 6.4% |
A single reassessment cycle can cost you 0.5 percentage points of cap rate with no change in rent or any other expense. This is not a hypothetical — Harris County alone reassesses annually, and purchased properties frequently see assessed values jump to match the sale price within one to two years. Run your numbers with the Texas cap rate calculator using the 2.5% scenario as your stress test.
How to Improve Cap Rate on a Texas Property
Unlike insurance rates or tax policy, several cap rate levers are within an investor’s direct control.
Negotiate the Purchase Price
Cap rate is a fraction. Buying at a lower price improves it mechanically. In the Houston fourplex example above, purchasing at $390,000 instead of $420,000 — with the same NOI of $28,953 — lifts the cap rate from 6.9% to 7.4%. Days on market for Texas investment properties have lengthened in 2026 relative to the 2021–2022 peak, giving buyers more negotiating room than they had in recent years. Check active Texas real estate investment data to see current pricing trends before you anchor on list price.
Increase Gross Rents
Every dollar of additional annual rent flows directly to NOI. If you can raise all four units in the Houston example by $75/month, that adds $3,600 to NOI and lifts the cap rate by roughly 0.85 points on a $420,000 asset. Verify rents against comparable leases — Redfin’s rental market data provides submarket-level rent trends that can anchor your underwriting.
Contest the Tax Assessment
Texas property owners have the right to protest assessed value at their county appraisal review board. The protest deadline is typically May 15 each year, though it varies by county. Investors who gather comparable sales and income data — especially rent rolls showing actual income below what the county assumes — can often achieve meaningful reductions. A successful protest on a $420,000 property that brings assessed value down to $390,000 at a 2% rate saves $600/year, which translates directly into higher cap rate.
Shop Insurance Annually
Texas insurance markets remain competitive even as premiums rise. Switching carriers or adjusting deductibles can save $400–$800 per year on a small multifamily property. Bundling multiple properties with one carrier often unlocks additional discounts. Given the 15–20% annual premium trend, complacency on insurance renewal is expensive.
Reduce Vacancy Through Active Management
Moving from 8% vacancy to 5% on a fourplex generating $57,600 in gross scheduled income adds $1,728 to EGI annually. This often requires proactive renewal outreach starting 90 days before lease expiration, competitive pricing, and fast unit turn between tenants. The Texas rental property investment guide covers management strategies in more depth.
Texas Cap Rate vs Other States
Context matters. The cap rate only tells you something useful when you compare it to your alternatives. The table below places Texas against four other commonly targeted investment states.
| State | Median SFR Price | Eff. Property Tax Rate | Avg. Landlord Insurance | Typical SFR Cap Rate | State Income Tax |
|---|---|---|---|---|---|
| Texas | ~$320,000 | 1.8–2.5% | ~$3,400 | 4.5–5.5% | None |
| Florida | ~$395,000 | 0.8–1.2% | ~$4,800 | 4.0–5.2% | None |
| Ohio | ~$210,000 | 1.4–1.8% | ~$1,600 | 6.5–8.5% | Up to 3.99% |
| Georgia | ~$295,000 | 0.9–1.3% | ~$1,900 | 5.5–7.0% | 5.49% flat |
| Arizona | ~$375,000 | 0.5–0.8% | ~$1,400 | 4.5–5.8% | 2.5% flat |
Ohio and Georgia consistently offer higher cap rates than Texas on a pure NOI basis, largely because property taxes and insurance are lower and purchase prices in secondary Ohio markets are substantially below Texas equivalents. Florida faces hurricane insurance that rivals or exceeds Texas windstorm exposure in coastal zones. Arizona’s property tax advantage is significant — an effective rate below 1% means substantially more NOI flows to the investor compared to a comparable Texas asset. For a full comparison, the cap rate by state guide covers all 50 states with current data.
None of this means Texas is a bad market. It means the investment thesis needs to be built on rent growth, population-driven appreciation, and operating efficiency — not outsized cap rates at acquisition. Understanding cap rate versus other return metrics is covered in depth in the what is a good cap rate article.
Common Mistakes When Evaluating a Texas Cap Rate
Mistake 1: Using National Cap Rate Benchmarks
You will see articles claiming that a “good” cap rate for residential rentals is 6–8%. That benchmark is derived from national averages that include markets with property tax rates of 0.5–1.0%. Applying that benchmark to Austin or DFW — where the 2%+ tax rate eats 1.5–2 full points of what would otherwise be NOI — leads investors to overpay for assets that underperform on a cash flow basis. Use Texas-specific benchmarks, which are meaningfully lower than national ones. The good cap rate guide breaks this down by market tier.
Mistake 2: Ignoring Tax Reassessment After Purchase
Texas appraisal districts are required by law to appraise property at market value. When you buy a property and register the deed, you have just created a public data point — the sale price — that the county’s appraisal district can reference. Properties purchased significantly above their existing assessed value frequently see assessed values rise to match the sale price within one to two years. Investors who model the current tax bill rather than the post-reassessment bill are building on an assumption that will break. Always stress test your cap rate at the higher tax scenario before closing.
Mistake 3: Treating Insurance as a Fixed Expense
Underwriting insurance at $3,200/year today and assuming it stays flat through your hold period is financially dangerous in Texas. With premiums rising 15–20% per year in many markets, a five-year hold could see insurance more than double. Model insurance escalation explicitly — even a conservative 10% annual increase materially impacts projected NOI in years three through five of ownership.
Mistake 4: Comparing Gross Yield to Cap Rate
Gross yield — annual rent divided by purchase price, with no expense deduction — is not cap rate. A property generating $36,000 in annual rent on a $420,000 purchase has an 8.6% gross yield. After Texas expenses, the same property might produce a 5.2% cap rate. Sellers and listing platforms sometimes advertise gross yield numbers without labeling them as such; investors who confuse this metric with cap rate will dramatically misunderstand what they are buying. The cap rate vs GRM comparison clarifies these metrics in detail.
Frequently Asked Questions
Disclaimer: This article is for informational purposes only and does not constitute financial, tax, or investment advice. Real estate markets change rapidly; cap rate ranges and pricing data reflect conditions at the time of writing and may not reflect current market conditions in your target submarket. Always conduct your own due diligence, verify local tax rates with the relevant county appraisal district, obtain current insurance quotes, and consult qualified financial and legal professionals before making any investment decision.
Leave a Reply