Last updated: September 21, 2026 · Originally published: June 30, 2026 · By Alex Petrov
You’re standing in front of two duplexes on the same Cleveland street. One is listed at $285,000 with $2,100/month in rents. The other is $310,000 with $2,400/month. Which one wins? If you answer that question using only gross rent multiplier, you’ll miss half the story. If you answer it using only cap rate, you might be comparing apples to oranges. Both metrics matter — the trick is knowing what each one actually tells you, and when to reach for which one.
What Is Cap Rate?
Cap rate — short for capitalization rate — measures a property’s return based on its net operating income relative to its market value. It strips out financing entirely, so you’re comparing properties on equal footing regardless of how they’re funded.
Formula: Cap Rate = Net Operating Income ÷ Property Value × 100
Say you have a rental property worth $400,000. After collecting $36,000 in gross rents and paying $14,000 in operating expenses (taxes, insurance, property management, maintenance, vacancy), your NOI is $22,000. Divide $22,000 by $400,000 and you get a 5.5% cap rate.
Cap rate reflects real profitability. It accounts for the actual costs of owning and operating the property — not just the top-line rent. That makes it the go-to metric for serious underwriting. You can learn more about how it’s calculated and what makes a strong number in the cap rate guide, or run your own numbers instantly with the Cap Rate Calculator.
What Is GRM?
Gross rent multiplier is a faster, rougher measure. It tells you how many years of gross rent it would take to equal the purchase price — nothing more.
Formula: GRM = Property Price ÷ Gross Annual Rent
Take that same $400,000 property with $36,000 in annual gross rents. GRM = $400,000 ÷ $36,000 = 11.1. That means the property costs 11.1 times its annual gross rent.
Lower is generally better. A GRM of 8 in Memphis beats a GRM of 14 in San Jose from a raw income perspective. But GRM doesn’t care what you actually spend on the property. It ignores vacancy, repairs, taxes, insurance — all the things that determine whether you make money or lose it. That’s why it’s a screening tool, not an underwriting tool. For a deeper look at how GRM is used in practice, the GRM guide walks through the full methodology.
Cap Rate vs GRM: Key Differences
These two metrics answer different questions. Understanding where they diverge tells you a lot about how to use each one in your investment process.
| Feature | Cap Rate | GRM |
|---|---|---|
| Accounts for operating expenses | Yes | No |
| Accounts for vacancy | Yes | No |
| Financing independent | Yes | Yes |
| Speed of calculation | Slower (needs NOI) | Fast (needs price + rent) |
| Data required | Full expense breakdown | Price and gross rent only |
| Best for | Underwriting, closing decisions | Quick screening, market comparison |
| Useful at MLS stage | Rarely (expense data not available) | Yes |
| Risk of misleading you | Lower (if expense data is accurate) | Higher (ignores costs) |
Both metrics ignore financing — neither cap rate nor GRM tells you what your mortgage payment will be. For that, you need cash-on-cash return or DSCR. But that shared limitation is also what makes them useful for apples-to-apples comparison across different markets and deal sizes.
The real difference is depth. Cap rate requires you to know your NOI — which means you need realistic vacancy estimates, accurate expense projections, and a firm handle on market rents. GRM asks for two numbers anyone can pull from a listing. That simplicity is its strength and its weakness.
When to Use Cap Rate
Cap rate is your primary underwriting metric when you’re close to making a decision. Here’s when it earns its keep:
Comparing Properties in the Same Market
If you’re looking at three eight-unit apartment buildings in Indianapolis, cap rate cuts through the noise. Each property has different unit mixes, different expense profiles, different vacancy histories. Cap rate translates all of that into a single comparable number. A 7.2% cap rate on one building versus a 5.8% cap rate on another — in the same submarket — tells you something real about relative value.
Setting a Purchase Price
Commercial brokers routinely price multifamily deals by dividing NOI by a market cap rate. If four-plexes in Cincinnati are trading at a 6.5% cap rate and your target property generates $28,000 in NOI, the math says its market value should be around $430,000. If it’s listed at $525,000, you know you’re being asked to overpay — or you need to believe you can dramatically increase the NOI.
Evaluating Stabilized Assets
Cap rate works best on properties with a track record — two or more years of actual rent rolls and actual expense statements. Projecting NOI on a vacant or heavily renovated property introduces too much uncertainty. For those deals, you’ll need to use pro-forma cap rates carefully and stress-test your assumptions. The NOI Calculator can help you model different scenarios before you commit.
Benchmarking Against Market Standards
According to Investopedia, cap rates between 4% and 10% are typical for most property types, though they vary significantly by market. Coastal markets like Los Angeles or Boston often see cap rates of 3–5% for multifamily; tertiary Midwest markets might see 7–9%. Knowing the market benchmark — you can find state-by-state data at the cap rate by state guide — tells you whether a deal is priced at, above, or below where the market sits.
When to Use GRM
GRM isn’t a lesser metric — it’s a different tool for a different job. Use it when you need speed or when expense data simply isn’t available yet.
Screening Deals at Scale
If you’re running through 40 listings on a Sunday afternoon, calculating full cap rates on each one isn’t practical. GRM lets you triage fast. In most markets, residential investors use a rule of thumb: GRM under 10 is interesting, GRM over 15 is hard to make work. You can sort your spreadsheet by GRM and cut the bottom half in minutes. Only the survivors get full underwriting.
MLS-Stage Analysis
Most MLS listings show asking price and current rents. That’s exactly what you need for GRM — and that’s often all you have. Sellers rarely hand over verified expense statements before you’ve shown serious interest. GRM bridges the gap between “this looks interesting on paper” and “let’s schedule a showing.”
Comparing Markets
GRM is a clean way to compare how different cities price rental income. If Nashville shows a median GRM of 13 for small multifamily and Memphis shows a GRM of 9, that’s a meaningful signal about how much the market values cash flow relative to appreciation. It’s a starting point for market research, not a final answer.
Quick Portfolio Benchmarking
If you already own properties and want a fast gut check on whether a new acquisition is in the same ballpark as your existing assets, GRM works well. You probably already know the income your other properties generate — applying the same multiplier to a new deal gives you a rough sanity check before you go deeper.
Worked Example: Same Property, Both Metrics
Let’s run both metrics on a real-world scenario: a duplex in Cleveland, Ohio, listed at $285,000.
The Property
- Purchase price: $285,000
- Unit 1 rent: $1,100/month
- Unit 2 rent: $1,000/month
- Gross monthly rent: $2,100
- Gross annual rent: $25,200
Step 1: Calculate GRM
GRM = $285,000 ÷ $25,200 = 11.3
In Cleveland’s east side, GRMs for small multifamily typically run between 8 and 13. At 11.3, this property is in the middle of the pack — not a steal, but not obviously overpriced.
Step 2: Calculate Cap Rate
To get cap rate, we need NOI. Let’s build that out:
- Gross annual rent: $25,200
- Vacancy (8%): −$2,016
- Effective gross income: $23,184
- Property taxes (Cleveland, Cuyahoga County): −$3,400
- Insurance: −$1,200
- Property management (10%): −$2,318
- Maintenance/repairs: −$2,400
- CapEx reserve (roof, HVAC, appliances): −$1,800
- Utilities (landlord-paid water/trash): −$900
- NOI: $11,166
Cap Rate = $11,166 ÷ $285,000 × 100 = 3.9%
What Each Metric Reveals
The GRM told us this property is mid-market for Cleveland — roughly in line with comparable small multifamily deals. Nothing alarming. But the cap rate tells a different story: 3.9% is below average even for a stronger market. For a Midwest city with real vacancy risk and maintenance demands typical of older housing stock, that’s thin.
Why the disconnect? Expenses. Cleveland properties often carry higher-than-average tax burdens, and older homes demand more maintenance reserves than newer construction in sunbelt markets. A GRM comparison wouldn’t capture any of that. The cap rate did.
If Cleveland investors typically expect a 6–7% cap rate on small multifamily, then back-solving to find the price that achieves a 6.5% cap gives us: $11,166 ÷ 0.065 = $171,785. That’s the price at which this deal makes sense on a cap rate basis — well below the $285,000 asking price.
Either the seller needs to negotiate down significantly, or you need to believe rents will grow substantially after acquisition. Use the Rental Property Calculator to model out different rent growth scenarios before deciding.
This is the worked example in miniature of why both metrics belong in your toolkit. GRM screened it in. Cap rate nearly screens it out — or at minimum, it reframes the negotiation.
Common Mistakes When Comparing Cap Rate and GRM
Mistake 1: Using GRM to Make Final Buy Decisions
GRM is a screening tool. Some investors get comfortable with it and never graduate to full underwriting. That’s how you end up buying a property with a GRM of 9.5 only to discover that the city levied a special assessment, the boiler needs replacement, and the property manager charges 12% — not 8%. Those costs obliterate the apparent deal. Why it matters: GRM can make a mediocre or bad deal look acceptable if expenses run high. Always follow up with cap rate before signing a purchase agreement.
Mistake 2: Comparing Cap Rates Across Different Markets
A 7% cap rate in Detroit and a 7% cap rate in Denver don’t mean the same thing. Detroit offers higher yields partly because property values are lower and partly because vacancy and deferred maintenance risks are higher. Denver’s 7% (rare at current prices) would reflect a much stronger tenant base and appreciation outlook. Why it matters: Cap rate is a snapshot — it doesn’t encode risk, location quality, or long-term value trajectory. Comparing across markets without adjusting for those factors leads to bad allocation decisions.
Mistake 3: Plugging in Pro-Forma Rents Instead of Actual Rents
Sellers love to run cap rates and GRMs using “market rent” — what the property could earn if every unit were rented at optimistic current market rates, with no vacancy. That’s not what you’re buying. You’re buying the current rent roll. Why it matters: A seller quoting an 8% cap rate on pro-forma rents might be showing you a 5% cap rate on actuals. Per BiggerPockets, always run your own numbers using T-12 (trailing 12 months) actuals when available.
Mistake 4: Forgetting That Cap Rate Ignores Financing
A 6.5% cap rate property financed at 7.5% interest is cash-flow negative before you even factor in debt service coverage. Investors sometimes see a “good” cap rate and assume the deal will cash flow — but cap rate is calculated before debt service. Why it matters: You need to add a DSCR check to any cap rate analysis. The DSCR Calculator helps you see how your financing stacks against the property’s income. A deal with a strong cap rate can still fail to qualify for financing or generate negative cash flow post-debt.
Mistake 5: Using GRM Without Knowing Local Expense Ratios
GRM is only useful as a screening tool if you know what operating expense ratio is typical for your market. If you’re buying in a Chicago suburb where expenses run 45% of gross rent, a GRM of 11 might be acceptable. If you’re in a New Orleans neighborhood where expenses routinely hit 55–60% (older housing, higher insurance post-storm risk), that same GRM of 11 will leave you underwater. Why it matters: GRM benchmarks are market-specific. A “good” GRM in Phoenix isn’t the same number as a “good” GRM in Baltimore. Know your local expense norms before using GRM as a filter.
Which Metric Is Better for Your Strategy?
There’s no universal answer. The right metric depends on what you’re trying to do.
Buy-and-Hold Investors
Cap rate is your primary tool. You’re holding for years, which means operating costs, vacancy, and long-term NOI growth matter far more than gross rent. Run cap rate on every serious deal. Use GRM to narrow your list of properties worth underwriting. Pair cap rate with cash-on-cash return and the Cash Flow Calculator to build a full picture of returns.
Fix-and-Flip Investors
Flippers aren’t holding for income, so both metrics are limited. That said, GRM is more useful here — it gives you a quick read on the income potential if the exit buyer is a rental investor. If you’re selling a renovated triplex to a buy-and-hold buyer, they’ll price it on cap rate. Understanding that math helps you set your ARV and exit strategy correctly.
BRRRR Investors
The BRRRR strategy (Buy, Rehab, Rent, Refinance, Repeat) lives and dies on NOI, which means cap rate is central. After rehab, your refinance value is partly driven by what a lender — and ultimately the market — will assign as a cap rate for the stabilized property. Run cap rate on your target post-rehab NOI to back into your target refinance value. GRM is useful during acquisition screening to quickly compare distressed properties.
Syndication and Commercial Deals
Cap rate is the dominant metric in commercial multifamily syndication. Brokers, lenders, and appraisers all use it. GRM occasionally appears in deal memos as a secondary sanity check, but it rarely drives valuation or investor underwriting at this level. If you’re syndicating, you need to be fluent in cap rate, NOI, and how small changes in cap rate dramatically affect exit valuations. The full methodology is covered in the NOI guide and the rental property analysis guide.
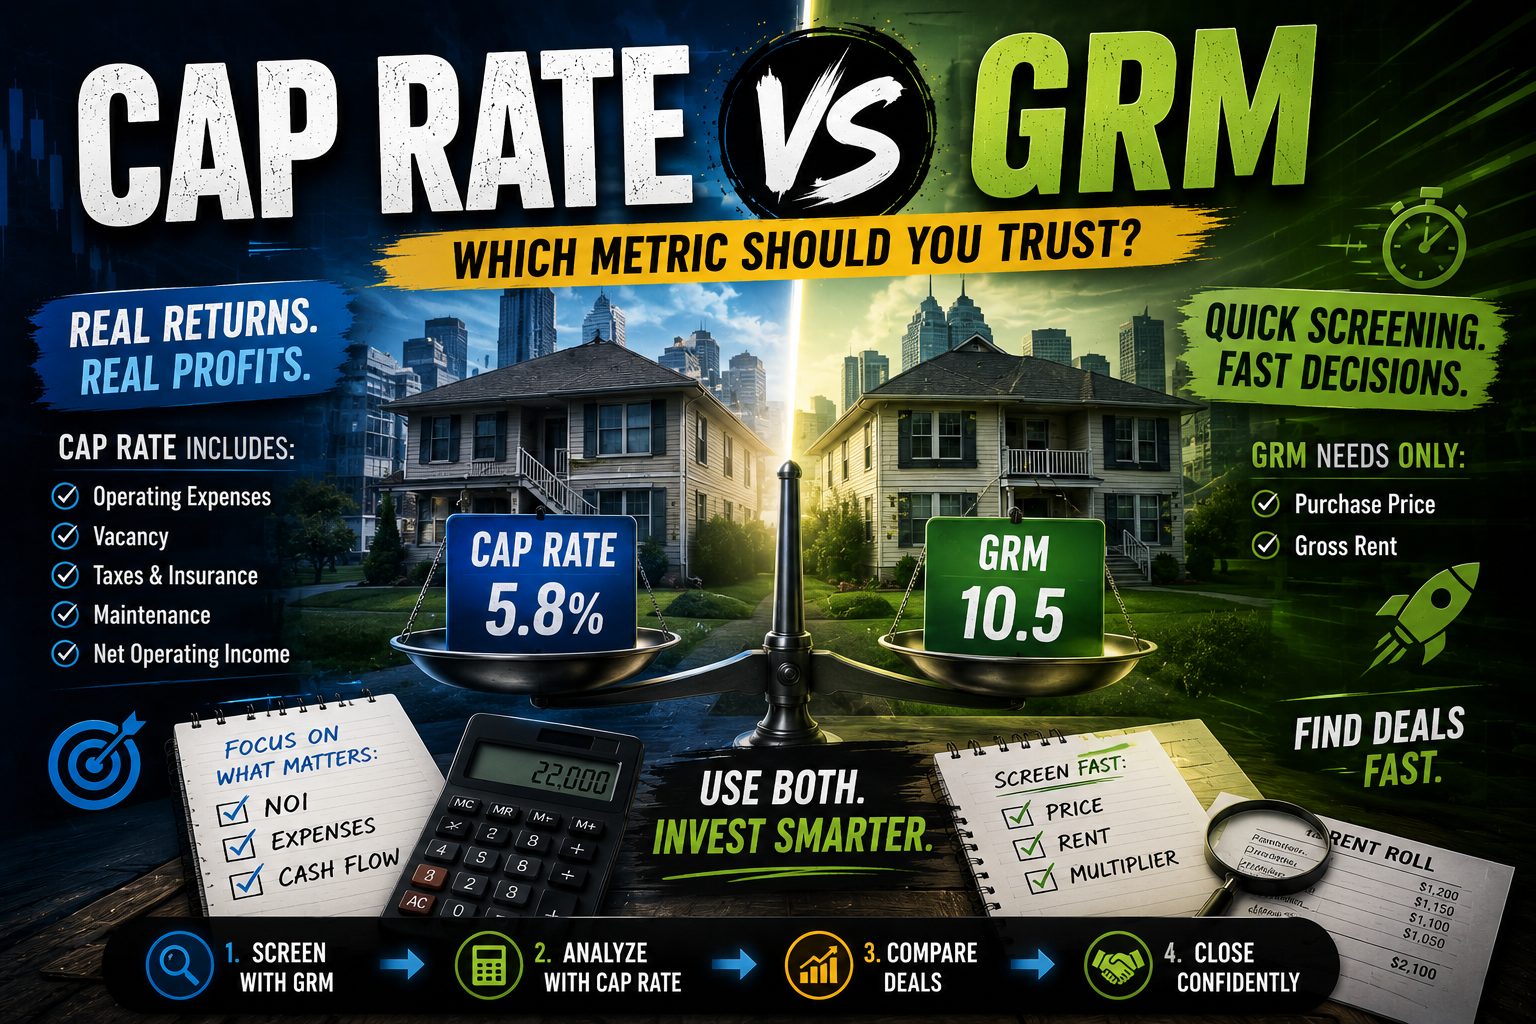
Bottom line: use GRM to screen, use cap rate to decide. They’re not competitors. They’re stages in the same workflow.
FAQ
For cap rate, “good” depends on your market. In high-cost coastal markets like Los Angeles or New York, 4–5% cap rates are common. In Midwest and Southeast markets, 6–9% is more typical for small residential multifamily. For GRM, most residential investors look for a multiplier below 10–12 in cash-flow markets, though that number climbs in appreciation-driven cities. Neither benchmark is universal — always compare against local comps, not national averages.
Yes, with one additional input: the operating expense ratio. The formula is Cap Rate = (1 − Expense Ratio) ÷ GRM. If your GRM is 10 and your expense ratio (including vacancy) is 40%, then Cap Rate = (1 − 0.40) ÷ 10 = 6.0%. This conversion only works if you have a reliable estimate of operating expenses as a percentage of gross income, which varies by market, property type, and age.
Neither one does. Both cap rate and GRM are calculated before debt service. This is intentional — it makes them financing-neutral so you can compare properties regardless of how they’re funded. To account for your mortgage, you need cash-on-cash return (which measures return on equity invested after debt service) or DSCR (which measures how well the property’s income covers the loan payment).
Commercial lenders almost universally use cap rate, along with DSCR, to underwrite income-producing properties. GRM rarely appears in formal loan applications. For residential loans on 1–4 unit properties, lenders often focus on appraised value and debt-to-income ratios rather than cap rate, but cap rate still matters for appraiser income approach valuations on two-to-four-unit properties. According to NOLO, NOI and cap rate are central to commercial underwriting standards.
Generally yes, but not always. A very low GRM (say, 5 or 6) in a market where 10 is normal could mean underpriced opportunity — or it could signal serious deferred maintenance, problem tenants, or a location that can’t attract quality renters. Always ask why a GRM is unusually low. The answer is often a risk that doesn’t show up in the gross rent number but will absolutely show up in your operating expenses and vacancy rate.
Both metrics can be used to estimate property value — that’s actually one of their most effective applications. For cap rate: Value = NOI ÷ Cap Rate. For GRM: Value = Annual Gross Rent × GRM. In commercial real estate, the income approach using cap rate is one of three standard appraisal methods (alongside the sales comparison and cost approaches). GRM-based valuation is common in quick broker analyses and for smaller residential income properties.
For single-family rentals, GRM is more commonly used during screening because expense data is hard to get from listing information alone. But for your final underwriting, cap rate gives you a much cleaner picture of whether the property actually makes money. Single-family rentals often have higher expense ratios than multifamily because there’s no unit-count diversification — one vacancy is 100% vacancy. That makes cap rate especially important: you need to see that the income can absorb those periods. The rental property analysis guide covers both metrics in the context of single-family and small multifamily deals.
Leave a Reply