Last updated: September 21, 2026 · Originally published: July 1, 2026 · By Alex Petrov
Short-term rental investing runs on different math than buying a buy-and-hold long-term rental. A Nashville vacation cabin might pull $72,000 in gross Airbnb revenue on a property that a standard tenant would rent for $2,200 a month — but that doesn’t mean the cabin is automatically the better investment. Airbnb cap rate calculations have to account for cleaning fees, platform commissions, seasonal vacancy, furnishing depreciation, and regulation risk that traditional rental analysis never touches. Run the numbers wrong and you’ll overpay, underestimate expenses, and wonder why the cash flow you projected never showed up. This guide walks you through exactly how to calculate it the right way, what numbers to expect in popular STR markets, and the mistakes that quietly destroy returns.
What Is Airbnb Cap Rate?
Cap rate — capitalization rate — is the ratio of a property’s net operating income to its current market value or purchase price. The formula is:
Cap Rate = Net Operating Income (NOI) ÷ Property Value × 100
For a traditional rental, NOI is straightforward: annual gross rent minus vacancy, property taxes, insurance, maintenance, and management fees. You can run those numbers in under five minutes using a standard Cap Rate Calculator.
For an Airbnb property, the income side is more complicated. Gross revenue depends on occupancy rate, nightly rate, and seasonal demand — all of which fluctuate. The expense side adds cleaning fees (which scale with every turnover), platform fees (Airbnb charges hosts 3% on most listings, but dynamic host-only fees can reach 14-16%), furnishings, utilities you pay because you own them rather than the tenant, and property management that typically runs 20-25% of revenue for short-term rentals versus 8-10% for long-term ones.
The core formula doesn’t change. But every input requires a different set of assumptions. That’s why the same property can show wildly different cap rates depending on who’s running the analysis — and whether they actually know what they’re doing.
For a deeper look at how NOI works before cap rate, use the NOI Calculator to map out your income and expense assumptions first.
Airbnb Cap Rate vs. Traditional Rental Cap Rate
Short-term rental cap rates often look better on paper. The reason is simple: STRs can charge a premium per night that outpaces monthly long-term rents. But that premium comes attached to risks that don’t exist — or exist at a much lower level — for standard rentals.
| Factor | Long-Term Rental | Airbnb / STR |
|---|---|---|
| Gross Income Potential | Lower, more predictable | Higher, highly variable |
| Vacancy Rate | 5–10% typical | 25–45% typical (market-dependent) |
| Property Management Fee | 8–10% of rent | 20–25% of revenue |
| Cleaning / Turnover Costs | Once per tenant change | Every booking (can be 50–100+ times/year) |
| Utilities | Usually tenant-paid | Always owner-paid |
| Furnishing Required | No | Yes ($10K–$50K+ upfront) |
| Regulation Risk | Low | High — can change overnight |
| Cap Rate Range (typical US market) | 4–7% | 6–12% (before regulation adjustment) |
| Income Stability | High | Low |
The headline cap rate for a Scottsdale vacation rental might look like 9–10%. A comparable long-term rental in the same zip code might show 5%. But the STR number assumes consistent occupancy, no regulatory ban, and no off-season rate compression. When Scottsdale passed stricter STR permit requirements in 2022, several investor properties went from $58,000/year gross to $0 in STR income overnight while the owners scrambled to convert to long-term leases.
Higher cap rate equals higher risk here. That’s not always a bad trade — but you need to price the risk in, not just the upside.
See how this plays out across different states in the cap rate by state guide and understand the full spectrum of what “good” looks like in the cap rate guide.
How to Calculate Airbnb Cap Rate Step by Step
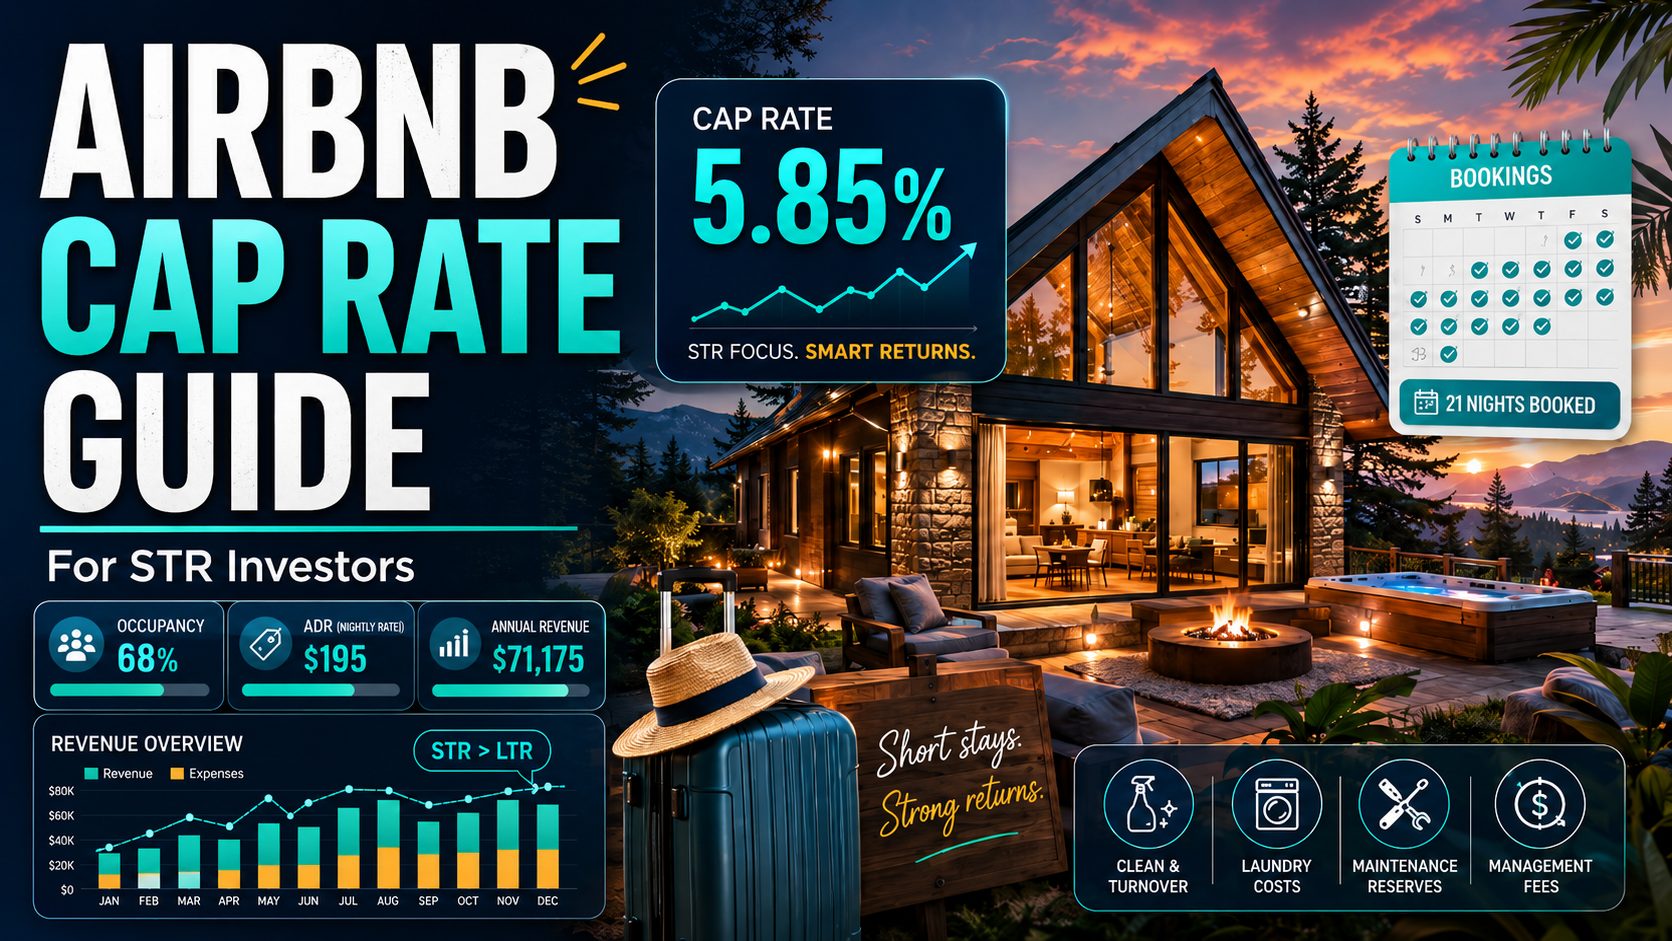
Let’s work through a real scenario. You’re looking at a 3-bedroom cabin near Nashville, Tennessee — East Nashville, specifically — listed at $325,000. Similar properties on AirDNA are showing average daily rates around $195 and occupancy rates of about 68% annually. Here’s how to build the full cap rate analysis.
Step 1: Calculate Gross STR Revenue
- Average nightly rate: $195
- 365 days × 68% occupancy = 248 booked nights
- Gross STR revenue: $195 × 248 = $48,360
Step 2: Subtract Platform Fees
Airbnb’s host-only fee structure charges roughly 3% on most standard listings, but if you’re using a property manager who handles the platform, they typically work under the split-fee model. For this example, assume a 3% host fee.
- Airbnb platform fee: $48,360 × 3% = $1,451
- Net revenue after platform fee: $46,909
Step 3: Account for Cleaning Fees
Cleaning fees paid by guests often cover the cleaning cost — but not always. With 248 bookings spread over the year, assume an average stay of 3.2 nights (typical for Nashville urban), meaning roughly 78 turnovers. Professional cleaning at $85 per turn:
- Cleaning cost: 78 × $85 = $6,630
- Cleaning fees collected from guests: 78 × $75 = $5,850
- Net cleaning shortfall: $780
If cleaning fees collected cover the cost or more, add the surplus to income. If they fall short, subtract the gap from revenue. Here we have a small shortfall.
Step 4: Property Management
A Nashville STR property manager handling bookings, guest communication, turnovers, and maintenance coordination charges 22% of gross revenue.
- Property management: $48,360 × 22% = $10,639
Step 5: Utilities
Unlike long-term rentals where the tenant pays utilities, you’re covering everything. For a 3BR Nashville property:
- Electric + gas: $2,400/year
- Water + sewer: $960/year
- Internet (required): $720/year
- Total utilities: $4,080
Step 6: Property Taxes and Insurance
Nashville (Davidson County) effective property tax rate is around 0.68%. STR insurance is more expensive than standard landlord policies because of guest liability exposure.
- Property taxes: $325,000 × 0.68% = $2,210
- STR insurance (Proper Insurance or equivalent): $2,800/year
- Total: $5,010
For a deeper look at how insurance works in STR contexts, the rental property insurance guide covers what standard policies miss.
Step 7: Maintenance and Repairs
STRs take more wear than long-term rentals. Budget 1.5% of property value annually.
- Maintenance: $325,000 × 1.5% = $4,875
Step 8: Furnishing Depreciation
You spent $18,000 furnishing this Nashville cabin. Furniture, linens, kitchenware, smart locks, décor — all of it depreciates. IRS allows accelerated depreciation on furnishings, but from a cap rate perspective, you want to account for the cost of replacing items over time. Budget $2,500/year for furnishing replacement and restocking.
- Furnishing depreciation reserve: $2,500
Step 9: Calculate NOI
| Line Item | Amount |
|---|---|
| Gross STR Revenue | $48,360 |
| Platform Fee (3%) | −$1,451 |
| Cleaning Shortfall | −$780 |
| Property Management (22%) | −$10,639 |
| Utilities | −$4,080 |
| Property Taxes + Insurance | −$5,010 |
| Maintenance | −$4,875 |
| Furnishing Reserve | −$2,500 |
| NOI | $19,025 |
Step 10: Calculate Cap Rate
Cap Rate = $19,025 ÷ $325,000 × 100 = 5.85%
That’s a solid cap rate for Nashville, though not spectacular. The property generates a real return, but notice how expenses consumed nearly 61% of gross revenue. That’s normal for well-run STRs — and it’s exactly why investors who only look at gross income overestimate their returns.
Run your own numbers in the Cap Rate Calculator or the full Rental Property Calculator to model different purchase prices and occupancy scenarios side by side.
What Is a Good Airbnb Cap Rate?
There’s no universal answer — and that’s more true for STRs than for any other asset class. A 6% cap rate in Gulf Shores, Alabama (where the STR market is mature, legal, and stable) is solid. A 6% cap rate in a city actively banning new STR permits is a disaster waiting to happen.
Here’s a rough framework by market:
- Nashville, TN: 5–8% is realistic for well-located properties. The market is saturated in some pockets, and Nashville’s STR registration requirements add compliance friction. Properties near Broadway or Germantown can still push 8–9% in good years.
- Austin, TX: 4–6% in most zip codes. High property values drag cap rates down. Central Austin STRs near 6th Street perform better, but $500K+ price points make 5% a good outcome.
- Scottsdale, AZ: 6–9% in prime vacation zones if permits are clean. Regulation risk is Improved — price that in.
- Gulf Shores / Orange Beach, AL: 8–12% is achievable. Strong beach demand, relatively investor-friendly regulations, lower property prices than comparable Florida markets.
- Joshua Tree, CA: 7–11% on the right properties. Desert aesthetic, short drives from LA, and a strong weekend traveler base. But regulations in San Bernardino County have tightened significantly since 2022.
- Smoky Mountains (Sevier County, TN): 8–14% on cabin properties. This is one of the strongest STR markets in the US by cap rate. High demand, relatively permissive local regulations, and a steady flow of domestic tourism.
Generally, a 7–10% cap rate is considered strong for STR properties. Below 5% and you need to ask whether long-term rental conversion or a different market makes more sense. Above 12% and you should be asking why — usually there’s a regulation risk, a market saturation problem, or expense assumptions that are too optimistic.
For context on how these STR cap rates compare to the broader residential market, read through the rental property analysis guide.
5 Factors That Crush Your Airbnb Cap Rate
1. Seasonality
STRs don’t produce even income across 12 months. A beach property in Destin, Florida might generate $8,000 in July and $900 in January. When you underestimate the depth of your slow season, your annual occupancy projection collapses. An investor who projects 75% occupancy based on peak-summer data and then actually gets 52% annual occupancy has just destroyed their cap rate model. Always pull 12 months of AirDNA data — not just summer.
2. Regulation Risk
This is the biggest asymmetric risk in STR investing. New York City banned nearly all Airbnb rentals in September 2023 under Local Law 18. Investors who owned short-term rental properties there saw their income go to zero overnight. Santa Monica, CA had similar bans years earlier. Boston, Chicago, and San Francisco have all implemented permit caps or outright bans in certain zones. You can’t cap-rate-model a property that gets banned. This is why regulation due diligence — checking zoning maps, active city council proposals, and permit caps before you close — is non-negotiable.
3. Higher Turnover Costs
In a long-term rental, you clean and repaint between tenants — maybe once every two years. In an STR, you’re cleaning after every single guest. A 70% occupied property with an average 3-night stay has roughly 85 cleanings per year. At $100 per clean (realistic in 2024 for a 3BR), that’s $8,500 just in cleaning costs annually. Add supply restocking, linen replacement, and the small repairs guests cause, and turnover can easily run $12,000–$15,000 per year on a single property. Investors coming from long-term rentals consistently underestimate this line item.
4. Furnishing Depreciation
Guests are harder on furniture than long-term tenants. Couches get stained. Mattresses wear faster. TVs get broken. Smart locks malfunction. The Instagram-worthy décor that drives your listing’s star rating needs replacing every 3–5 years. A $20,000 initial furnishing investment on a 5-year replacement schedule is a $4,000/year expense that many investors treat as a one-time sunk cost. It isn’t. Every time you skip the furnishing reserve, you’re borrowing against future NOI.
5. Platform Fee Increases
Airbnb raised host fees twice between 2019 and 2023. VRBO restructured its fee model in 2023 in ways that increased costs for some hosts. When you model cap rate, you’re assuming today’s platform relationship holds. It might not. A shift from 3% to 6% host fees on $50,000 in annual revenue is $1,500 straight out of your NOI — roughly 0.5% off your cap rate on a $325,000 property. It doesn’t sound like much until you factor in that it’s a unilateral decision by a company you have no contract with.
Airbnb Cap Rate by Market
Data sourced from AirDNA market reports and investor community analysis. Figures represent typical 3-bedroom properties performing at market average.
| Market | Typical Cap Rate | Avg Nightly Rate | Avg Occupancy | Notes |
|---|---|---|---|---|
| Smoky Mountains, TN | 9–14% | $220–$350 | 72–80% | Best-in-class STR market, strong year-round |
| Gulf Shores / Orange Beach, AL | 8–12% | $250–$400 | 60–70% | Beach demand, affordable prices vs. FL |
| Scottsdale, AZ | 6–9% | $200–$450 | 65–75% | Permit requirements tightening |
| Joshua Tree, CA | 7–11% | $250–$500 | 62–72% | High demand, regulation pressure increasing |
| Nashville, TN | 5–8% | $175–$250 | 65–72% | Urban rules restrict non-owner occupied STRs |
| Austin, TX | 4–6% | $180–$280 | 60–68% | High acquisition prices compress returns |
| 30A / Destin, FL | 7–10% | $280–$500 | 65–75% | Strong demand, but property prices have surged |
| Blue Ridge, GA | 8–12% | $200–$350 | 68–78% | Mountain market, less saturated than Smoky Mtns |
| Sedona, AZ | 5–8% | $250–$450 | 60–70% | High prices, strict permit caps |
| Branson, MO | 8–11% | $140–$220 | 62–72% | Underrated market, favorable regulations |
Want to run a full income and vacancy analysis before committing to a market? The vacancy rate guide and Airbnb income guide give you the frameworks to stress-test any of these markets.
Common Mistakes When Calculating Airbnb Cap Rate
Mistake 1: Using Gross Revenue Instead of NOI
The most common error by far. An investor sees a listing pulling $75,000 on AirDNA, divides by the $500,000 purchase price, and calls it a 15% cap rate. That’s a gross revenue yield — not a cap rate. Cap rate uses NOI, which is gross revenue minus all operating expenses. On that $75,000 property, real NOI after all STR expenses might be $28,000, giving a real cap rate of 5.6%. The difference between 15% and 5.6% is not a rounding error. It’s the difference between a good deal and a painful lesson.
Mistake 2: Using Peak-Season Data to Project Annual Performance
AirDNA, Rabbu, and Mashvisor all show revenue data — but investors often filter for summer months or cherry-pick a high-demand weekend market. A Destin, Florida property might generate $15,000 in June. But January through March might bring in $2,800 combined. Project your cap rate using trailing 12-month data, not a 90-day summer snapshot.
Mistake 3: Ignoring Furnishing Costs in the Initial Purchase Analysis
Cap rate calculations almost always use the property purchase price as the denominator. But if you spend $25,000 on furnishings to make the property rentable, your real all-in cost is $350,000 on that $325,000 cabin. Using the lower number inflates your cap rate. Use total cash deployed — purchase price plus closing costs plus furnishing investment — as your denominator to get an honest return metric. This also matters for financing analysis; run it through the DSCR Calculator to see how debt service interacts with your real NOI.
Mistake 4: Not Modeling the Long-Term Rental Alternative
Before you commit to an STR strategy, model what the same property returns as a long-term rental. If a long-term rental cap rate comes in at 5.2% and the STR scenario (properly modeled) shows 6.8%, the question becomes: is 1.6% of additional return worth the additional management intensity, furnishing costs, regulation risk, and income volatility? Sometimes yes. Sometimes a long-term rental is the smarter play. Use the Cash Flow Calculator to run both scenarios before you decide.
For more context on comparing investment metrics, the cap rate vs GRM guide shows when different metrics tell different stories about the same property.
FAQ
A cap rate of 7–10% is generally considered strong for a short-term rental property in the US. However, “good” depends heavily on the market, regulation environment, and how you plan to operate the property. In a low-risk, high-demand market like the Smoky Mountains, 9–12% is realistic. In a high-price, high-regulation market like Austin or New York City, anything above 5% is doing well. Always compare the STR cap rate against what the property would yield as a long-term rental before deciding which strategy makes more sense.
The formula is the same — NOI divided by property value — but the inputs are very different. STR cap rate calculations must account for platform fees (3–16%), higher property management costs (20–25% vs. 8–10% for long-term rentals), utilities paid by the owner, furnishing costs and depreciation, higher cleaning and turnover expenses, and seasonal vacancy that can run 25–45% annually. Traditional cap rate analysis uses simpler, more stable expense assumptions. STR cap rates tend to look higher than long-term rental cap rates, but they carry significantly more risk and require more intensive management.
Yes — for cap rate purposes, net Airbnb revenue (gross STR income minus platform fees and cleaning costs passed through to the owner) is treated as rental income. What you subtract from that income to get NOI is where STRs differ from long-term rentals. You’ll include expenses that traditional rental analysis ignores, like utilities, furnishing reserves, and much higher management fees. For mortgage qualification purposes, lenders treat STR income differently than long-term rental income — some lenders will only count 75% of documented STR income, and DSCR loans have specific rules around STR projections.
Use trailing 12-month actual data from AirDNA, Rabbu, or Mashvisor for comparable properties in the same submarket — not your best-case projections. Most US STR markets average 55–75% occupancy annually. Beach markets can hit 70–80% in prime locations, while mountain or urban markets often run 60–70%. Never model 90%+ occupancy unless you have years of verified data on the specific property. A conservative first-year projection should assume 5–10% below market average to account for new listing ramp-up time.
Yes, in two ways. First, the upfront furnishing investment should be added to the property purchase price when you calculate the denominator (total invested capital). A $325,000 property with $20,000 in furnishings has a $345,000 cost basis for cap rate purposes. Second, ongoing furnishing replacement and restocking — typically $1,500–$4,000 per year for a 3-bedroom property — should be included as an operating expense in your NOI calculation. Skipping both of these inflates your cap rate and gives you a falsely optimistic picture of actual returns.
Regulation risk doesn’t show up in a cap rate formula directly — but it should affect how you interpret the number. A 10% Airbnb cap rate in a city with active permit caps or pending STR restrictions is worth less than a 7% cap rate in a stable, investor-friendly market. When evaluating short-term rental returns, always check the current permit environment: does the city require STR permits, are permits capped, are there pending city council proposals to restrict STRs, and what happens to your income if you’re forced to convert to a long-term rental? Factor in the worst-case scenario — usually the long-term rental cap rate — and decide if the spread is worth the risk.
It depends on what you’re comparing it to and what the risk profile looks like. In a high-cost market like Austin, TX or parts of coastal California, a 5% STR yield might be the realistic ceiling given property prices — and if long-term rental alternatives in the same market yield 4%, the STR premium still makes sense. But in markets where STR regulations are unstable, a 5% cap rate provides almost no cushion if income drops or you’re forced into a long-term lease at lower rates. Generally, most STR investors look for at least 7% to justify the management complexity over a passive long-term rental setup.
Short-term rental investing can absolutely outperform traditional rentals — but only when you run the numbers honestly. The investors who struggle aren’t necessarily buying in the wrong markets or paying too much. They’re calculating returns with optimistic income assumptions and incomplete expense lists, then wondering why actual performance never matches the projection.
Build your analysis around real occupancy data from AirDNA, full expense modeling including utilities and furnishing reserves, and a clear-eyed look at the regulatory environment in your target market. According to Investopedia’s cap rate framework, cap rate is most useful when compared against market benchmarks — and that holds doubly true for STRs, where “the market” varies enormously by city, neighborhood, and even permit zone. Communities like BiggerPockets have extensive STR investor discussions that surface the real-world numbers investors are actually seeing — not just what the platforms advertise.
Use the Cap Rate Calculator to stress-test your assumptions, model your financing with the DSCR Calculator, and run a full picture in the Cash Flow Calculator before you put a property under contract. The math doesn’t lie — but only if you put the right numbers in.
Leave a Reply