Last updated: September 24, 2026 · Originally published: July 9, 2026 · By Alex Petrov
A duplex in Columbus, Ohio lists at $450,000. You pull the actual rent rolls, run the income approach, and the math spits out $380,000. That’s $70,000 you almost handed to a seller who priced on hope rather than income. Knowing how to calculate property value based on rental income is the single skill that separates investors who build wealth from those who wonder why their deals never cash flow.
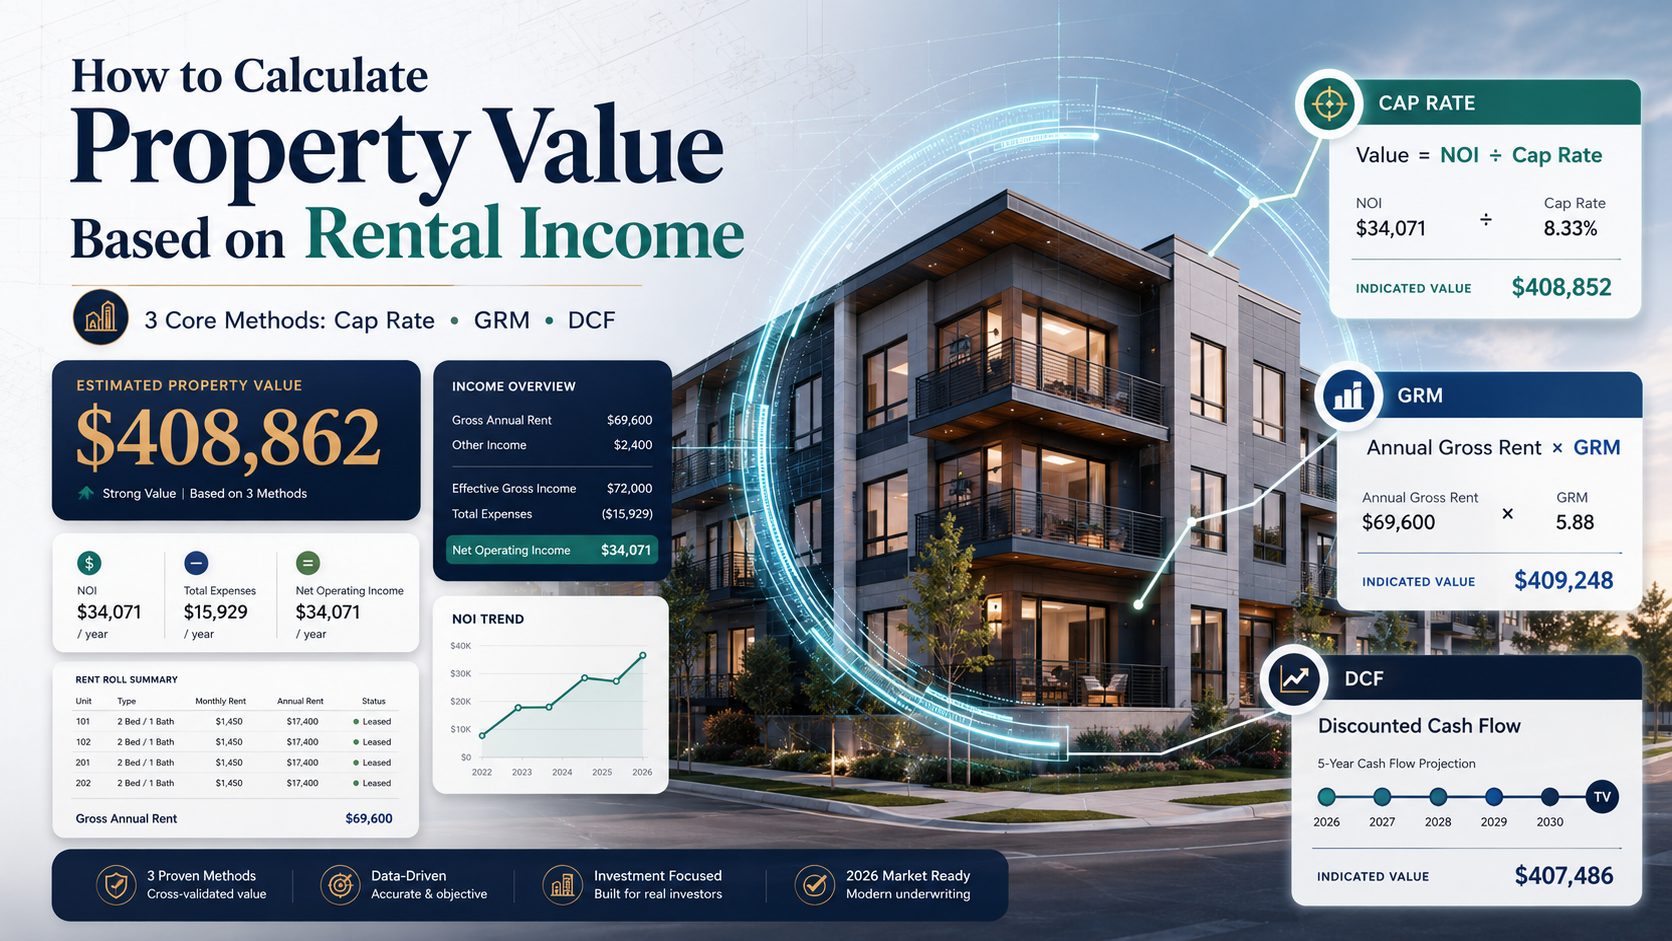
Quick Summary: 3 Methods to Calculate Property Value Based on Rental Income
- Cap Rate Method — Value = Net Operating Income ÷ Cap Rate
- Gross Rent Multiplier (GRM) Method — Value = Annual Gross Rent × GRM
- Discounted Cash Flow (DCF) Method — Value = PV of all future cash flows + PV of sale proceeds
Each method answers a slightly different question. Used together, they give you a defensible number before you write any offer.
Why You Need to Calculate Property Value Based on Rental Income
The sales comparison approach works fine when you’re buying a three-bedroom ranch in a subdivision full of identical three-bedroom ranches. Pull six comps, adjust for square footage, done. The problem surfaces the moment you step into multifamily, mixed-use, or commercial territory — where no two buildings have the same rent rolls, tenant mix, lease structures, or expense histories.
A 12-unit apartment building in Kansas City doesn’t have six identical twins that sold last quarter. A strip mall in suburban Phoenix has a Subway on month-to-month and an insurance agency on a five-year NNN lease — no comp captures that reality. This is exactly why licensed appraisers default to the income approach for income-producing properties, and why the Appraisal Institute treats it as the primary method for commercial and multifamily assets.
Investors who rely solely on what a seller paid in 2022, or what the neighbor’s fourplex sold for eight months ago, are flying blind. Rents change. Expenses inflate. The building that penciled at a 5% cap in a low-rate environment may need to be priced at a 7% cap today. The only way to know what you’re actually buying is to calculate property value based on rental income using current numbers.
There’s also a lender angle. Commercial lenders underwrite based on debt service coverage ratios tied to NOI. If you understand how they’re valuing the property, you can anticipate appraisal shortfalls before they blow up your closing.
Method 1: Cap Rate Method
The capitalization rate method is the workhorse of income property valuation. It converts a single year’s net operating income into a value estimate by applying the market’s required rate of return.
Formula:
Step-by-Step Walkthrough
- Calculate Gross Scheduled Income (GSI). Add up all rents at 100% occupancy. Include parking, laundry, storage — every dollar the property can collect.
- Subtract vacancy and credit loss. Use market vacancy, not the seller’s rosy estimate. Most markets run 5–10% for multifamily. Apply it.
- Add other income. Late fees, pet fees, vending machines, cell tower leases — these are real money.
- Calculate Effective Gross Income (EGI). EGI = GSI − Vacancy + Other Income.
- Subtract all operating expenses. Property taxes, insurance, property management (8–10% of collected rent), maintenance, utilities the landlord pays, landscaping, administrative costs. Do NOT include mortgage payments — cap rate math is debt-free by design.
- Arrive at NOI. NOI = EGI − Operating Expenses.
- Divide by the market cap rate. Get the cap rate from recent comparable sales in your market (more on this below).
Example: A six-unit building produces $28,000 in annual NOI. Comparable sales in that submarket show investors accepting 7% cap rates.
Value = $28,000 ÷ 0.07 = $400,000
If the seller is asking $460,000, they’re pricing at a 6.1% cap — roughly in line with what the market offered two years ago when rates were 200 basis points lower. That gap matters. Use the cap rate calculator to run these numbers instantly without doing the division by hand.
For a deeper to what makes a cap rate “good” for a given asset class and market, read What Is a Good Cap Rate? — it breaks down acceptable ranges by property type and geography.
When to use this method: Stabilized properties with consistent rent rolls and at least 12 months of operating history. Avoid it for value-add plays where current NOI is artificially depressed by vacancy or below-market rents — you’ll undervalue the opportunity.
Method 2: Gross Rent Multiplier (GRM) Method
The GRM method is faster and less precise than the cap rate method. It’s best used as a first-pass filter to screen deals before you invest time in a full underwrite.
Formula:
The GRM is simply the ratio of sale price to annual gross rent, derived from comparable sales. If five similar buildings in Portland sold for an average of 11 times their annual gross rent, the market GRM is 11.
Example: A fourplex collects $2,000/month per unit × 4 units = $8,000/month = $96,000/year in gross rent. The market GRM for similar fourplexes in that zip code is 11.
Value = $96,000 × 11 = $1,056,000
Smaller example for clarity: a duplex collecting $24,000/year in gross rent in a market where GRM runs 11:
Value = $24,000 × 11 = $264,000
GRM ignores expenses entirely, which is its biggest weakness. Two identical buildings with the same gross rent can have wildly different NOIs if one owner pays utilities and the other doesn’t. That said, for a quick gut check on whether a deal deserves deeper analysis, GRM gets you there in 30 seconds.
See the full breakdown of when each method makes sense in Cap Rate vs. GRM: Which Should You Use? and our detailed Gross Rent Multiplier Guide.
When to use this method: Residential rentals (1–4 units), preliminary screening, markets with lots of comparable sales data, and any situation where you need a quick sanity check on asking price.
Method 3: Discounted Cash Flow (DCF) Method
The DCF model is how institutional buyers, private equity firms, and sophisticated individual investors calculate property value based on rental income over a multi-year hold. Instead of relying on a single year’s snapshot, it projects every year’s cash flow plus the eventual sale price, then discounts everything back to today’s dollars using a required rate of return (the discount rate).
Why this matters: A value-add property with a terrible Year 1 NOI might have a phenomenal Year 3 NOI after renovations and lease-up. The cap rate method would dismiss it. DCF captures the full picture.
Basic DCF Structure (10-Year Hold)
| Year | NOI | Discount Factor (9%) | PV of NOI |
|---|---|---|---|
| 1 | $30,000 | 0.917 | $27,523 |
| 2 | $31,500 | 0.842 | $26,511 |
| 3 | $33,075 | 0.772 | $25,534 |
| 4 | $34,729 | 0.708 | $24,588 |
| 5 | $36,465 | 0.650 | $23,698 |
| 6–10 | (growing at 3%/yr) | — | ~$98,000 |
| Exit Sale (Yr 10) | $49,127 NOI → $614K at 8% cap | 0.422 | $259,108 |
| Total DCF Value | ≈ $484,962 | ||
The discount rate you choose (9% in the table above) represents your required return — what you’d demand given the risk of this investment versus alternatives. Higher risk or lower liquidity means a higher discount rate, which compresses your value estimate.
DCF is most valuable for value-add acquisitions, long-term NNN leases with rent bumps built in, and any deal where Year 1 income doesn’t reflect stabilized potential. The property cash flow calculator can help you model multi-year projections before building a full DCF spreadsheet.
For a good primer on DCF methodology applied to real estate, Investopedia’s income approach article covers the conceptual framework clearly.
When to use this method: Value-add plays, commercial properties with structured leases, any hold period longer than three years where rent growth assumptions materially affect value.
Worked Example: Valuing a 4-Unit Apartment Building
Let’s put it all together and calculate property value based on rental income for a real deal. This is a fourplex in Indianapolis — a market where multifamily remains active and cap rates have settled in the 6–7% range for B-class assets.
The Property
- 4 units, each renting at $1,100/month
- Asking price: $450,000
- Built 1987, updated kitchens, two units have new HVAC
Step 1: Gross Scheduled Income
4 units × $1,100/mo × 12 months = $52,800/year
Step 2: Vacancy Allowance
Indianapolis Class B multifamily vacancy runs around 7–8%. Use 8% to be conservative.
$52,800 × 8% = $4,224 vacancy loss
Step 3: Effective Gross Income
$52,800 − $4,224 = $48,576
Step 4: Operating Expenses
| Expense | Annual Amount |
|---|---|
| Property taxes | $6,200 |
| Insurance | $2,800 |
| Property management (9%) | $4,372 |
| Maintenance & repairs | $4,000 |
| CapEx reserve ($75/unit/mo) | $3,600 |
| Water/sewer (landlord pays) | $1,028 |
| Total Operating Expenses | $22,000 |
Step 5: Net Operating Income
$48,576 − $22,000 = $26,576 NOI
Use the NOI calculator to verify this figure — it walks you through every line item and flags anything you might have missed.
Step 6: Apply Market Cap Rate
B-class fourplexes in Indianapolis are trading at 6.5% cap rates based on recent closed sales.
Value = $26,576 ÷ 0.065 = $408,862
Verdict
The income approach says this property is worth $408,862. The seller is asking $450,000. That’s a $41,138 gap — nearly 10% overpriced relative to what the income can support at market cap rates.
Armed with this analysis, you negotiate from a position of fact, not feeling. You either get the seller down to $410K, or you walk and find a deal where the numbers actually work. That’s how income-based valuation protects your capital.
Run a full rental property analysis on your next deal using the rental property calculator — it handles vacancy, expenses, NOI, and returns in one place.
Run Your Own Income-Based Valuation
Plug your rent rolls, vacancy, and expenses into our calculators. Get a defensible value estimate in under 3 minutes.
How to Find the Right Cap Rate for Your Market
When you calculate property value based on rental income, the result is only as accurate as your cap rate. Use the wrong number and the math lies to you with total confidence. Here’s how to source reliable market cap rates.
- Local commercial brokers. A broker who closed 10 multifamily deals in your target zip code last quarter knows the current cap rate range cold. Buy them coffee. Ask what’s trading and at what rate.
- Recent closed sales. Find a comparable property that sold in the past 6 months. Get the sale price and NOI (sometimes disclosed in marketing packages). Divide NOI by sale price. That’s the realized cap rate.
- LoopNet and CoStar. LoopNet lists cap rates on many active commercial listings. CoStar (subscription required) provides closed transaction data that’s more reliable for real underwriting.
- Market reports. CBRE, Marcus & Millichap, and Colliers publish quarterly cap rate surveys by market and property type. Free downloads, no subscription needed.
- Our state-by-state data. The cap rate by state guide compiles current multifamily benchmarks across the US — useful for quick orientation before you go deeper locally.
Typical Multifamily Cap Rates by Market (2026)
| Market | Asset Class | Cap Rate Range |
|---|---|---|
| New York City, NY | Multifamily (B/C) | 4.0% – 5.5% |
| Los Angeles, CA | Multifamily (B) | 4.5% – 5.8% |
| Chicago, IL | Multifamily (B) | 5.5% – 6.8% |
| Dallas-Fort Worth, TX | Multifamily (A/B) | 5.5% – 6.5% |
| Indianapolis, IN | Multifamily (B) | 6.0% – 7.5% |
| Kansas City, MO | Multifamily (B/C) | 6.5% – 8.0% |
| Phoenix, AZ | Multifamily (A) | 5.0% – 6.0% |
| Memphis, TN | Multifamily (C) | 7.0% – 9.0% |
These ranges shift with interest rates, local supply, and rent growth expectations. Treat them as orientation, not gospel. Local data from recent closed comps always wins.
Common Mistakes When You Calculate Property Value Based on Rental Income
The math is straightforward. The mistakes happen in the inputs. Here are the four that cost investors the most money.
Mistake 1: Using Pro-Forma Income Instead of Actual Rents
Sellers present pro-forma numbers — what the property could earn with every unit rented at top market rate. They’re not lying. They just want you to buy on potential. Your job is to calculate property value based on rental income that actually exists today, not in some best-case future state. Pull the actual rent roll. Get copies of current leases. Verify deposits. If you can’t, budget for significant below-pro-forma reality after closing.
Mistake 2: Applying the Wrong Cap Rate
Using a national average cap rate on a neighborhood-specific deal is like navigating with a map of the wrong city. A 6.5% cap rate might be right for B-class multifamily in Indianapolis but completely wrong for C-class single-tenant retail in Memphis. Worse, some investors apply the cap rate from two years ago when money was cheap. Markets have repriced. Your cap rate needs to reflect what buyers are actually paying today, not what they were paying when rates were near zero.
Mistake 3: Ignoring Deferred Maintenance
A 20-unit building with five-year-old roofs, original 1970s plumbing, and no HVAC reserve has a very different real NOI than its current rent roll suggests. Deferred maintenance doesn’t show up in operating expenses until something breaks — at which point it becomes your problem, not the seller’s. Get a professional inspection. Estimate deferred items. Either price those costs into your offer or adjust your NOI downward to reflect realistic capital requirements. The rental property analysis guide covers how to build these costs into your underwrite.
Mistake 4: Not Adjusting for Below-Market Rents
This one cuts both ways. If a building has long-term tenants paying $750/month in units that market at $1,100, the current NOI understates the property’s potential — which is fine as long as you know what you’re paying for. The flip side: if you value based on pro-forma market rents but those rents require $15,000 per unit in renovations to achieve, you’ve overpaid for a value-add play you didn’t price in. Always know whether current rents are at market, below market, or above market, and adjust your valuation method accordingly.
Learn how to estimate what a property should realistically collect before you start the math in How to Estimate Rental Property Income.
Disclaimer: The information is for educational purposes only and does not constitute financial, tax, or legal advice. Real estate investing involves risk. Consult a licensed appraiser, CPA, or real estate attorney before making investment decisions. Property values, cap rates, and market conditions change over time and vary by location.
Frequently Asked Questions
{
“@context”: “https://schema.org”,
“@type”: “FAQPage”,
“mainEntity”: [
{
“@type”: “Question”,
“name”: “How do you calculate property value based on rental income?”,
“acceptedAnswer”: {
“@type”: “Answer”,
“text”: “The most common method is the cap rate method: Property Value = Net Operating Income ÷ Cap Rate. Calculate your NOI by subtracting vacancy loss and all operating expenses from gross rent, then divide by the local market cap rate. A property earning $30,000 NOI in a 7% cap rate market is worth approximately $428,571.”
}
},
{
“@type”: “Question”,
“name”: “What cap rate should I use to value a rental property?”,
“acceptedAnswer”: {
“@type”: “Answer”,
“text”: “Use the cap rate derived from recent comparable sales in your specific submarket — not national averages. Cap rates for B-class multifamily range from roughly 4.5% in coastal gateway cities to 7.5–8% in Midwest secondary markets. Ask a local commercial broker, check LoopNet for comparable listings, or use our cap rate by state guide for baseline benchmarks.”
}
},
{
“@type”: “Question”,
“name”: “Is the GRM method accurate enough to value a property?”,
“acceptedAnswer”: {
“@type”: “Answer”,
“text”: “The Gross Rent Multiplier method is fast but less accurate than the cap rate method because it ignores operating expenses. Use GRM for initial screening — to quickly decide whether a deal deserves deeper analysis. Always follow up with a full NOI and cap rate calculation before making an offer.”
}
},
{
“@type”: “Question”,
“name”: “What expenses should I include when calculating NOI?”,
“acceptedAnswer”: {
“@type”: “Answer”,
“text”: “Include all operating expenses: property taxes, insurance, property management fees, maintenance and repairs, capital expenditure reserves, landlord-paid utilities, landscaping, and administrative costs. Do NOT include mortgage payments (principal or interest), depreciation, or income taxes. NOI is calculated on a debt-free basis.”
}
},
{
“@type”: “Question”,
“name”: “Can I use rental income to determine value on a single-family rental?”,
“acceptedAnswer”: {
“@type”: “Answer”,
“text”: “Yes, though single-family rentals are often valued by sales comps first. The income approach still applies — calculate NOI and divide by a market cap rate or apply a market GRM to gross rent. In markets where single-family rentals are institutionally traded (like Phoenix or Atlanta), income-based valuation is increasingly standard.”
}
},
{
“@type”: “Question”,
“name”: “What is a good NOI for a rental property?”,
“acceptedAnswer”: {
“@type”: “Answer”,
“text”: “There’s no universal answer — NOI depends on purchase price and your return requirements. A useful benchmark: your NOI divided by purchase price (the cap rate) should exceed the 10-year Treasury yield by at least 150–200 basis points to compensate for illiquidity and management burden. Many investors target NOI yields of 6–8% on the purchase price at current rate levels.”
}
},
{
“@type”: “Question”,
“name”: “How does deferred maintenance affect income-based property valuation?”,
“acceptedAnswer”: {
“@type”: “Answer”,
“text”: “Deferred maintenance reduces value in two ways: it increases future capital expenditures (which lowers real NOI when you underwrite them properly) and it may require immediate investment after closing to maintain occupancy. Get a professional inspection, quantify deferred items, add them as a reserve line in your NOI calculation, and factor the total remediation cost into your offer price.”
}
}
]
}
Leave a Reply