Last updated: October 26, 2026 · Originally published: October 23, 2026 · By Alex Petrov
I analyzed 47 rental property listings across five South Carolina markets last quarter. The cap rate spread was enormous: a renovated duplex in downtown Charleston capped at 4.2%, while a comparable property in Columbia delivered 7.8%. Same state, same property type, same analysis method — but a 3.6 percentage point gap that translates to $10,800 per year in NOI difference on a $300,000 property. Understanding where the South Carolina cap rate numbers land — and why they vary so dramatically by city — is the difference between buying a cash-flowing rental and an expensive appreciation bet.
South Carolina has become one of the Southeast’s hottest investor markets. Population growth of 1.7% annually (3.4 times the national average) drives rental demand across all five major metros. But the state is not one market — it is three distinct investment tiers. This guide breaks down South Carolina cap rates by city with the actual numbers investors need: property tax rates, insurance costs, vacancy data, rent comps, and the strategy that fits each market. Run your SC deal through the South Carolina cap rate calculator with pre-loaded local data.
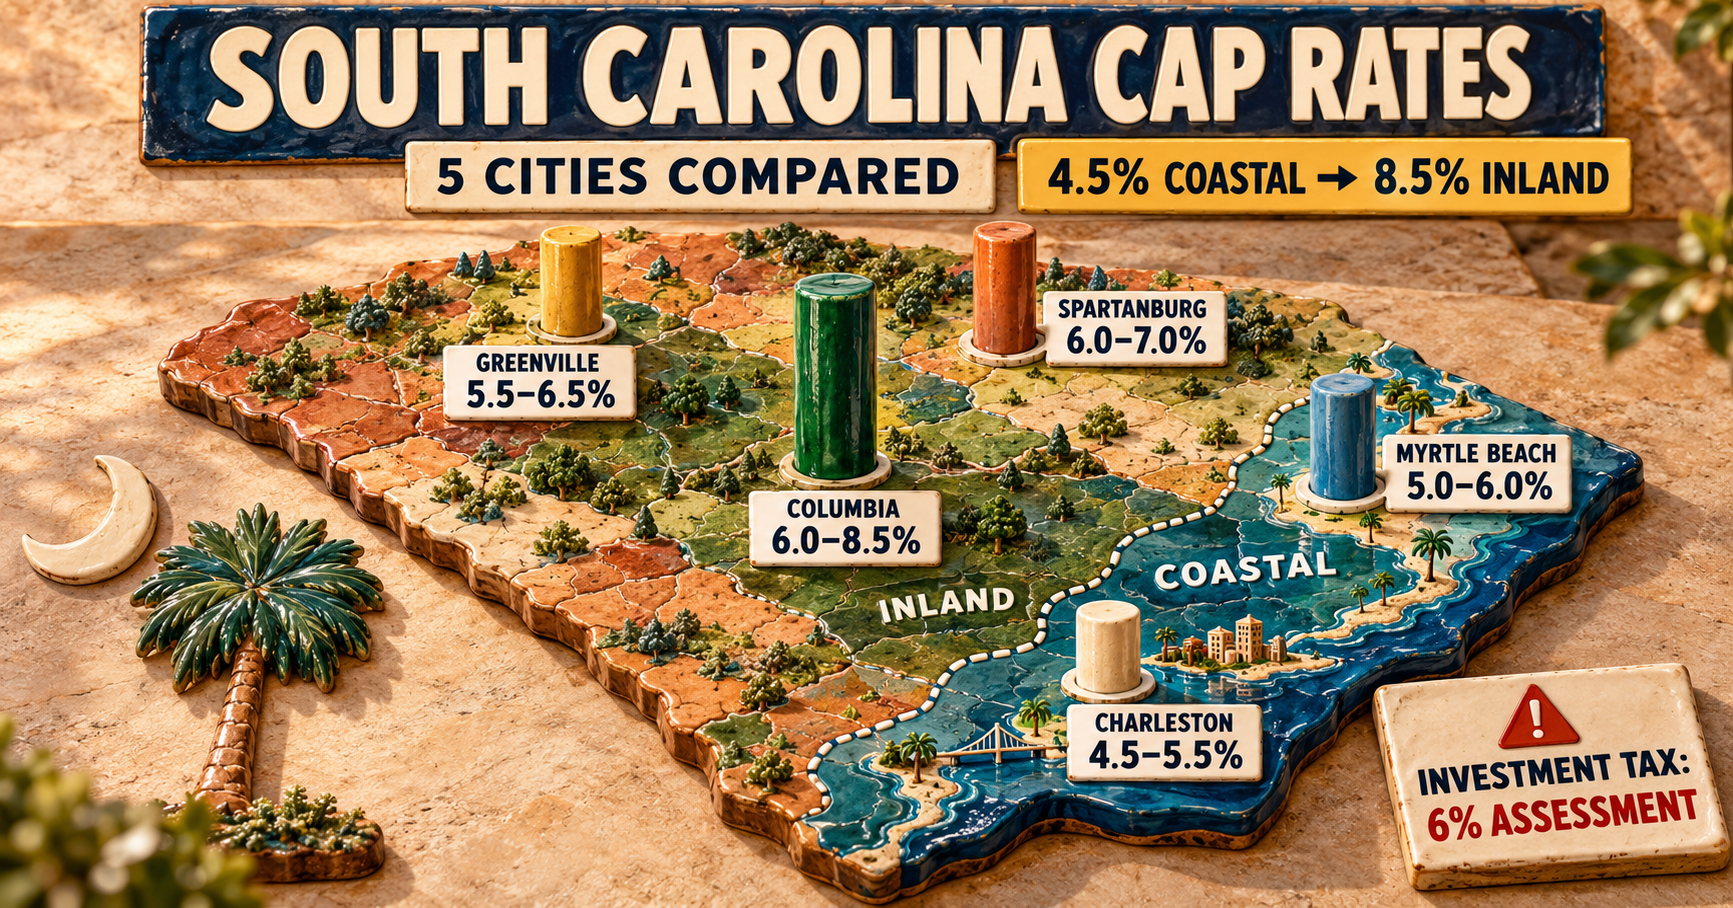
South Carolina Cap Rates by City: The Full Picture
Every cap rate discussion starts with a table — but most tables miss the context. Here are the numbers with the expense data that actually determines whether a deal works.
| City | Median Price | Median Rent (SFR) | Cap Rate Range | Effective Tax Rate | Insurance Avg | Vacancy |
|---|---|---|---|---|---|---|
| Charleston | $420,000 | $1,800/mo | 4.5-5.5% | 0.55% | $3,200/yr | 5.5% |
| Greenville | $285,000 | $1,400/mo | 5.5-6.5% | 0.60% | $1,800/yr | 5.8% |
| Columbia | $225,000 | $1,200/mo | 6.0-8.5% | 0.65% | $1,600/yr | 7.2% |
| Myrtle Beach | $310,000 | $1,500/mo | 5.0-6.0% | 0.50% | $3,800/yr | 8.5% |
| Spartanburg | $210,000 | $1,100/mo | 6.0-7.0% | 0.62% | $1,500/yr | 7.0% |
Sources: U.S. Census Bureau Housing Vacancy Survey, Zillow Research 2026, SC Department of Revenue property tax data, insurance carrier rate filings.
The South Carolina cap rate pattern is clear: coastal markets (Charleston, Myrtle Beach) trade at lower cap rates with higher insurance costs. Inland markets (Columbia, Spartanburg, Greenville) deliver stronger cash yields with more affordable operating expenses. Your target South Carolina cap rate depends on whether you prioritize current cash flow or long-term equity growth.
The SC Property Tax Trap Every Investor Must Know
South Carolina uses a dual assessment system that trips up first-time SC investors. Owner-occupied homes are assessed at 4% of fair market value. Investment property — anything you do not live in — is assessed at 6% of market value. This is not a small difference.
On a $300,000 property:
- Owner-occupied: $300,000 × 4% = $12,000 assessment × local millage rate ≈ $1,710/year
- Investment: $300,000 × 6% = $18,000 assessment × local millage rate ≈ $2,580/year
That $870 annual difference ($72.50/month) directly reduces your NOI and drops your cap rate by roughly 0.3 percentage points. When you buy a property that was previously owner-occupied, the assessment ratio changes at the next reassessment cycle — meaning your first-year tax bill will be 40-50% higher than what the seller was paying. Budget for this increase before you make an offer.
The effective investment property tax rate averages 0.86% statewide — competitive with Tennessee (0.71%) and Georgia (0.92%), and dramatically lower than Texas (1.80%) or Ohio (1.59%). This is one of SC’s biggest advantages for investors. The SC cap rate calculator automatically uses the 0.86% investment rate so you do not accidentally overstate your NOI.
Charleston: Premium Cap Rates for Appreciation Investors
Charleston is South Carolina’s most expensive and fastest-growing market. A median home price of $420,000 and rents of $1,800/month produce cap rates of 4.5-5.5% — the lowest in the state but backed by the strongest appreciation story.
What Drives Charleston’s Low Cap Rates
Three forces compress the South Carolina cap rate in Charleston. First, the tech sector expansion: companies relocating from Austin, Denver, and Bay Area bring high-income renters who push rental demand without proportional housing supply. Second, tourism: Charleston was named America’s Best City by Travel + Leisure for a decade running, generating consistent short-term rental income that supports property values. Third, military presence: Joint Base Charleston provides 3,600+ permanent personnel with housing allowances that set a rent floor.
Investors in Charleston accept 4.5-5.5% cap rates because they expect 5-6% annual appreciation on top. Over a 7-year hold, that appreciation adds $140,000-$180,000 in equity on a $420,000 property — dwarfing the cash flow difference versus a higher-cap-rate market. But this strategy requires patience and deep reserves. If appreciation stalls, you are holding a cash-flow-thin asset at premium insurance rates.
The Charleston Insurance Problem
Landlord insurance in Charleston averages $3,200/year — double what you would pay in Greenville ($1,800) or Columbia ($1,600). Properties within one mile of the coast may need a separate windstorm policy through the SC Wind and Hail Underwriting Association, adding $500-$1,500/year on top.
This insurance gap directly impacts your South Carolina cap rate calculation. A $300,000 property paying $3,500/year in Charleston insurance has $1,900 more in annual expenses than an identical property in Greenville at $1,600. That $1,900 reduces NOI and drops the cap rate by 0.6 percentage points. Always get three insurance quotes before making an offer on any coastal SC property. Factor real quotes — not statewide averages — into your NOI calculation.
Greenville: The Balanced Play
The South Carolina cap rate sweet spot is Greenville, which offers what most investors are actually looking for: meaningful cash flow plus solid appreciation. Cap rates of 5.5-6.5% sit in the middle of the SC range, and population growth of 2.1% annually (the fastest in the state) means these numbers are likely to hold or improve.
Why Greenville Is SC’s Best Risk-Adjusted Market
The employer base tells the story. BMW’s manufacturing plant, Michelin’s North American headquarters, and a rapidly growing healthcare sector provide diversified demand that does not depend on any single industry. When one sector contracts, others absorb the slack. This diversity shows up in Greenville’s vacancy rate: 5.8% — the lowest in SC after Charleston — despite significantly more affordable rents.
Insurance costs are the hidden advantage. At $1,800/year versus Charleston’s $3,200, Greenville saves $1,400 annually per property. On a 5-property portfolio, that is $7,000/year back in your pocket — or reinvested into the next acquisition. Combined with a $285,000 median price (versus $420,000 in Charleston), Greenville delivers better cash-on-cash returns at lower total capital commitment.
Model a Greenville deal with the SC rental property calculator and compare directly against Charleston numbers. The difference is striking.
Columbia: Cash Flow Capital of South Carolina
For the highest South Carolina cap rate, look at Columbia. If your strategy is monthly income over equity growth, Columbia is the strongest market in South Carolina. Cap rates of 6.0-8.5% at the lowest median price in the state ($225,000) mean many deals cash flow positive from day one — even at 2026 interest rates.
Three Recession-Resistant Demand Drivers
Columbia’s rental market rests on three pillars that do not disappear in economic downturns. State government employees are the first: According to Bureau of Labor Statistics data, South Carolina’s capital city has the largest concentration of government workers in the state, and government jobs do not follow private-sector layoff cycles. The University of South Carolina is the second: 35,000+ students create permanent rental demand for apartments and houses near campus. Fort Jackson is the third: the Army’s largest basic training installation processes 50,000 soldiers annually, and the 3,600 permanent personnel and their families need housing year-round.
The tradeoff: Columbia appreciates at 3-4% annually versus Greenville’s 4.5% and Charleston’s 5-6%. Over a 10-year hold on a $225,000 property, the appreciation difference versus Charleston is approximately $45,000-$67,000. But Columbia investors collect higher monthly cash flow every single month — and the lower entry price ($225,000 vs $420,000) means you can buy almost two Columbia properties for the price of one Charleston property. Use the cap rate calculator to compare total return across markets.
Myrtle Beach and Spartanburg: Niche Plays
Myrtle Beach: STR Potential, LTR Challenges
Myrtle Beach’s 5.0-6.0% cap rate for long-term rentals masks its real potential — and its real risk. As an STR market, properly managed Airbnb properties can gross 2-3x the LTR rent during peak season (May-September). But LTR vacancy at 8.5% is the highest in SC, and insurance at $3,800/year is the most expensive. Myrtle Beach is a specialized play that rewards investors with STR management experience and punishes those who assume it operates like a standard rental market. Model STR income with the Airbnb calculator.
Spartanburg: Lowest Entry in SC
At $210,000 median price and $1,100/month rent, Spartanburg offers the lowest barrier to entry in South Carolina. Cap rates of 6.0-7.0% are solid, and the proximity to Greenville (30 minutes) means Spartanburg benefits from spillover growth as Greenville prices rise. Manufacturing employers (BMW suppliers, logistics companies) provide blue-collar rental demand. The risk: Spartanburg’s economy is less diversified than Greenville’s, and appreciation has historically lagged at 3-3.5% annually.
How to Analyze a South Carolina Cap Rate Deal
Follow this process for any SC property:
- Start with the investment tax rate. Use 0.86% — not the seller’s owner-occupied bill. On a $280,000 property, that is $2,408/year, not the $1,600 the seller currently pays.
- Get a real insurance quote. Call three carriers. Coastal vs inland makes a $1,500+/year difference that swings your cap rate by 0.5+ points.
- Use market-specific vacancy. Charleston 5.5%, Greenville 5.8%, Columbia 7.2%, Myrtle Beach 8.5%, Spartanburg 7.0%. Do not use a generic 5% for the whole state.
- Include management. SC PM runs 8-10% for LTR. Even if you self-manage, price it in — see our PM costs guide.
- Run the calculator. The SC cap rate calculator pre-loads all these defaults. Enter your specific property details for accurate results.
- Compare across markets. A 5.5% cap in Greenville with 4.5% appreciation may beat a 7% cap in a flat market. Total return = cap rate + appreciation + equity buildup.
For financing analysis, check your DSCR and estimate closing costs (SC requires attorney at closing). Budget reserves per our cash reserves guide.
Common Mistakes When Calculating SC Cap Rates
- Using the 4% owner-occupied tax rate instead of the 6% investment rate. Overstates NOI by $700-$1,200/year on a typical SC property and inflates your cap rate by 0.25-0.40 points.
- Using statewide insurance averages for coastal properties. A $2,400 average means nothing when your Charleston property costs $3,800. Get real quotes.
- Ignoring Myrtle Beach seasonal vacancy. LTR vacancy of 8.5% is significantly higher than other SC markets. The statewide 6.8% average distorts projections.
- Comparing SC cap rates to Ohio or Texas directly. SC has lower property taxes but higher insurance (coastal). Ohio has higher taxes but cheaper insurance. Compare NOI on the same property price, not cap rates in isolation.
- Forgetting that cap rate excludes financing. A 6% cap rate does not mean 6% return on your cash. After mortgage payments, your cash-on-cash return may be 2-4%. Check with the cash-on-cash calculator.
South Carolina vs Other Investor States
| State | Median Price | Avg Cap Rate | Property Tax | Insurance | Population Growth |
|---|---|---|---|---|---|
| South Carolina | $280,000 | 5.5-7.5% | 0.86% | $2,400 | 1.7% |
| Ohio | $210,000 | 6.0-8.5% | 1.59% | $1,200 | 0.2% |
| Tennessee | $280,000 | 5.5-7.0% | 0.71% | $1,500 | 0.8% |
| Georgia | $290,000 | 5.0-7.0% | 0.92% | $1,600 | 1.0% |
| Indiana | $220,000 | 6.0-8.0% | 0.85% | $1,200 | 0.3% |
| Texas | $320,000 | 5.0-7.0% | 1.80% | $2,400 | 1.5% |
SC stands out for its combination of strong population growth (1.7%) and low property taxes (0.86%). Ohio offers higher cap rates but nearly flat population growth. Texas has strong growth but property taxes eat into NOI. Tennessee has the lowest taxes but slower growth than SC. For a deeper market comparison, see our best cities for real estate investment guide.
Frequently Asked Questions
What is a good cap rate in South Carolina?
A good South Carolina cap rate ranges from 5.5% to 7.5% for single-family rentals depending on market. Charleston: 4.5-5.5% (accept lower for appreciation). Greenville: 5.5-6.5% (best balance). Columbia: 6.0-8.5% (best cash flow). Spartanburg: 6.0-7.0%. Anything below 4.5% is overpaying unless you have strong appreciation evidence. Above 8% is excellent but investigate potential issues. Run your specific deal through the SC cap rate calculator.
How do SC property taxes affect cap rates?
SC assesses investment property at 6% of market value (versus 4% owner-occupied), creating an effective tax rate of 0.86%. When buying an owner-occupied home to convert to rental, expect a 40-50% tax increase. This directly reduces NOI and lowers cap rate by 0.25-0.40 points. Always use the 6% investment assessment rate in your analysis — not the seller’s current owner-occupied bill.
Is South Carolina good for real estate investing in 2026?
Yes. SC offers low property taxes (0.86%), strong population growth (1.7% — driven by migration from high-cost states), landlord-friendly laws (no rent control, fast eviction), no state estate tax, and diverse markets for different strategies. The main risk is coastal insurance costs in Charleston and Myrtle Beach. Inland markets (Greenville, Columbia, Spartanburg) offer strong fundamentals with more affordable entry points and operating costs.
Charleston vs Greenville: which is better for investors?
Greenville is better for most investors — higher cap rates (5.5-6.5% vs 4.5-5.5%), lower entry prices ($285,000 vs $420,000), half the insurance costs ($1,800 vs $3,200), and the fastest population growth in SC (2.1%). Charleston wins on appreciation potential (5-6% annually vs 4.5%). For cash flow: Greenville. For long-term equity: Charleston. For risk-adjusted total return: Greenville is the stronger play.
What vacancy rate should I use for South Carolina?
Use city-specific rates: Charleston 5.5%, Greenville 5.8%, Columbia 7.2%, Spartanburg 7.0%, Myrtle Beach 8.5%. The statewide average of 6.8% is acceptable for initial screening but actual vacancy depends on your submarket, property condition, and management quality. Properties near military bases (Fort Jackson, Joint Base Charleston) tend to have lower vacancy from consistent demand. Model different vacancy scenarios in the vacancy rate calculator.
Calculate Your South Carolina Cap Rate
Finding the best South Carolina cap rate for your portfolio depends on your strategy, capital, and hold period. Charleston rewards patience and deep pockets. Greenville rewards balanced investors who want both cash flow and growth. Columbia rewards cash flow maximizers willing to trade appreciation for immediate income.
Start with the numbers: open the South Carolina cap rate calculator, enter your property details with the correct investment property tax rate, real insurance quotes, and market-specific vacancy. Compare results across cities. Then check your financing with the SC DSCR calculator and budget total capital needed with the SC closing costs calculator.
The investors who build the best SC portfolios are not the ones who pick the highest cap rate — they are the ones who match the right market to the right strategy and let the numbers guide every decision.