Published: October 6, 2026 · By Alex Petrov
I own rental properties in four of the cities on this list. Not “I researched them online” — I mean I’ve sat across from property managers, argued over repair bids, and watched rent checks hit my account from these markets for years.
That experience shapes everything below. The best cities to invest in real estate in 2026 aren’t the ones that show up in clickbait headlines. They’re the ones where the math actually works — where you can buy at a price that makes sense, charge rent the local economy supports, and still have money left after expenses.
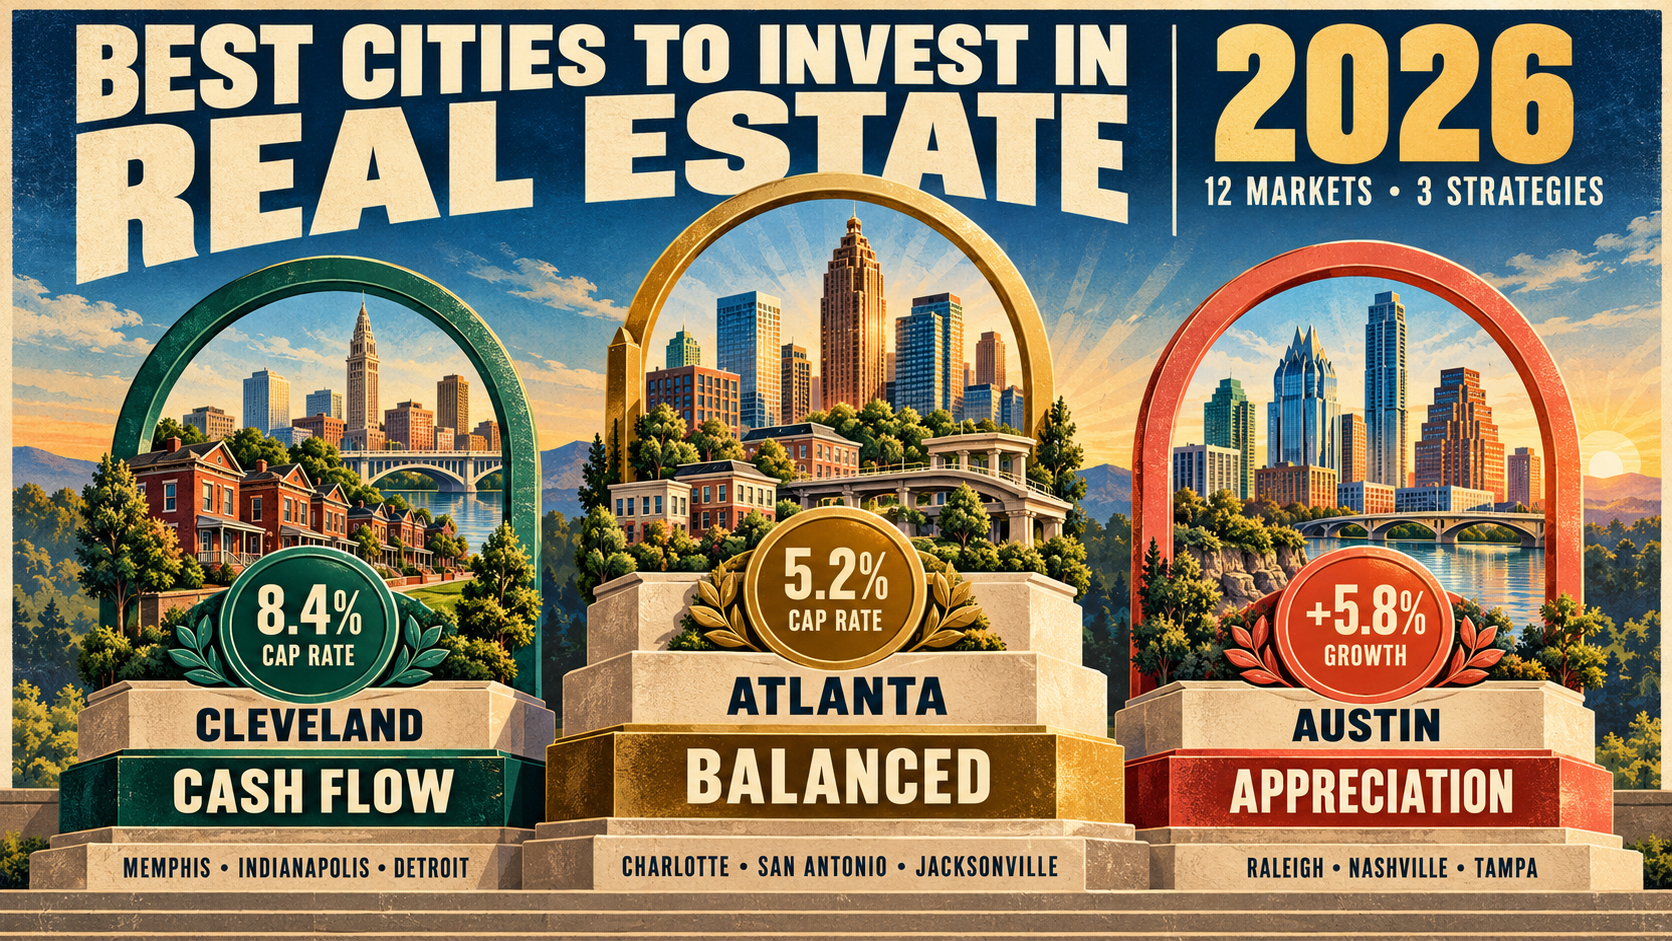
I’ve ranked 12 cities across three strategies: pure cash flow, long-term appreciation, and balanced plays. Every number comes from real listings and current market data. I also call out cities you should avoid, no matter how popular they are on Instagram.
If you want the state-level view first, check out my best states for rental property in 2026 breakdown. This article goes deeper — specific cities, specific numbers, specific deals.
How I Ranked These 12 Cities
Before we get into individual markets, here’s what I measured for each city:
- Median home price — what a typical 3-bed investor-grade property costs right now
- Median monthly rent — actual asking rents from Q3 2026, not Zestimate fantasies
- Cap rate — net operating income divided by purchase price. If you’re unclear on what counts as a good cap rate for rental property, start there.
- Price-to-rent ratio — annual rent divided into purchase price. Under 15 = strong buy territory
- Vacancy rate — current market vacancy from Census ACS and local MLS data
- Population growth — 5-year trend from U.S. Census Bureau population estimates
I weighted cash flow metrics (cap rate, price-to-rent) heaviest because that’s what keeps you solvent in year one. Appreciation is gravy — it shouldn’t be the only reason you buy.
All 12 Cities at a Glance
Here’s the full comparison. Scan this table first, then read the city-by-city breakdowns below.
| City | Strategy | Median Price | Median Rent | Cap Rate | Price-to-Rent | Vacancy | 5-Yr Pop Growth |
|---|---|---|---|---|---|---|---|
| Cleveland, OH | Cash Flow | $128,000 | $1,250 | 8.4% | 8.5 | 6.8% | -0.3% |
| Memphis, TN | Cash Flow | $155,000 | $1,380 | 7.6% | 9.4 | 7.2% | +0.4% |
| Indianapolis, IN | Cash Flow | $195,000 | $1,520 | 6.9% | 10.7 | 5.9% | +1.8% |
| Detroit, MI | Cash Flow | $112,000 | $1,180 | 8.9% | 7.9 | 8.1% | -0.6% |
| Atlanta, GA | Balanced | $335,000 | $1,950 | 5.2% | 14.3 | 5.4% | +3.2% |
| Charlotte, NC | Balanced | $348,000 | $1,890 | 4.8% | 15.3 | 4.9% | +4.1% |
| San Antonio, TX | Balanced | $275,000 | $1,620 | 5.5% | 14.1 | 6.1% | +2.7% |
| Jacksonville, FL | Balanced | $310,000 | $1,780 | 5.1% | 14.5 | 5.7% | +3.5% |
| Austin, TX | Appreciation | $435,000 | $1,980 | 3.6% | 18.3 | 7.4% | +5.8% |
| Raleigh, NC | Appreciation | $398,000 | $1,850 | 3.9% | 17.9 | 4.6% | +4.9% |
| Nashville, TN | Appreciation | $415,000 | $1,920 | 3.7% | 18.0 | 5.3% | +4.4% |
| Tampa, FL | Appreciation | $375,000 | $1,870 | 4.2% | 16.7 | 5.8% | +3.9% |
Now let’s dig into each group.
Cash Flow Markets: Buy for Monthly Income
These four cities won’t make you rich through appreciation. Prices are flat or growing slowly. But the rent-to-price ratios are strong enough that you can generate real positive cash flow from day one — even with a mortgage, property management, and reserves.
1. Cleveland, Ohio — The Midwest Cash Flow King
Cleveland keeps showing up on these lists because the math keeps working. A $128,000 three-bedroom in neighborhoods like Old Brooklyn, Parma, or Lakewood rents for $1,200–$1,300 per month. That’s a price-to-rent ratio of 8.5, which is among the best in the country.
The cap rate sits around 8.4% before financing — meaning your return on the property itself is strong even if appreciation stays at zero. Run the numbers yourself on our Ohio cap rate calculator with a $128K purchase price and $1,250 in rent.
The downside? Population has dipped slightly (-0.3% over five years). Cleveland isn’t a growth story. But the healthcare sector (Cleveland Clinic is the city’s largest employer) keeps the rental market stable. Vacancy sits at 6.8% — elevated but not alarming for a cash flow market.
Best for: Out-of-state investors who want predictable monthly income and can handle older housing stock.
2. Memphis, Tennessee — Section 8 Demand Drives Returns
Memphis has one of the strongest Section 8 voucher programs in the Southeast. Over 30% of renters in Shelby County use housing assistance, which means guaranteed rent payments from HUD if you accept vouchers.
Median price of $155,000 against $1,380 in monthly rent gives you a 7.6% cap rate. The Tennessee rental property calculator shows the full breakdown with Tennessee’s zero state income tax factored in — that’s a real advantage over Ohio.
Crime rates in certain zip codes are high. Stick to 38117, 38120, 38134, and 38135 for better tenant quality and lower turnover. Property management is a must here — I wouldn’t try to self-manage from out of state.
Memphis population growth is barely positive at +0.4%, but the metro area (including Germantown and Collierville) is growing faster at around 1.2% annually according to Bureau of Labor Statistics regional data.
Best for: Investors comfortable with Section 8 tenants and willing to screen property managers carefully.
3. Indianapolis, Indiana — Best Overall Cash Flow City
If I had to pick one city for a new investor buying their first out-of-state rental, it would be Indianapolis. Here’s why:
- Median price of $195,000 is affordable but not so cheap that you’re dealing with war zones
- $1,520 monthly rent gives you a 6.9% cap rate — solid but not dependent on Section 8
- Population growth of +1.8% means the tenant pool is actually expanding
- Vacancy at 5.9% is healthier than Cleveland or Memphis
- Indiana landlord laws are reasonable compared to tenant-friendly states
The Fountain Square, Irvington, and Broad Ripple areas have seen steady rent growth of 4–5% annually. Use the Indiana cap rate calculator to model different purchase prices — you’ll find that anything under $210K with rent above $1,450 still pencils out after all expenses.
Best for: First-time out-of-state investors who want decent cash flow without the rough neighborhoods of Detroit or Memphis.
4. Detroit, Michigan — Highest Returns, Highest Risk
Detroit has the best numbers on paper: $112,000 median price, $1,180 rent, 8.9% cap rate, price-to-rent ratio of 7.9. On a spreadsheet, it’s the clear winner.
In practice, Detroit requires more homework than any other city on this list. The housing stock is old — most investor-grade properties were built before 1960. Insurance costs have spiked 25–30% since 2023. And the vacancy rate of 8.1% is the highest on our list.
The turnaround zones (Corktown, Midtown, Southwest Detroit) have seen legitimate investment, but these areas are already priced above the median. The real cash flow plays are in neighborhoods like Brightmoor and East English Village, where you need a property manager who knows which blocks to avoid.
Don’t forget to factor in Michigan’s high closing costs — run the numbers on the Michigan closing costs calculator before making offers. A $112K property might cost you $5,500–$7,000 to close.
Best for: Experienced investors with a trusted local team already in place. Not a market to learn on.
Cash Flow Markets — Quick Comparison
| Metric | Cleveland | Memphis | Indianapolis | Detroit |
|---|---|---|---|---|
| Median Price | $128,000 | $155,000 | $195,000 | $112,000 |
| Monthly Rent | $1,250 | $1,380 | $1,520 | $1,180 |
| Cap Rate | 8.4% | 7.6% | 6.9% | 8.9% |
| State Income Tax | Yes (3.5%) | No | Yes (3.05%) | Yes (4.05%) |
| My Rating | B+ | B | A- | B- |
Balanced Markets: Cash Flow + Growth
These four cities cost more upfront, so your cap rates are lower. But population growth, job diversification, and rent appreciation give you a second engine. You’re getting paid monthly AND building equity through market gains.
5. Atlanta, Georgia — The Southeast’s Economic Engine
Atlanta is expensive by Midwest standards — $335,000 median price — but cheap compared to peer cities like Dallas, Denver, or Miami. The 5.2% cap rate means it still cash flows with 20–25% down, especially in suburbs like College Park, East Point, and Decatur.
What makes Atlanta special is the depth of the job market. Delta, Home Depot, UPS, Coca-Cola, and a growing tech sector mean your tenants have options if one employer cuts back. Population growth of 3.2% over five years backs this up — people keep moving here.
Run your Atlanta deals through the Georgia rental property calculator. At $335K purchase with $1,950 rent and 25% down, you’re looking at roughly $180–$250/month positive cash flow depending on your rate and expense assumptions.
Georgia’s landlord-friendly eviction process (typically 30–45 days) is another plus. I’ve seen California evictions drag out for 6+ months. That doesn’t happen in Atlanta.
Best for: Investors who want both monthly income and 3–5% annual appreciation, with lower risk than pure cash flow markets.
6. Charlotte, North Carolina — Banking Capital Growth
Charlotte’s 4.1% population growth rate is the highest among our balanced markets. Bank of America and Wells Fargo headquarters anchor the economy, with fintech startups filling in around them.
At $348,000 median price and $1,890 rent, the 4.8% cap rate is on the thin side for cash flow. But Charlotte rents have grown 5.2% annually over the past three years, which means today’s thin cash flow becomes tomorrow’s strong cash flow if the trend holds.
The North Carolina DSCR calculator is worth running here. DSCR loans (which qualify based on rental income, not your personal income) work well in Charlotte because the rent-to-payment ratio is favorable at current rates.
Target the NoDa, Plaza Midwood, and University City areas for the best combination of tenant demand and price entry points. Avoid the SouthPark luxury market — cap rates drop below 3% and you’re just speculating on appreciation.
Best for: W-2 investors using DSCR loans who want exposure to a growing Southern metro without Austin-level prices.
7. San Antonio, Texas — The Undervalued Texas Play
Everyone talks about Austin and Dallas. San Antonio gets ignored — and that’s where the opportunity sits.
At $275,000 median price, San Antonio is 37% cheaper than Austin with a cap rate of 5.5% versus Austin’s 3.6%. Military bases (Fort Sam Houston, Lackland, Randolph) provide a steady tenant pipeline that doesn’t depend on tech hiring cycles.
Texas has no state income tax, which adds 3–5% to your effective return compared to states like Ohio or Michigan. The Texas rental property calculator accounts for this — plug in San Antonio numbers and compare to a Cleveland deal side by side.
The catch: Texas property taxes are high. Bexar County rates run 2.1–2.4% of assessed value, which eats into your cap rate. Factor this in from the start or you’ll be surprised at your first tax bill.
Population growth of 2.7% is solid. The city has added 45,000 residents over the past five years, and new construction hasn’t kept pace — which is bullish for landlords.
Best for: Investors who like Texas fundamentals but find Austin and Dallas overpriced.
8. Jacksonville, Florida — Florida Without the Bubble
Jacksonville is Florida’s largest city by land area, and it’s the last major Florida metro where median prices haven’t gone completely sideways. At $310,000, you’re paying 17% less than Tampa and 40% less than Miami.
The 5.1% cap rate is decent for Florida, where insurance costs have eaten into returns across the state. Speaking of insurance — budget $3,500–$4,800 annually for a single-family rental in Duval County. It’s higher than the national average but lower than South Florida.
Use the Florida cap rate calculator and make sure you’re including realistic insurance numbers. I’ve seen too many investors use $1,800/year for Florida insurance and then wonder why their returns collapsed.
Jacksonville’s port expansion and the growing logistics sector (Amazon, Wayfair distribution centers) support population growth of 3.5%. The Arlington, Mandarin, and Riverside neighborhoods offer the best rental yields for investors.
Best for: Investors who want Florida appreciation and landlord-friendly laws without Miami or Tampa price tags.
Appreciation Markets: Betting on Growth
Fair warning: these four cities are harder to cash flow. Cap rates are below 4.5%, which means you might break even or lose $50–$100/month after debt service. You’re betting that 5–8% annual appreciation more than makes up for it.
That bet has paid off historically in these markets. But it can also go wrong — Austin proved this in 2023 when prices dropped 15% from peak. If your stomach can handle temporary unrealized losses, read on.
9. Austin, Texas — The Tech Migration Play
Austin’s 2021–2022 price spike, followed by a 2023 correction, followed by a 2024–2026 recovery, tells you everything about this market: it’s volatile but the long-term trend is up.
At $435,000 median price and $1,980 rent, the 3.6% cap rate won’t excite any cash flow investor. Vacancy at 7.4% is elevated because of new apartment supply that flooded the market in 2024–2025.
But Austin’s job growth tells a different story. Tesla’s Gigafactory, Oracle’s relocated HQ, Samsung’s fab plant, and a steady stream of California tech relocations have pushed population growth to 5.8% over five years. That’s the highest on our entire list.
If you buy in Austin, you’re making a 5–10 year bet on continued tech migration and constrained single-family supply. I think that bet works, but only if you can stomach negative or break-even cash flow in the early years. Check your rental property ROI with realistic 5-year appreciation assumptions before pulling the trigger.
Best for: High-income investors who can subsidize early losses and want maximum long-term equity growth.
10. Raleigh, North Carolina — Research Triangle Strength
Raleigh flies under the radar compared to Austin and Nashville, but the fundamentals are just as strong — and the entry price is lower.
The Research Triangle (Raleigh-Durham-Chapel Hill) has the highest concentration of PhD holders per capita in the country. Apple’s $1 billion campus, Google’s engineering hub, and 200+ biotech firms mean the tenant pool skews high-income and stable.
At $398,000 and $1,850/month rent, the 3.9% cap rate barely cash flows. But Raleigh’s 4.9% population growth and tight vacancy of 4.6% suggest rents will keep rising. Over the past three years, Raleigh rents have grown 6.1% annually — faster than any other city on this list.
According to Zillow Research data, Raleigh home values have appreciated 38% over the past five years, outpacing the national average of 29%.
Best for: Investors who missed Austin at $300K and want a similar growth story at a lower entry point.
11. Nashville, Tennessee — Tourism + Migration
Nashville combines two demand drivers that most cities have only one of: massive tourism (15+ million visitors annually) and strong population migration (+4.4% over five years).
The tourism angle opens up short-term rental potential. A property that rents for $1,920/month as a long-term rental might generate $3,500–$4,200/month on Airbnb during peak season. Davidson County has STR regulations, but they’re manageable compared to cities that have effectively banned them.
At $415,000 median price, Nashville is the second most expensive city on our list. The 3.7% cap rate for long-term rentals is thin. But the STR upside and Tennessee’s zero state income tax tilt the equation.
The healthcare sector (HCA Healthcare, Vanderbilt) adds recession resistance that pure tourism cities like Las Vegas lack. Check your deal against the vacancy rate calculator — Nashville’s 5.3% vacancy is healthy for a market this size.
Best for: Investors open to short-term rental strategies, or long-term holders who value Tennessee’s tax advantages.
12. Tampa, Florida — Appreciation with a Hurricane Asterisk
Tampa rounds out the appreciation group with a $375,000 median price and 4.2% cap rate — the strongest cash flow numbers in this category. Population growth of 3.9% is powered by Northeast and Midwest migration that shows no signs of slowing.
The elephant in the room is insurance. Florida’s property insurance market has been in crisis since 2022, and Tampa — sitting on Tampa Bay with hurricane exposure — is ground zero. Budget $4,500–$6,500 annually for a single-family rental. Some zip codes near the coast are even higher.
If you can stomach the insurance costs, Tampa’s fundamentals are strong. The Seminole Heights, Temple Terrace, and Brandon areas offer the best price-to-rent ratios. Avoid anything in a flood zone unless you’re specifically pricing in flood insurance (another $1,200–$2,400/year).
Tampa rents have grown 4.8% annually over three years, and median home values are up 31% over five years. The math works if your insurance stays stable — which is a big “if” in Florida.
Best for: Risk-tolerant investors who believe Florida migration will continue and insurance markets will stabilize.
Worked Example: Indianapolis Deal Breakdown
Let’s walk through an actual deal in Indianapolis — my top-ranked city for a first-time investor. I’m using real listing data from Q3 2026.
The Property
3-bed, 1.5-bath ranch in Irvington. Built 1955, updated kitchen and HVAC in 2021. Listed at $189,900. Purchased at $185,000 after inspection credits.
The Numbers
| Item | Monthly | Annual |
|---|---|---|
| Gross Rent | $1,500 | $18,000 |
| Vacancy (6%) | -$90 | -$1,080 |
| Effective Gross Income | $1,410 | $16,920 |
| Property Tax | -$158 | -$1,896 |
| Insurance | -$125 | -$1,500 |
| Property Management (8%) | -$120 | -$1,440 |
| Maintenance Reserve (5%) | -$75 | -$900 |
| CapEx Reserve (5%) | -$75 | -$900 |
| Net Operating Income | $857 | $10,284 |
| Mortgage (25% down, 6.75%, 30yr) | -$900 | -$10,800 |
| Cash Flow Before Tax | -$43 | -$516 |
Wait — negative cash flow? Yes, at 6.75% interest. But here’s the full picture:
Total Return Analysis
- Cash flow: -$516/year (break-even with a slightly higher rent or lower rate)
- Principal paydown: +$2,640/year (your tenant is paying off your mortgage)
- Appreciation (3%): +$5,550/year (conservative for Indianapolis)
- Tax benefits (depreciation): +$1,200/year estimated tax savings
Total return: $8,874/year on a $46,250 cash investment (25% down) = 19.2% ROI
That’s why experienced investors don’t fixate on monthly cash flow alone. The full rental property ROI picture includes four profit centers, not one. Plug your own numbers into the rental property calculator to run this analysis for any city on the list.
What Would Make This Deal Cash Flow Positive?
- Mortgage rate drops to 6.0% → +$68/month cash flow
- Rent increases to $1,575 (one year of 5% growth) → +$32/month cash flow
- Self-manage instead of paying 8% → +$120/month cash flow
Any one of these changes pushes the deal into the green. All three together give you $220/month positive cash flow.
Cities to Avoid in 2026
Not every popular market deserves your money. These cities have structural problems that make rental investing risky right now.
San Francisco, CA
Median price: $1.2 million. Median rent: $3,400. Cap rate: 1.8%. Price-to-rent ratio: 29.4. The math hasn’t worked for cash flow investors in over a decade. Add California’s tenant protection laws (just-cause eviction, rent control in many buildings, 60-day cure periods) and you’re taking all the risk for almost no return. Tech layoffs have pushed vacancy to 8.4% — the highest it’s been since 2009.
Miami, FL
Miami looks appealing on Instagram. The reality: $520,000 median price, $2,400 rent, 3.1% cap rate. Insurance runs $6,000–$9,000 annually. Condo fees in popular investor buildings have spiked 30–50% after the Surfside collapse prompted structural reserve requirements. Foreign buyer demand has cooled with the strong dollar. The party is over for now.
Denver, CO
Denver had a great run from 2014–2022. Now median prices sit at $545,000 with rents of $2,100 — a 2.9% cap rate that doesn’t even cover your mortgage. New apartment supply has pushed vacancy to 7.9%, and rent growth has turned negative (-1.3% year-over-year). Colorado’s new tenant protection laws add another layer of risk. Wait for a correction or look elsewhere.
Phoenix, AZ (Use Caution)
Phoenix isn’t a hard avoid, but it requires caution. The 2021–2022 price spike left many investors underwater, and while prices have recovered, the cap rate (4.0%) is thin for a market with 110-degree summers and rising water concerns. If Lake Mead drops further, long-term appreciation assumptions need rethinking. The data from National Association of Realtors research shows Phoenix transaction volume is down 22% from 2021 peaks.
How to Pick YOUR Best City
The “best” city depends entirely on what you’re optimizing for. Here’s a decision framework:
If you need cash flow now (you’re replacing W-2 income or building passive income): Cleveland, Memphis, Indianapolis, or Detroit. Start with Indianapolis if you’re new.
If you have a high income and want to build wealth (you don’t need monthly income today): Austin, Raleigh, or Nashville. Buy and hold for 7–10 years.
If you want both (moderate cash flow + moderate appreciation): Atlanta, Charlotte, San Antonio, or Jacksonville. These are the “sleep well at night” markets.
Whatever city you choose, run the numbers before you make offers. Use the cap rate calculator for quick screening and the rental property calculator for full deal analysis. A deal that looks good in your head often looks different on a spreadsheet.
Final Thoughts
I’ve been investing in rental property since 2017. The single biggest lesson I’ve learned: the city matters less than the deal. I’ve seen investors lose money in “hot” markets and make money in “boring” ones. Indianapolis isn’t exciting. Cleveland isn’t trendy. But they generate real cash flow month after month.
That said, market selection narrows your universe of deals. Buying in Cleveland means you’ll find more cash flow deals but fewer appreciation wins. Buying in Austin means the opposite. Neither is wrong — they’re different strategies for different goals.
Pick two or three cities from this list. Spend a month studying each one. Talk to local property managers, browse listings, run 20 deals through the calculators. Then buy the one where the numbers work and you trust the team on the ground.
The best time to invest was five years ago. The second-best time is after you’ve done the homework — which you just started by reading this.
FAQ
What is the best city to invest in real estate for beginners?
Indianapolis is the strongest choice for first-time rental investors in 2026. The median price of $195,000 keeps the down payment manageable (under $50K for 25% down), the 6.9% cap rate means positive cash flow is achievable from day one, and population growth of 1.8% provides a growing tenant pool. Indiana’s landlord-friendly laws and reasonable property taxes round out the picture. Unlike Detroit or Memphis, Indianapolis doesn’t require extensive local knowledge to avoid problem neighborhoods. Use the Indiana cap rate calculator to test deals before making offers.
How much money do I need to invest in real estate in these cities?
For cash flow markets like Cleveland or Detroit, you can get started with $30,000–$40,000 (25% down payment plus closing costs and reserves). Balanced markets like Atlanta or Charlotte require $90,000–$110,000. Appreciation markets like Austin or Nashville need $115,000–$135,000. These figures assume conventional financing with 25% down. DSCR loans sometimes accept 20% down but charge higher rates. Always keep 3–6 months of expenses in reserve beyond your down payment — unexpected repairs in month two shouldn’t put you in financial distress.
Should I invest locally or out of state?
If your local market has cap rates above 5%, invest locally — the management advantage of being nearby is worth a lot. If you live in a high-cost area (California, NYC, Seattle) where cap rates are 2–3%, out-of-state investing is almost mandatory for cash flow. The key to out-of-state success is building a local team: property manager, inspector, contractor, and real estate agent who works with investors (not just homebuyers). Budget 8–10% of rent for property management when investing remotely.
Are cash flow or appreciation markets better for building wealth?
Over 20+ years, appreciation markets typically build more total wealth because gains compound on the full property value, not just your equity. A $400K property appreciating 5% gains $20K in year one — more than most cash flow properties earn in pure income. But appreciation is unpredictable. Cash flow markets give you guaranteed returns every month and let you scale faster (each property funds the next down payment). The safest approach is a mix: start with 1–2 cash flow properties to build income, then add appreciation plays once you have financial cushion. Check how rental property ROI works to understand all four profit centers.
What cap rate should I target when investing in these cities?
Target cap rates depend on your strategy. For cash flow investing, aim for 7%+ (achievable in Cleveland, Memphis, Detroit, and Indianapolis). For balanced markets, 5–6% is realistic (Atlanta, San Antonio, Jacksonville). Appreciation markets will run 3.5–4.5% — you’re accepting lower current income for higher growth potential. The what is a good cap rate article explains how to adjust these targets based on interest rates, property condition, and local market risk. A 7% cap rate in Detroit carries more risk than a 7% cap rate in Indianapolis, so the same number can mean different things in different markets.
Leave a Reply