Last updated: October 13, 2026 · Originally published: October 12, 2026 · By Alex Petrov
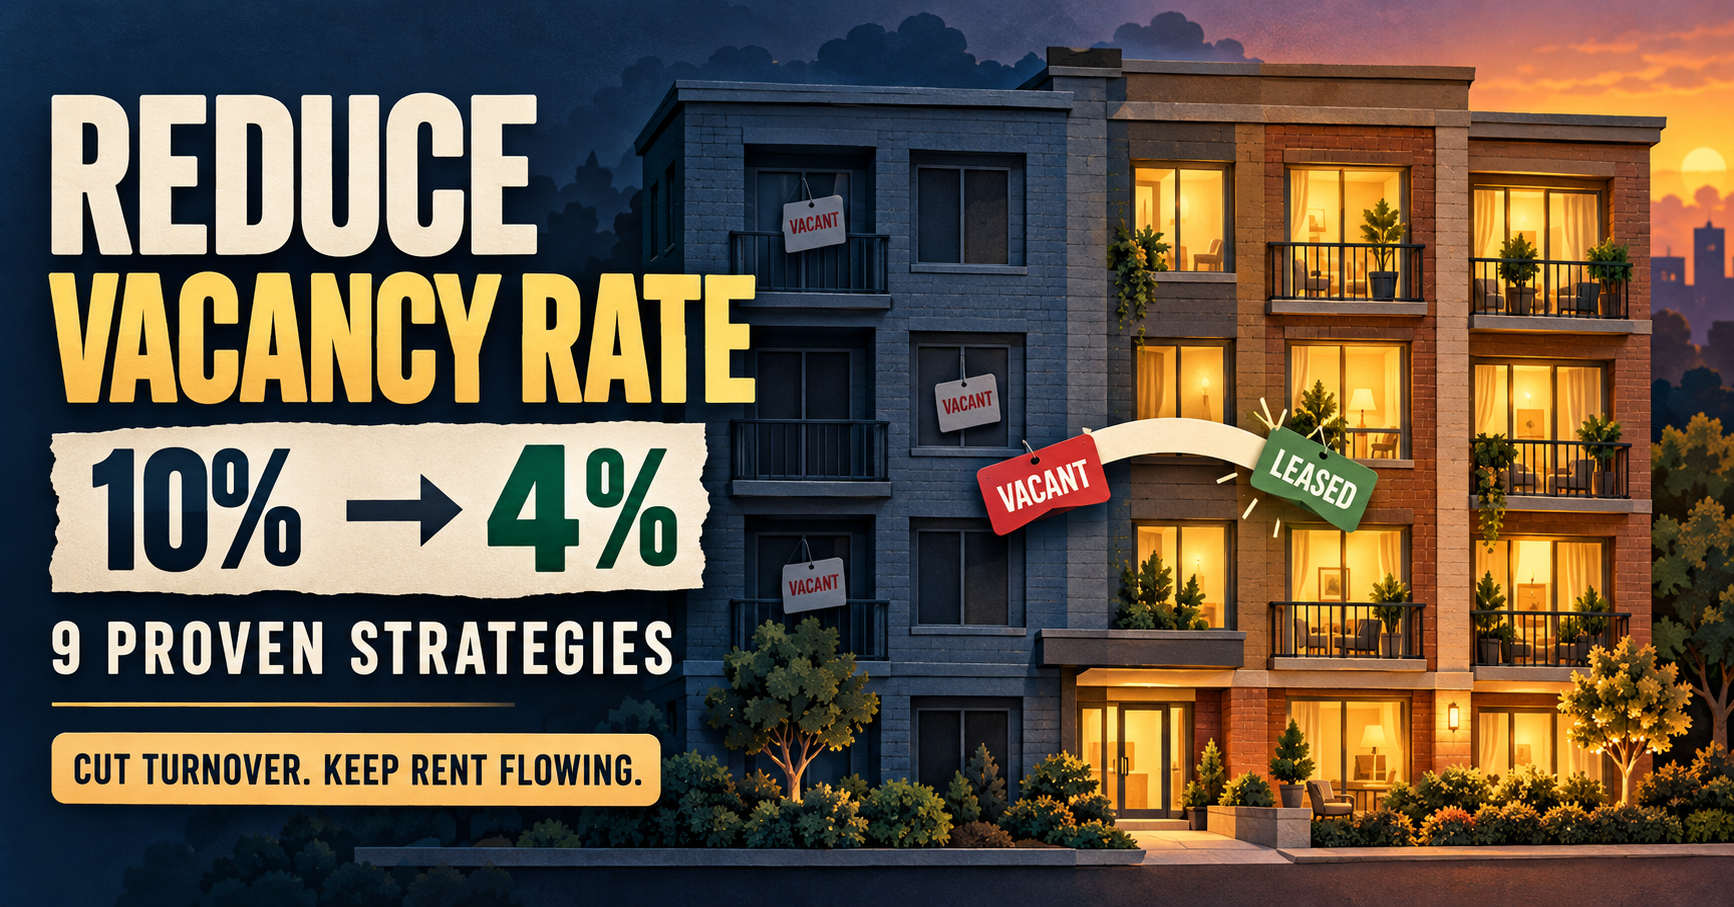
I’ve owned rental properties for 14 years, and the single most expensive mistake I see landlords make is ignoring vacancy. Not the kind where a unit sits empty for two weeks between tenants — I mean the slow bleed of 8%, 10%, 12% vacancy rates that quietly eat $3,000 to $5,000 per unit per year in lost income. Learning how to reduce vacancy rate turned my 22-unit portfolio from “decent” to genuinely profitable. The difference between a 10% vacancy rate and a 4% one across 22 doors was over $47,000 per year in additional collected rent.
Most landlords focus on finding deals and analyzing cap rates. That matters — but once you own the property, vacancy is the variable that determines whether your rental property analysis holds up in reality or falls apart within 18 months. Run your current vacancy numbers through the vacancy rate calculator before reading further. For step-by-step instructions on using the tool, see our vacancy rate calculator guide. You need a baseline to measure improvement against.
Below are the nine strategies I’ve used — and watched other experienced landlords use — to cut vacancy rates in half. These aren’t theoretical. Every tactic comes with dollar amounts, because a strategy that costs more than it saves is just an expensive hobby.
The Real Cost of Vacancy (It’s Worse Than You Think)
Before we get into solutions, let’s make sure you understand what vacancy actually costs. Most landlords calculate lost rent. That’s only part of the damage.
When a tenant leaves, you lose rent during the vacant period. But you also pay for turnover: cleaning, painting, minor repairs, re-listing, showing the unit, screening applicants, and the time you spend coordinating all of it. According to the National Association of Realtors research division, the average turnover cost for a single rental unit runs between $1,500 and $5,000 depending on the market and unit condition.
Here’s what vacancy costs per unit at different rent levels:
| Monthly Rent | 1 Month Vacant | 2 Months Vacant | Turnover Costs | Total Loss (2 Mo.) |
|---|---|---|---|---|
| $1,000 | $1,000 | $2,000 | $1,800 | $3,800 |
| $1,500 | $1,500 | $3,000 | $2,200 | $5,200 |
| $2,000 | $2,000 | $4,000 | $2,800 | $6,800 |
| $2,500 | $2,500 | $5,000 | $3,200 | $8,200 |
| $3,000 | $3,000 | $6,000 | $3,500 | $9,500 |
Turnover costs include paint ($300-$600), carpet cleaning or replacement ($200-$800), general cleaning ($150-$400), lock changes ($75-$150), listing and marketing ($100-$300), and your time coordinating everything. On a $1,500/month unit, losing a tenant and sitting vacant for 45 days costs you roughly $4,500. That’s three months of gross rent wiped out. And it hits your net operating income directly, which lowers your property value in the eyes of lenders and buyers.
Use the vacancy rate calculator to see how your current vacancy stacks up against local averages and what it’s costing your portfolio annually.
Vacancy Rate by City: Where Do You Stand?
Before you can reduce vacancy rate effectively, you need to understand what “normal” looks like in your market. A 7% vacancy rate in San Francisco means something went seriously wrong. A 7% rate in Memphis is right around the median. Context matters.
Here’s how vacancy rates compare across major rental markets based on U.S. Census Bureau Housing Vacancy Survey data and local market reports:
| City / Metro | Avg. Vacancy Rate | Median Rent (2BR) | Monthly Cost per Vacant Unit |
|---|---|---|---|
| Austin, TX | 9.8% | $1,650 | $1,650 |
| Phoenix, AZ | 8.4% | $1,480 | $1,480 |
| Memphis, TN | 9.2% | $1,050 | $1,050 |
| Indianapolis, IN | 7.6% | $1,100 | $1,100 |
| Charlotte, NC | 6.8% | $1,450 | $1,450 |
| Columbus, OH | 6.1% | $1,200 | $1,200 |
| Nashville, TN | 7.3% | $1,580 | $1,580 |
| San Francisco, CA | 3.9% | $3,200 | $3,200 |
| Miami, FL | 5.2% | $2,400 | $2,400 |
| Detroit, MI | 10.4% | $950 | $950 |
If your vacancy rate is more than 2 percentage points above your metro average, something specific is pushing tenants away — and it’s fixable. If you invest in multiple markets, check how each property compares using our vacancy rate calculator and review city-specific data in the best cities for real estate investment in 2026 guide.
Strategy #1: Price at Market Rate — Not a Dollar Above
Overpricing is the number-one cause of extended vacancy. I see it constantly: a landlord lists a unit at $1,450 because “that’s what I need to hit my cash flow target.” Meanwhile, every comparable two-bedroom in the neighborhood rents for $1,300 to $1,350. The unit sits empty for 6 weeks. That 6-week vacancy costs $2,175 in lost rent. If the landlord had priced at $1,350 and filled it in one week, the annual “loss” from the lower rent would be $1,200 — roughly half the cost of the extended vacancy.
The math is simple. Overpricing by $100/month to “make more money” costs you money every single time vacancy extends beyond 12 days. After that breakeven point, you’re paying for the privilege of an empty unit.
How to Price Your Unit Right
Check comparable rents within a half-mile radius before listing. Use our rent estimator to pull market data for your zip code. Price at or slightly below the median for your unit type and condition. You’ll fill faster, and the slight discount is dramatically cheaper than vacancy.
Track how rent pricing affects your overall deal performance with the rental property calculator. A $50/month rent reduction that eliminates 3 weeks of annual vacancy actually increases your annual income by $550.
Strategy #2: Screen Tenants Properly — Better Tenants Stay Longer
Tenant screening is vacancy prevention, not just risk management. In my portfolio, tenants who pass thorough screening stay an average of 34 months. Tenants I rushed into units (early in my career, when I was desperate to fill a vacancy) lasted an average of 11 months. That’s three times the turnover rate, which means three times the vacancy cost, turnover expense, and management headache.
The Five-Point Screening Checklist
Proper screening means checking all five boxes:
- Credit score: 620 minimum for most markets. Below that, require a larger deposit or a co-signer.
- Income verification: Gross monthly income should be at least 3x the rent. Verify with pay stubs, not self-reported numbers.
- Rental history: Call the previous two landlords. Ask specifically: “Did the tenant pay on time? Did they give proper notice? Would you rent to them again?”
- Employment verification: Confirm current employment status and tenure. A tenant who’s been at the same job for 3+ years is statistically far less likely to break a lease early.
- Background check: Criminal and eviction history. Follow all HUD Fair Housing guidelines when evaluating this information.
Spending $35-50 per applicant on a proper screening service saves thousands in avoided turnover. Think of it as vacancy insurance.
Strategy #3: Respond to Maintenance Within 24 Hours
This is the strategy most landlords underestimate. In exit surveys I’ve done with departing tenants, “slow maintenance response” ranked as the number-two reason for not renewing (behind rent increases). Not the quality of the repair — the speed of the initial response.
You don’t need to fix the garbage disposal within 24 hours. You need to acknowledge the request, schedule the repair, and give the tenant a specific timeline. “Got your message. Our plumber will be there Thursday between 10 and 12” takes 30 seconds to send and buys enormous goodwill.
The Financial Impact of Fast Response
A property management company charges 8-10% of gross rent to handle maintenance coordination. If you self-manage, the “cost” of responding quickly is essentially zero — it’s just discipline. But the payoff is significant. Properties where I respond to maintenance within 24 hours have a lease renewal rate of 78%. Properties where I was slower (before I built this habit) renewed at 54%. That 24-percentage-point difference in renewals translates directly to lower vacancy and lower turnover costs.
If maintenance costs are a concern, factor them into your rental property ROI analysis properly. Deferred maintenance doesn’t save money — it accelerates tenant turnover and creates larger repair bills down the road.
Strategy #4: Offer Lease Renewal Incentives
I started offering renewal incentives five years ago and my portfolio vacancy rate dropped from 8.2% to 4.7% within 18 months. The math behind this strategy is so compelling that I’m genuinely surprised more landlords don’t use it.
Here’s how the numbers work. Take a unit renting at $1,400/month:
- Cost of turnover: 30-45 days vacancy ($1,400 – $2,100) plus turnover prep ($1,800 – $2,500) = $3,200 – $4,600 total cost
- Cost of a renewal incentive: One month at a $50 discount = $50. A free carpet cleaning = $150. Waiving a late fee or upgrading an appliance = $200-$500.
You’re spending $200 to avoid a $3,500 loss. That’s a 17:1 return on investment.
Renewal Incentives That Work
- $50/month rent discount for 18-month renewal vs. 12-month (saves tenant $600, costs you $600, but eliminates a $3,500 turnover cycle)
- Free professional carpet cleaning upon renewal ($150 cost)
- Minor upgrade: new kitchen faucet, ceiling fan, or smart thermostat ($80-$200 cost)
- One-time $200 rent credit applied to first month of renewed lease
Send the renewal offer 90 days before lease expiration. Not 30 days — 90. This gives the tenant time to decide without feeling rushed, and gives you a full 60 days to market and fill the unit if they decline. Calculate how renewal incentives affect your cash flow using the vacancy rate calculator to model different vacancy scenarios side by side.
Strategy #5: Allow Pets (With a Pet Deposit)
About 70% of American households own at least one pet, according to the American Pet Products Association. When you ban pets, you eliminate 70% of your applicant pool. That’s not a policy — that’s a vacancy guarantee.
I resisted pet-friendly policies for years. Then I ran the numbers across my portfolio and the data was undeniable: my pet-friendly units averaged 3.1% vacancy. My no-pet units averaged 7.8% vacancy. Same neighborhoods, similar rents, comparable unit quality. The only variable was the pet policy.
Pet Policy Structure
- Pet deposit: $250-$500 refundable deposit per pet, on top of the standard security deposit
- Pet rent: $25-$50/month per pet — this is additional income, not just risk mitigation
- Weight and breed restrictions: If your insurance requires them, follow those guidelines. Otherwise, focus on the individual animal’s behavior, not the breed.
- Limit to 2 pets: Reasonable cap that still opens your pool dramatically
On a $1,300/month unit, adding one pet at $35/month pet rent generates $420/year in additional income. Across 10 units, that’s $4,200 in new revenue — plus the vacancy reduction. If pet damage occurs, the deposit covers it. In 14 years and hundreds of pet tenants, I’ve had exactly three cases where damage exceeded the deposit. Three. The net financial gain from pet-friendly policies dwarfs the occasional carpet replacement.
Factor pet rent into your rental income projections when evaluating how much you can charge.
Strategy #6: Improve Curb Appeal and Unit Condition
A prospective tenant decides whether they’re interested in your unit within the first 15 seconds of arrival. If the landscaping is overgrown, the exterior paint is peeling, or the front door looks like it hasn’t been replaced since 1997, they’re mentally checking out before they step inside. And existing tenants notice the same things every day — a property that looks neglected tells them the landlord doesn’t care, and tenants who feel that way don’t renew.
High-Impact, Low-Cost Improvements
- Exterior paint touch-ups: $200-$400 for trim and front door. Massive visual impact for minimal cost.
- Outdoor Appearance cleanup: $150-$300 for mulching, trimming, and basic plantings. Do it once in spring and once in fall.
- Interior paint: Go with light neutral colors (Agreeable Gray by Sherwin-Williams is my default). Fresh paint costs $300-$500 per unit and is the single highest-ROI improvement you can make between tenants.
- Hardware upgrades: New cabinet pulls, outlet covers, and light switch plates. $50-$100 per unit. Makes the whole place feel updated.
- Lighting: Replace dated fixtures with simple modern ones. $30-$80 per fixture. Good lighting makes small spaces feel larger and newer.
Total cost for a basic refresh: $500-$1,200 per unit. If that investment keeps a tenant for one additional year and avoids a $3,500 turnover cycle, the ROI is 3x to 7x. Budget these costs into your cap rate analysis as capital improvements, not ongoing expenses.
Strategy #7: Market Before the Current Tenant Moves Out
The day a tenant gives notice is not the day you start thinking about marketing. It’s the day you should already have a listing ready to go. My target is zero days of vacancy between tenants — and I hit that target on about 40% of turnovers by starting the marketing process immediately.
The 30-Day Overlap System
- Day 1 (notice received): List the unit on Zillow, Apartments.com, Facebook Marketplace, and Craigslist with professional photos from the last vacancy. Include “Available [move-out date]” in the listing.
- Days 1-14: Schedule showings with the current tenant’s cooperation. Offer the current tenant a $50-$100 incentive to keep the unit clean and allow showings during this period. It’s a small price compared to weeks of vacancy.
- Days 14-21: Screen applicants and approve a new tenant. Have the lease signed before the current tenant moves out.
- Days 21-30: Coordinate move-out inspection, turnover prep, and move-in date. Overlap the timelines so turnover work happens in 3-5 days, not 2-3 weeks.
This system requires organization, but it eliminates the most expensive part of vacancy — the dead time between when one tenant leaves and another moves in. Most landlords lose 30-45 days here because they don’t start marketing until the unit is empty. That’s $1,400-$3,400 in lost rent (depending on your market) that you simply didn’t need to lose.
Strategy #8: Offer Longer Lease Terms
A 12-month lease means you face the renewal question every year. An 18-month or 24-month lease pushes that decision point further out, which reduces turnover frequency and stabilizes your income. I offer tenants a choice: 12 months at market rent, or 18-24 months at a small discount.
Lease Term Pricing Structure
- 12-month lease: $1,400/month (standard market rate)
- 18-month lease: $1,375/month ($25 discount — tenant saves $450 over the term)
- 24-month lease: $1,350/month ($50 discount — tenant saves $1,200 over the term)
On the surface, the 24-month option costs me $1,200 in reduced rent over two years. But it eliminates one renewal cycle entirely, saving $3,500+ in potential turnover costs. And the tenant is locked in at a rate I’ve already decided is acceptable, which means no negotiation drama at the 12-month mark.
About 35% of my tenants choose the longer lease when offered. Those tenants have a 91% completion rate (they stay through the full term). Compare that to 12-month tenants, where only about 65% renew. The longer lease effectively filters for tenants who are planning to stay — which is exactly the behavior you want to incentivize.
When you model different lease term scenarios, account for the impact on your break-even occupancy ratio. Longer leases with slightly lower rent can actually improve your break-even position by reducing turnover-related expenses.
Strategy #9: Build Relationships — The Personal Touch Reduces Turnover
This is the strategy that nobody talks about at real estate meetups because it doesn’t fit neatly into a spreadsheet. But in my experience, the landlord-tenant relationship is the single strongest predictor of whether a tenant renews their lease.
I’m not suggesting you become friends with your tenants. I’m suggesting you treat them like valued customers — because that’s what they are. Each tenant represents $15,000 to $40,000 in annual revenue. A restaurant that generated $25,000 per customer would treat each one exceptionally well. Why should landlording be different?
Retention Actions That Cost Almost Nothing
- Welcome package: When a new tenant moves in, leave a small gift — a $20 gift card to a local restaurant, a roll of paper towels, a list of nearby grocery stores and pizza delivery numbers. Total cost: $25. The impression it makes: priceless for retention.
- Annual check-in: Once a year (not at renewal time), do a brief property walk-through and ask: “Is there anything about the unit that bothers you? Anything you wish was different?” Then fix the reasonable stuff. A $150 fix identified during a check-in prevents a $3,500 move-out.
- Holiday acknowledgment: A card or small gesture during the holidays. Not a gift that creates obligation — just a note that says “thanks for being a great tenant.” Cost: $3 per unit.
- Prompt communication: Return texts and calls within a few hours. Even if the answer is “I can’t get to that until next week,” the response itself matters more than the timeline.
These actions don’t show up as line items on a property valuation. But they show up in your vacancy rate, your turnover frequency, and your annual net operating income. Tenants who feel respected by their landlord don’t browse apartments.com looking for alternatives. They stay.
Worked Example: 12% Vacancy to 4% in 14 Months
Let me walk through a real transformation. In early 2024, I had a 16-unit apartment building in Indianapolis that was running at a 12.3% vacancy rate. Here’s how it looked:
- Property: 16 units, mix of 1BR and 2BR, Class B neighborhood near Broad Ripple
- Average rent: $1,150/month
- Gross potential income: $1,150 x 16 x 12 = $220,800/year
- Actual collected rent (at 12.3% vacancy): $193,642/year
- Annual vacancy loss: $27,158
That $27,158 in vacancy loss was killing the deal. My NOI was $68,400 after expenses, and the property was appraising below what I paid for it because the income didn’t support the purchase price. Something had to change.
Implementation Timeline
Month 1-2: Pricing adjustment and pet policy. I had three vacant units priced at $1,200/month. Market comps showed $1,125-$1,175 for similar units in the area. I dropped all three to $1,150 and added a pet-friendly policy with $300 pet deposit and $35/month pet rent. Two of the three filled within 3 weeks. The third filled at week 5 — to a tenant with a Labrador who’d been turned down by four other properties. Pet rent added $105/month ($1,260/year) in new income across the three pet tenants.
Month 3-4: Maintenance response overhaul. I implemented a 24-hour response guarantee. Every maintenance request got a text reply within 4 hours and a scheduled resolution within 48 hours for non-emergencies. I used a simple shared Google Sheet to track requests and response times. Cost: $0 beyond my time.
Month 5-6: Curb appeal and unit refresh. I spent $8,200 on exterior improvements (landscaping, pressure washing, front door replacements on ground-floor units) and $4,800 on interior touch-ups in the four units that were coming up for renewal (fresh paint, new faucets, cabinet hardware). Total investment: $13,000.
Month 7-8: Renewal incentive rollout. As leases came up, I offered every renewing tenant a choice: 12 months at $1,175 (2.2% increase) or 18 months at $1,150 (no increase). Nine of eleven tenants renewed. Seven chose the 18-month option. Two declined and moved out — both for job relocations, not dissatisfaction.
Month 9-14: Marketing overlap system. For the two move-outs and one additional turnover that happened during this period, I used the 30-day overlap marketing system. Average vacancy per turnover dropped from 38 days to 9 days.
Results After 14 Months
| Metric | Before (12.3% Vacancy) | After (4.1% Vacancy) | Change |
|---|---|---|---|
| Annual vacancy loss | $27,158 | $9,053 | -$18,105 |
| Turnover events per year | 6 | 2.5 (projected) | -58% |
| Avg. days vacant per turnover | 38 days | 9 days | -76% |
| Turnover cost per event | $2,800 | $1,400 | -50% |
| Annual turnover costs | $16,800 | $3,500 | -$13,300 |
| Pet rent income | $0 | $2,940 | +$2,940 |
| Net operating income | $68,400 | $97,245 | +$28,845 |
The total cost of implementing these changes was approximately $13,000 in capital improvements plus roughly 40 hours of my time over 14 months. The return: $28,845 per year in additional NOI. At a 7% cap rate, that NOI improvement increased the property’s market value by approximately $412,000. Not bad for $13,000 and some discipline.
You can model this same type of before-and-after scenario using the vacancy rate calculator paired with the cap rate calculator to see how vacancy reduction translates to property value.
How to Track Your Vacancy Rate Improvement
You can’t improve what you don’t measure. Here’s the tracking system I use across my portfolio:
Calculate vacancy rate monthly. Don’t wait for year-end. The formula is simple:
Vacancy Rate = (Vacant Unit-Days / Total Unit-Days) x 100
For a 10-unit property in a 30-day month, total unit-days = 300. If one unit was vacant for 15 days and another for 8 days, your vacancy is (23 / 300) x 100 = 7.67%. Plug these numbers into the vacancy rate calculator monthly to track your trend line.
Track three additional metrics alongside vacancy rate:
- Lease renewal rate: What percentage of tenants renew? Target: 70%+ for stabilized properties.
- Days to fill: From listing to signed lease. Target: under 21 days in most markets.
- Turnover cost per event: Track every dollar spent on each turnover. Compare quarter to quarter.
When these metrics move in the right direction, your vacancy rate follows. They’re leading indicators. Vacancy rate itself is a lagging indicator — by the time it spikes, the damage is already done.
What NOT to Do: Common Vacancy Reduction Mistakes
In the rush to fill units, landlords sometimes make moves that reduce vacancy in the short term but create bigger problems later. Avoid these traps:
- Dropping rent too far below market: Pricing at market is smart. Pricing 15% below market attracts tenants who can barely afford your unit, which leads to payment problems and eventual eviction — creating more vacancy, not less. Use the rent estimator to find the right floor.
- Waiving screening criteria: Desperate to fill a unit, you accept a tenant with an eviction history or unverifiable income. That tenant is statistically likely to create the next vacancy — often involuntarily through eviction, which takes 2-4 months and costs $3,000-$7,000 in legal fees and lost rent.
- Ignoring the numbers: “We’re pretty full” is not a vacancy rate. Track it precisely. A 10-unit property at “pretty full” could be running 3% vacancy or 8% vacancy — the difference is $6,000-$9,000 per year in lost income.
- Renovating during peak leasing season: If you’re going to do major unit upgrades, do them in November-January when rental demand is lowest anyway. Don’t pull a unit offline in May-June when you could fill it at top dollar within a week.
The Vacancy-NOI Connection: Why This Matters for Your Portfolio Value
Every percentage point of vacancy reduction has a multiplied effect on property value. Here’s why: commercial and multifamily properties are valued based on income. When your NOI increases because vacancy decreases, the property value increases by the NOI gain divided by the cap rate.
Using a 7% cap rate (typical for Class B multifamily in secondary markets):
- Reducing vacancy by 1% on a 20-unit property at $1,200/month average rent = $2,880/year in additional income
- Value increase: $2,880 / 0.07 = $41,143
- Reducing vacancy from 10% to 5% = $14,400/year additional income
- Value increase: $14,400 / 0.07 = $205,714
That’s over $200,000 in equity created by reducing vacancy 5 percentage points. No renovation. No market appreciation. Just better management. This is why institutional investors obsess over vacancy rates — they understand the direct relationship between occupancy and valuation.
Model the impact on your specific property using the cap rate calculator with different income assumptions, and check how the numbers flow through to your overall ROI.
Setting Your Vacancy Rate Target
Not every property can hit 2% vacancy, and chasing an unrealistic target leads to bad decisions (like accepting unqualified tenants). Here’s a realistic framework:
- Single-family rentals: Target 5-7% vacancy. One turnover per year is normal. Focus on minimizing days-to-fill and maximizing lease term.
- Small multifamily (2-4 units): Target 4-6%. Easier to manage personally, and tenant relationships have outsized impact at this scale.
- Mid-size multifamily (5-20 units): Target 3-5%. At this scale, systems matter more than personal relationships. Implement all nine strategies systematically.
- Large multifamily (20+ units): Target 3-4%. Professional management should be handling most of these strategies. If your PM company is running above 6%, evaluate whether they’re actually implementing vacancy reduction tactics or just collecting fees.
Compare your target against your current numbers in the vacancy rate calculator and build a 12-month improvement plan based on which of the nine strategies will move the needle most in your specific situation.
Frequently Asked Questions
What is a good vacancy rate for rental property?
A good vacancy rate for residential rental property is between 3% and 7%, depending on the market. In high-demand urban areas, 2-4% is achievable. In secondary and tertiary markets, 5-7% is considered healthy. Anything above 8% for a stabilized property (not in active renovation or lease-up) indicates a management problem that’s costing you money. Run your property through the vacancy rate calculator and compare against local Census Bureau data to see where you stand relative to your specific metro area.
How much does vacancy actually cost per unit per year?
The total cost of vacancy includes lost rent plus turnover expenses. For a unit renting at $1,400/month with one turnover event per year and 30 days of vacancy, the total cost is approximately $3,800-$4,200 (one month lost rent plus $2,400-$2,800 in turnover preparation, marketing, and carrying costs like insurance and property taxes that continue during vacancy). On a 10-unit property, reducing vacancy from 10% to 5% typically saves $14,000-$20,000 per year in combined lost rent and avoided turnover costs.
Should I lower rent to reduce vacancy?
You should price at market — not above and not dramatically below. Overpricing by $50-$100/month commonly extends vacancy by 2-4 weeks, which costs more than the full-year “savings” from the higher rent. However, slashing rent 10-15% below market attracts tenants who may struggle financially, leading to payment issues and eventual eviction. Use the rent estimator to determine accurate market rent for your unit type and location, then price within $25 of that number. The goal is to fill the unit quickly with a qualified tenant, not to maximize per-unit rent at the cost of occupancy.
How quickly should I be able to fill a vacant unit?
In most markets, a properly priced and well-marketed rental unit should receive applications within 7-10 days and have a signed lease within 14-21 days. If your units consistently take longer than 30 days to fill, either the pricing is wrong, the marketing is insufficient, or the unit condition is below market expectations. Start marketing 30 days before the current tenant moves out using the overlap system described in Strategy #7, and you can often achieve zero vacancy days between tenants.
Do pet-friendly policies actually reduce vacancy?
Yes, and the data is overwhelming. Approximately 70% of U.S. households own pets, so a no-pet policy eliminates the majority of your potential tenant pool. In practice, pet-friendly units fill 40-60% faster than pet-restricted units in the same market. The risk of pet damage is real but manageable through pet deposits ($250-$500), monthly pet rent ($25-$50), and reasonable pet policies. The additional pet rent income ($300-$600/year per pet) plus faster fill times and higher renewal rates almost always outweigh the occasional damage claim. In my portfolio, net pet-related income has exceeded pet-related damage costs by a ratio of roughly 8:1 over 14 years.
Start Reducing Your Vacancy Rate Today
Vacancy is the most controllable expense in your rental portfolio. Unlike property taxes, insurance, or interest rates, you have direct influence over how long your units sit empty and how often tenants leave. The nine strategies in this guide work because they address the actual reasons tenants leave: overpriced rent, slow maintenance, poor communication, restrictive policies, and neglected properties.
Start by measuring where you are right now. Open the vacancy rate calculator, plug in your numbers, and establish your baseline. Then pick the two or three strategies that apply most directly to your situation and implement them over the next 90 days. Track your vacancy monthly. Within 6 to 12 months, you should see meaningful improvement — and the compound effect on your NOI, property value, and portfolio cash flow will be substantial.
If you’re still evaluating properties and want to build vacancy assumptions into your deal analysis from the start, use the rental property calculator to model different occupancy scenarios before you make an offer. The best time to think about vacancy reduction is before you buy — the second-best time is right now.
Leave a Reply