Last updated: September 24, 2026 · Originally published: August 28, 2026 · By Alex Petrov
How much can I rent my house for? The answer depends on five factors: location, property size, condition, comparable rents, and local vacancy rates. A 3-bedroom SFR in Cleveland rents for $1,200–$1,500/month, the same house in Charlotte commands $1,600–$2,000, and in Austin $2,200–$2,800. Getting the price right matters — overprice by 10% and your property sits vacant for 2 months, costing you more than the extra rent would have earned in a year. Here is how to determine the right rental price using data, comps, and free calculators.
5 Factors That Determine How Much You Can Rent Your House For
Before diving into comps and calculations, understand the five factors that answer “how much can I rent my house for” in any market. Each factor can shift your rent 10–25% in either direction.
1. Location and Neighborhood
Location is 60% of your rental price. The same 3-bed/2-bath in different neighborhoods within the same city can rent for 30–50% more or less. Factors that increase rent: proximity to employment centers, good school district, walkability, low crime, public transit access. Factors that decrease rent: highway noise, industrial areas, high crime, poor schools.
Check your specific location’s rental demand using the vacancy rate calculator. Vacancy below 5% means strong demand — you can price at the top of the range. Above 8% means soft demand — price conservatively.
2. Property Size and Layout
Bedrooms are the primary rent driver. Each additional bedroom adds 15–25% to rent in most markets. A 2-bed renting for $1,200 means a comparable 3-bed rents for $1,380–$1,500. Bathrooms add 5–10%. Square footage matters less than bedroom count — tenants search by bedrooms, not square feet.
For multifamily properties, use the multifamily calculator to analyze rent per unit. For single-family, the rental property calculator models total returns at your estimated rent.
3. Property Condition and Amenities
Updated properties command 10–20% premium over dated ones. Key amenities that increase rent: in-unit washer/dryer (+$50–$100/month), central air (+$50–$75), updated kitchen (+$75–$150), garage (+$75–$125), fenced yard (+$50–$100). A $5,000 kitchen update that adds $100/month to rent pays for itself in 50 months — well within a typical hold period.
4. Comparable Rents (Comps)
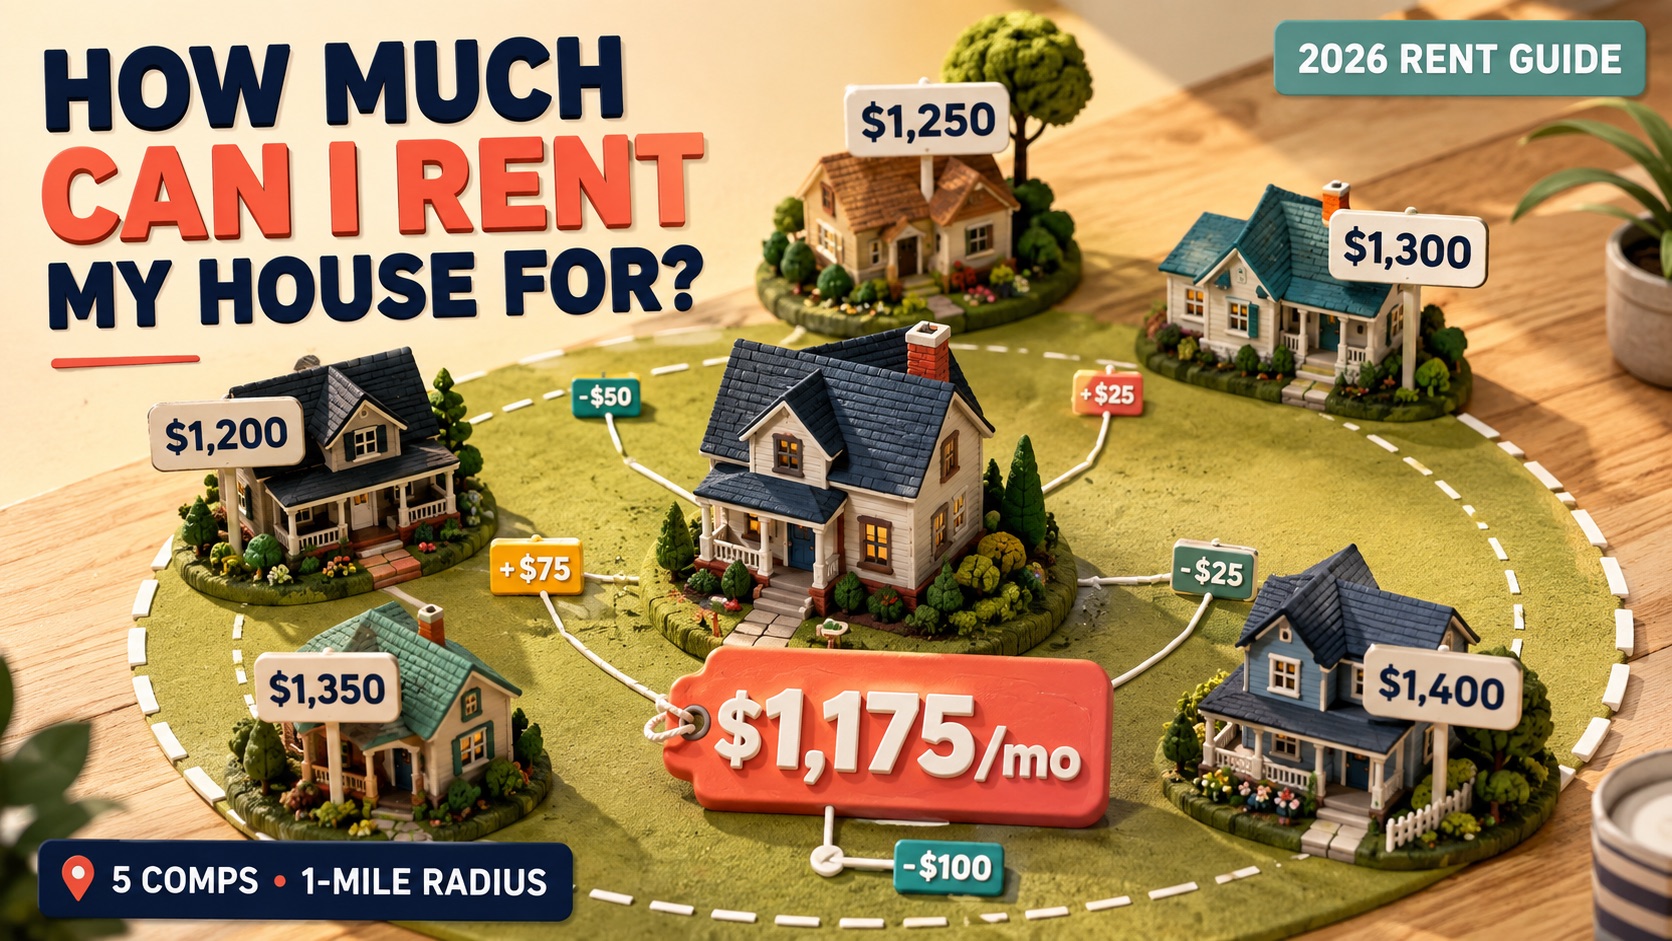
Comparable rents are the most reliable way to answer “how much can I rent my house for.” Pull 5–10 rental listings within 1 mile of your property with similar bedrooms, bathrooms, and condition. Adjust for differences:
- Your property has 1 fewer bathroom: subtract 5–8%
- Your property has a garage, comps don’t: add $75–$125
- Your property is dated, comps are updated: subtract 10–15%
- Your property has a larger lot: add $25–$50 (minimal impact)
Sources for rental comps: Zillow Rentals, Realtor.com, Rentometer, Craigslist, Facebook Marketplace. Look at active listings (what landlords are asking) and recently rented (what tenants actually paid). Recently rented comps are more accurate — active listings may be overpriced.
5. Local Market Conditions
Supply and demand shift rental prices seasonally and cyclically. Summer (May–August) is peak rental season in most US markets — you can price 5–10% higher. Winter (November–February) is slow — expect to price at or below average to fill quickly. Per the US Census Bureau Housing Vacancy Survey, the national rental vacancy rate was 6.6% in Q2 2026 — the lowest in over a decade, favoring landlords.
How to Estimate Rent: Step-by-Step Method
Answering “how much can I rent my house for” requires a systematic approach. Gut feelings and Zillow estimates are not enough — you need comp-based analysis adjusted for your property’s specifics.
Step 1: Find 5–10 Comps
Search Zillow, Realtor.com, or Rentometer for rentals within 1 mile of your property. Filter by same bedroom count (±1), same property type (SFR vs condo vs townhouse). Note each comp’s asking rent, bedrooms, bathrooms, square footage, and condition (from photos).
Step 2: Adjust for Differences
Calculate the average rent of your comps, then adjust up or down based on your property’s advantages and disadvantages. A comp at $1,500 with a 2-car garage when your property has no garage means subtracting $100 from your estimate. Five comps averaging $1,450 with adjustments of -$75 for your property’s condition = $1,375 estimated rent.
Step 3: Apply the 1% Rule as a Sanity Check
The 1% rule says monthly rent should be approximately 1% of the property’s value. A $200K property should rent for ~$2,000/month. This is a rough screening tool, not a pricing method. In 2026, very few markets hit 1% — the national average is closer to 0.6–0.7%. Markets like Cleveland and Indianapolis still approach 0.8–0.9%. Use this to flag obvious mispricing, not to set your rent.
Step 4: Check Rent-to-Income Ratio
Tenants typically qualify at rent = 30% of gross income. If your target rent is $1,500/month, your tenant needs $5,000/month ($60K/year) gross income. In a market where median household income is $45K, a $1,500 rent limits your tenant pool. Check the median income in your target area to ensure your rent is achievable. The rent projection calculator models rent growth over time based on local data.
Step 5: Run Cash Flow at Your Estimated Rent
Enter your estimated rent into the cash flow calculator along with all expenses (mortgage, taxes, insurance, maintenance, vacancy, management). If cash flow is negative at market rent, the problem is not your rent estimate — it is the deal economics. Do not inflate rent to make a bad deal look good.
Rent Estimates by Market: What Investors Actually Charge in 2026
Based on data from Zillow, Rentometer, and HUD Fair Market Rents, here are typical rents for a 3-bed/2-bath SFR in the most popular investment markets:
| Market | Median Rent (3BR) | Rent/Price Ratio | Vacancy | Trend |
|---|---|---|---|---|
| Cleveland, OH | $1,250 | 0.83% | 5.2% | Stable (+2%) |
| Indianapolis, IN | $1,450 | 0.78% | 4.8% | Rising (+4%) |
| Augusta, GA | $1,300 | 0.81% | 5.5% | Stable (+1%) |
| Greensboro, NC | $1,350 | 0.68% | 6.1% | Stable (+2%) |
| Charlotte, NC | $1,800 | 0.51% | 5.8% | Declining (-1%) |
| Columbus, OH | $1,400 | 0.74% | 4.5% | Rising (+3%) |
| Memphis, TN | $1,200 | 0.80% | 7.2% | Stable |
| Houston, TX | $1,600 | 0.62% | 8.1% | Softening |
| Tampa, FL | $2,100 | 0.53% | 7.5% | Softening |
| Austin, TX | $2,400 | 0.49% | 9.3% | Declining (-5%) |
The pattern: markets under $160K with rent-to-price ratios above 0.75% (Cleveland, Indianapolis, Augusta, Memphis) are cash flow plays. Markets above $250K with ratios below 0.55% (Charlotte, Tampa, Austin) are appreciation plays where rents do not cover expenses at current mortgage rates.
Austin rents are declining 5% year-over-year as new supply floods the market — a reminder that the answer to “how much can I rent my house for” changes constantly. In Q2 2026, 8 of the top 50 US metros saw rent declines, while 32 saw increases of 1–4%. The Midwest and Southeast remain the strongest rental markets for cash flow investors, while overbuilt Sun Belt cities (Austin, Phoenix, Jacksonville) are correcting.
Check rent trends before committing. Per Apartment List, national rent growth has slowed to 1.2% annually, down from 15%+ in 2021–2022.
For state-specific analysis: Ohio, Georgia, North Carolina, Texas, Florida calculators.
Worked Example: How Much Can I Rent My House For in Cleveland?
Property: 3-bed/1.5-bath SFR, 1,400 sqft, Cleveland Heights. Updated kitchen, original bathroom, no garage, fenced yard. Purchased for $145K.
Comps pulled (1-mile radius, Zillow Rentals):
| Comp | Rent | Bed/Bath | Notes |
|---|---|---|---|
| 123 Oak St | $1,350 | 3/2 | Updated, garage |
| 456 Elm Ave | $1,200 | 3/1 | Dated, no garage |
| 789 Pine Rd | $1,300 | 3/1.5 | Updated, no garage |
| 321 Maple Dr | $1,400 | 3/2 | Renovated, garage |
| 654 Cedar Ln | $1,250 | 3/1 | Average, fenced yard |
Average comp rent: $1,300
Adjustments for your property:
 + Updated kitchen: +$0 (matches most comps)
 − Original bathroom (comps 1,4 have 2 full baths): −$50
 − No garage (comps 1,4 have garage): −$75
 + Fenced yard (matches comp 5): +$0

Estimated rent: $1,300 − $50 − $75 = $1,175/month

1% rule check: $145,000 × 1% = $1,450 (your estimate is below — realistic)
Rent/price ratio: $1,175 / $145,000 = 0.81% (good for cash flow)
Result: $1,175/month. Enter this into the cash flow calculator with your actual mortgage, taxes ($175/month in Cuyahoga County), insurance ($175/month), and management (10%) to see if the deal cash flows. At 6.7% rate with 25% down, monthly P&I is $700. Cash flow after all expenses: approximately +$50/month — thin but positive.
For the full investment analysis including ROI, equity buildup, and tax benefits, use the ROI calculator. Knowing how much you can rent your house for is just step one — the real question is whether the rent produces acceptable returns after all expenses.
5 Mistakes When Estimating How Much You Can Rent Your House For
1. Using Zillow “Zestimate Rent” Without Verification
Zillow’s rent estimate is algorithmic and often 5–15% off in either direction. It does not account for your property’s specific condition, updates, or micro-location. Always verify against actual comps — active listings and recently rented properties in your immediate area.
2. Pricing Based on Your Mortgage Payment
Your mortgage is irrelevant to what tenants will pay. If your P&I is $1,400 but comps show $1,200, the market does not care about your financing. Setting rent to “cover the mortgage” leads to overpricing, vacancies, and worse total returns than pricing at market rate.
3. Ignoring Seasonal Timing
Listing a rental in December in Cleveland will get 30–40% fewer inquiries than listing in June. If your property is ready in winter, consider pricing 5% below market to fill quickly — a month of vacancy at $1,200 costs $1,200, while pricing $60 below market for a year costs only $720.
4. Not Factoring Vacancy Into Cash Flow
Even in strong markets, budget 5–8% vacancy. A $1,400/month rent with 7% vacancy = $1,302 effective rent. Most new landlords calculate cash flow at full occupancy — then are shocked by the first turnover. The cash flow calculator includes vacancy as an input.
5. Overvaluing Amenities Tenants Don’t Pay For
A $20,000 landscaping job does not add $200/month to rent. Pool maintenance costs $100–$200/month but adds only $50–$100 to rent (net negative). Focus upgrades on what tenants value: functional kitchen, reliable HVAC, in-unit laundry, and safe neighborhood. Everything else is owner vanity.
Frequently Asked Questions
How much can I rent my house for in 2026?
Rental prices vary dramatically by market. A 3-bed SFR in Cleveland rents for $1,200–$1,500/month, in Indianapolis $1,300–$1,600, in Charlotte $1,600–$2,000, and in Austin $2,200–$2,800. The best way to estimate your specific property is to pull 5–10 rental comps within 1 mile with similar bedrooms and condition, average them, and adjust for your property’s specific features. Use the rent projection calculator to model rent growth over your planned hold period.
What is the 1% rule for rental properties?
How do I find rental comps for my property?
Should I price my rental above or below market rate?
What is a good rent-to-price ratio for investment property?
Related Calculators and Guides
- Rent Projection Calculator — Forecast rental income over time
- Cash Flow Calculator — Monthly cash flow at your estimated rent
- Rental Property Calculator — Full investment analysis
- Vacancy Rate Calculator — Measure and reduce vacancy
- Cap Rate Calculator — Property return rate
- ROI Calculator — Total return over hold period
- Multifamily Calculator — Multi-unit rent analysis
- GRM Calculator — Quick property screening
- All 30+ Calculators
Blog guides:
Leave a Reply