
Last updated: September 24, 2026 · Originally published: August 22, 2026 · By Alex Petrov
The property cash flow calculator shows you exactly how much money a rental property puts in your pocket each month — after every expense and the mortgage payment. An Indianapolis duplex at $160K generates $227/month positive cash flow. A Memphis SFR at $180K loses $222/month. Same investor, same down payment, opposite results. Run the numbers before you buy.
What Is Property Cash Flow
Cash flow = Net Operating Income − Debt Service
NOI is rent minus vacancy minus operating expenses (tax, insurance, maintenance, management, CapEx reserves). Debt service is your monthly mortgage payment (P&I). Positive cash flow = the property pays you every month. Negative = you pay the property.
Cash flow is the most practical metric for rental investors — it answers “can I afford to hold this property?” Cap rate and ROI matter for evaluation, but cash flow determines whether you can make the mortgage payment if your W-2 income disappears. Use the property cash flow calculator alongside the cap rate calculator and cash-on-cash calculator for the complete picture.
How to Use the Property Cash Flow Calculator
Step 1 — Income
Monthly rent (all units combined), other income (laundry, parking, storage, pet fees), and vacancy rate. Set vacancy based on your market — 5% for tight markets (Raleigh, Columbus), 8–10% for looser ones (Cleveland, Memphis). The calculator computes Effective Gross Income (EGI).
Step 2 — Operating Expenses
Property tax (annual), insurance (annual), maintenance (budget 8–10% of gross rent), property management (8–10% of collected rent), CapEx reserves (5–8% of gross rent for roof, HVAC, water heater). Do NOT include mortgage here — that is Step 3.
The difference between gross rent and total expenses = NOI. Calculate NOI separately in the NOI calculator if you want to isolate operating performance.
Step 3 — Financing
Purchase price, down payment %, interest rate, loan term. The calculator computes monthly P&I. This is subtracted from NOI to get cash flow.
Step 4 — Read Results
Monthly cash flow, annual cash flow, and cash-on-cash return. The calculator also shows a year-by-year projection: rent growth vs expense growth shows when a marginal deal turns profitable (or when a good deal deteriorates).
Worked Example 1: Indianapolis Duplex — Positive Cash Flow
Property: Duplex in Indianapolis east side
Purchase: $160,000 · Down: 25% ($40,000) · Rate: 7.0%, 30yr
Rent: $900/unit × 2 = $1,800/month
Income
Gross rent: $1,800 × 12 = $21,600
Vacancy (6%): −$1,296
EGI: $20,304
Operating Expenses
| Expense | Annual | Basis |
|---|---|---|
| Property Tax | $1,760 | 1.1% of $160K |
| Insurance | $1,400 | Landlord policy, duplex |
| Maintenance | $1,728 | 8% of gross rent |
| Property Management | $2,030 | 10% of EGI |
| CapEx Reserves | $1,080 | 5% of gross rent |
| Total | $7,998 |
Cash Flow
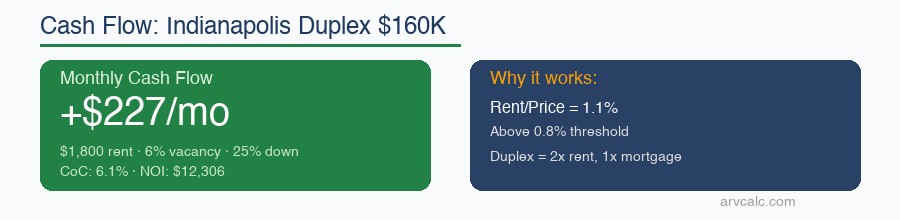
NOI = $20,304 − $7,998 = $12,306
Monthly P&I: $798 ($120K loan at 7%)
Annual debt service: $9,581

Annual cash flow: $12,306 − $9,581 = $2,725
Monthly cash flow: $227

Total cash invested: $40,000 + $4,800 (closing) = $44,800
Cash-on-Cash Return: $2,725 ÷ $44,800 = 6.1%
Result: +$227/month cash flow, 6.1% CoC. This duplex pays for itself and generates income from day one. Indianapolis works because of the rent-to-price ratio: $1,800 rent on $160K = 1.1% monthly ratio. Anything above 0.8% tends to cash-flow positive at current rates.
Run your own numbers in the property cash flow calculator. For state-specific analysis, use the Ohio calculator (Indianapolis is similar market dynamics).
Worked Example 2: Memphis SFR — Negative Cash Flow
Property: 3-bed/2-bath SFR in Memphis suburbs
Purchase: $180,000 · Down: 25% ($45,000) · Rate: 7.0%, 30yr
Rent: $1,400/month
EGI: $15,624 (after 7% vacancy)
Expenses: $8,506 (tax $2,160 + ins $1,600 + maint $1,344 + PM $1,562 + CapEx $840)
NOI: $7,118

Monthly P&I: $898
Annual debt service: $10,778

Annual cash flow: $7,118 − $10,778 = −$3,660
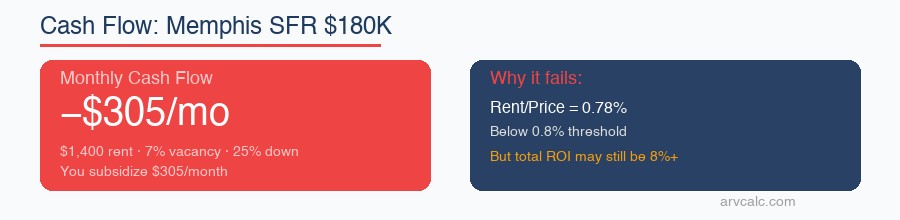
Monthly cash flow: −$305
Result: −$305/month. You subsidize this property $305 every month. At 7% rates with $1,400 rent on $180K, Memphis SFR does not cash-flow. The rent-to-price ratio is 0.78% — below the 0.8% threshold.
But total ROI might still be positive — appreciation + paydown can offset negative cash flow. Run this through the ROI calculator to see the full picture. A property at −$305/month cash flow can still deliver 8–10% annualized total return if appreciation runs 3%+. Read more in ROI calculator guide.
Cash Flow vs Other Metrics
| Metric | What It Measures | Includes Mortgage? | Use For |
|---|---|---|---|
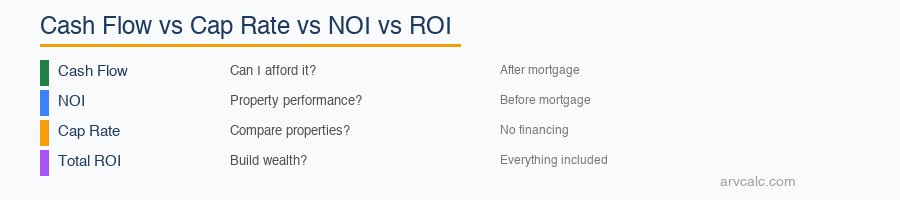
| Cash Flow | Monthly dollars in/out of pocket | Yes | Can I afford this property? |
| NOI | Operating income before debt | No | Property performance independent of financing |
| Cap Rate | NOI ÷ Price (unlevered yield) | No | Comparing properties |
| Cash-on-Cash | Cash flow ÷ cash invested | Yes | Return on your actual dollars |
| Total ROI | CF + appreciation + paydown | Yes | Long-term wealth building |
Cash flow is the survival metric. Cap rate is the comparison metric. ROI is the wealth metric. Use all three: cash flow calculator, cap rate calculator, ROI calculator. For a complete analysis framework, see how to analyze rental property.
The CapEx Trap: Why Cash Flow Projections Fail
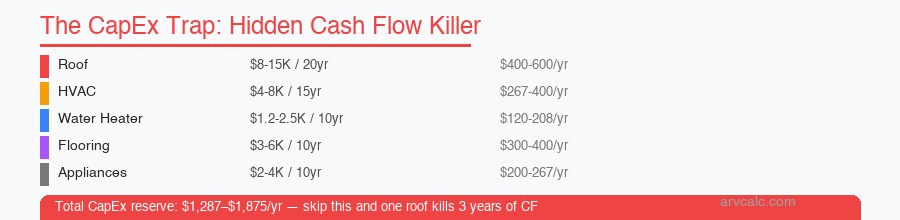
Most cash flow projections include maintenance (8% of rent) but skip CapEx reserves. Then a $12,000 roof replacement in Year 4 wipes out 3 years of cash flow.
| Item | Cost | Lifespan | Annual Reserve |
|---|---|---|---|
| Roof | $8,000–$15,000 | 20–25 years | $400–$600 |
| HVAC | $4,000–$8,000 | 15–20 years | $267–$400 |
| Water Heater | $1,200–$2,500 | 10–12 years | $120–$208 |
| Flooring | $3,000–$6,000 | 10–15 years | $300–$400 |
| Appliances | $2,000–$4,000 | 10–15 years | $200–$267 |
| Total CapEx Reserve | $1,287–$1,875/yr |
Budget 5–8% of gross rent for CapEx on top of 8% maintenance. On a $1,400/month property: $840–$1,344/year CapEx + $1,344 maintenance = $2,184–$2,688 total upkeep. The cash flow calculator has separate fields for maintenance and CapEx. For rehab-specific budgeting, use the rehab cost estimator.
5 Cash Flow Mistakes
1. Skipping CapEx Reserves
Why: $1,200/year difference between “cash flow positive” and “cash flow negative” on a borderline deal. One roof replacement without reserves = emergency.
Fix: Budget 5% minimum of gross rent for CapEx. 8% for properties over 20 years old.
2. Using Listed Rent Instead of Market Rent
Why: Sellers inflate rents. $200/month overestimate = $2,400/year phantom income = fake positive cash flow.
Fix: Verify rent with Zillow, Rentometer, and a local PM. Use the conservative estimate. Per NAR, actual rents average 5–8% below listing estimates.
3. Forgetting Vacancy
Why: 0% vacancy = fantasy. Even the best markets have 4–5%. On $1,800/month rent, 7% vacancy = $1,512/year in lost income.
Fix: Use local vacancy data from FRED rental vacancy. Never use 0%.
4. Not Including Property Management
Why: “I’ll self-manage” is a plan until it isn’t. Even if you self-manage, budget 10% PM fee — it is the replacement cost of your time and protects your cash flow projection from being misleading.
Fix: Always include PM in the cash flow calculator. If you self-manage, the “saved” PM fee is your management income, not free cash flow.
5. Ignoring Expense Growth
Why: Insurance rose 15% in NC over 2 years. Property taxes get reassessed. Rent grows 3% but expenses grow 5% = cash flow shrinks every year.
Fix: Project expenses forward alongside rent. The cash flow calculator’s year-by-year view shows this trajectory. Run pessimistic scenarios in the rent projection calculator.
Frequently Asked Questions
What is a good monthly cash flow for a rental property?
$100–$200/month per unit after all expenses including CapEx reserves. A duplex should target $200–$400/month total. At current 7% rates, many single-family properties in appreciation markets (Charlotte, Raleigh, Austin) produce negative cash flow. Cash-flow-positive deals at current rates typically require rent-to-price ratios above 0.8% monthly.
How is property cash flow different from NOI?
Should I buy a rental property with negative cash flow?
What expenses should I include in cash flow calculations?
How does down payment affect cash flow?
What rent-to-price ratio do I need for positive cash flow?
Related Calculators and Guides
- Property Cash Flow Calculator — Monthly + annual projections
- NOI Calculator — Operating income before debt
- Cap Rate Calculator — Unlevered yield
- Cash-on-Cash Calculator — Return on cash invested
- ROI Calculator — Total return with appreciation
- Rent Projection Calculator — Future income forecasting
- Rental Property Calculator — Full deal analysis
- DSCR Calculator — Loan qualification
- Vacancy Rate Calculator
- Rehab Cost Estimator
- All 30+ Calculators
Blog guides:
Leave a Reply