Published: August 23, 2026 · By Alex Petrov
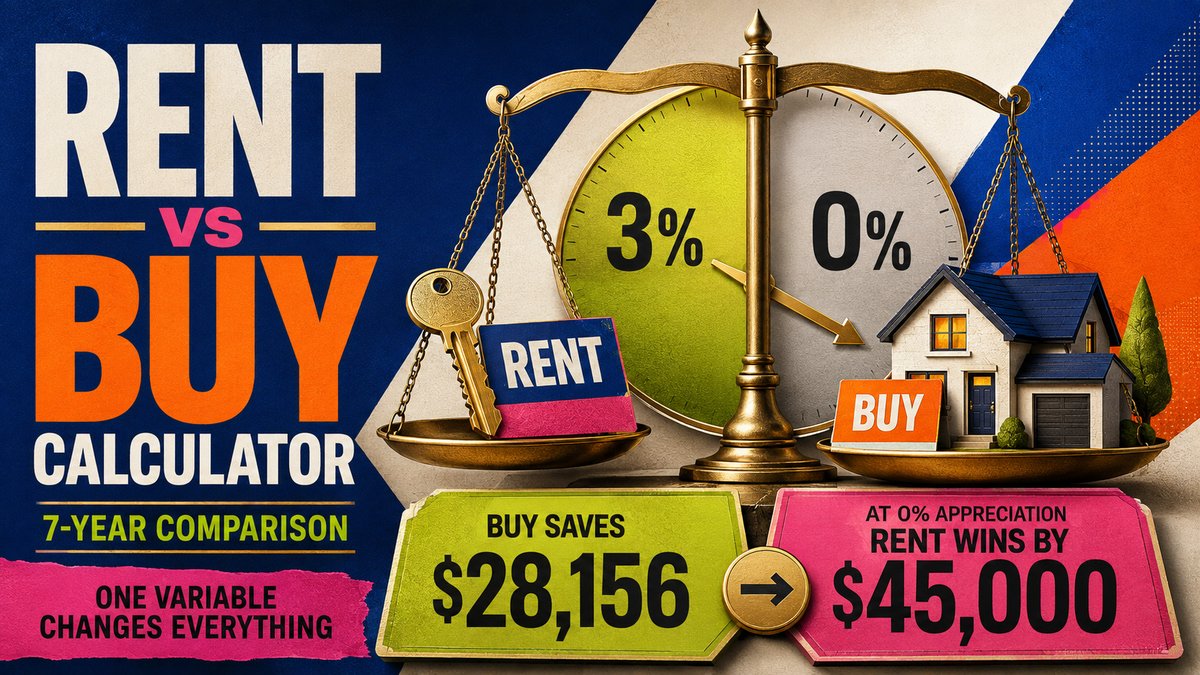
The rent vs buy calculator compares the total cost of renting against buying over 5, 10, or 20 years — accounting for mortgage payments, property tax, maintenance, appreciation, equity buildup, and opportunity cost of your down payment. On a $350K home with 3% appreciation over 7 years, buying saves $25,636 vs renting at $2,000/month. But change one variable — 0% appreciation instead of 3% — and renting wins by $45,000.
Why Rent vs Buy Is Not Obvious
The conventional wisdom says “buying always wins.” But that depends entirely on your assumptions: appreciation rate, how long you stay, mortgage rate, rent growth, and what you would earn investing the down payment elsewhere.
A $70K down payment invested in the S&P 500 at 10% average return grows to $136K in 7 years. That opportunity cost often gets ignored in rent vs buy comparisons. The rent vs buy calculator includes it.
How to Use the Rent vs Buy Calculator
Step 1 — Renting Scenario
Monthly rent, annual rent increase (typically 3–5%), renter’s insurance ($15–$30/month). The calculator projects total rent paid over your chosen time horizon.
Step 2 — Buying Scenario
Purchase price, down payment %, mortgage rate, property tax rate, homeowner’s insurance, maintenance (budget 1% of home value per year), HOA if applicable. The calculator computes monthly PITI and total housing costs.
Step 3 — Assumptions
Home appreciation rate (2–4%), investment return rate for the down payment alternative (7–10% stock market), hold period (5–20 years), closing costs (2–4% buy, 6–8% sell). These assumptions drive the result more than any other input.
Step 4 — Read Comparison
Total cost of renting vs total cost of buying (net of equity). The calculator shows which option wins, by how much, and the breakeven year — the point where buying starts beating renting.
Worked Example: $350K Home vs $2,000/Month Rent — 7 Years
Buying: $350,000 · 20% down ($70,000) · 7.0% rate · 30yr
Renting: $2,000/month · 3% annual increase
Appreciation: 3%/year · Investment return: 8%
Rent Cost (7 years)
Year 1: $2,000/mo × 12 = $24,000
Year 2: $2,060/mo × 12 = $24,720
Year 3: $2,122/mo × 12 = $25,462
...
Year 7: $2,388/mo × 12 = $28,660

Total rent paid: $183,899
Renter's insurance: $2,520
Total renting cost: $186,419
Buy Cost (7 years)
| Cost Component | 7-Year Total |
|---|---|
| Down payment | $70,000 |
| Mortgage payments (P&I) | $156,492 |
| Property tax (1.2%) | $29,400 |
| Insurance | $16,800 |
| Maintenance (1%) | $24,500 |
| Closing costs (buy 3%) | $10,500 |
| Closing costs (sell 6%) | $25,814 |
| Gross buy cost | $333,506 |
| Less: Equity at sale | −$175,243 |
| Net buy cost | $158,263 |
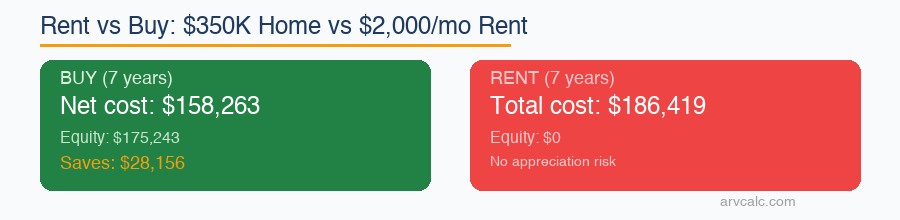
Net buy cost: $158,263
Total rent cost: $186,419

Buying saves: $28,156 over 7 years
Result: buying wins by $28,156. But $120,000+ of that advantage comes from appreciation (3%/year turns $350K into $430K). Without appreciation, renting wins. Run your scenario in the rent vs buy calculator.
Sensitivity: When Renting Wins
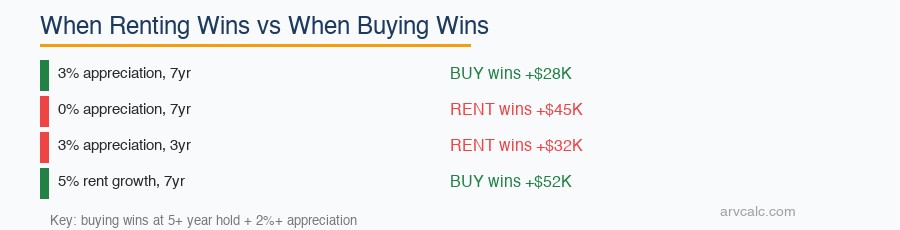
| Scenario | Appreciation | Hold | Winner | Margin |
|---|---|---|---|---|
| Base case | 3% | 7 years | Buy | $28,156 |
| Flat market | 0% | 7 years | Rent | $45,000 |
| Short hold | 3% | 3 years | Rent | $32,000 |
| High rent growth | 3% | 7 years, 5% rent growth | Buy | $52,000 |
| Low rate | 3% | 7 years, 5% mortgage | Buy | $58,000 |
| High rate + flat | 0% | 5 years, 8% mortgage | Rent | $68,000 |
Key insight: buying wins when you hold 5+ years AND appreciation exceeds 2%. Below that, transaction costs (6% sell + 3% buy = 9%) eat the equity. Short holds and flat markets favor renting. The rent vs buy calculator lets you test every scenario.
For mortgage payment comparison, use the mortgage calculator. For investment property analysis (not primary residence), use the rental property calculator. Per FRED median home price data, national appreciation averaged 4.3% over 2015–2025.
The Opportunity Cost Most Calculators Ignore
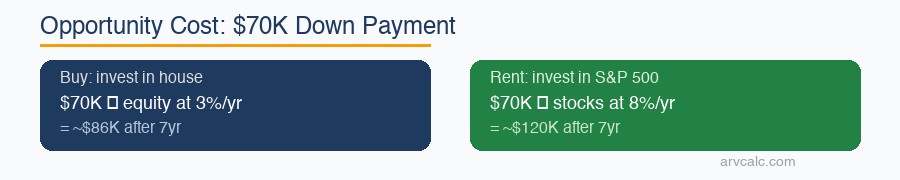
Your $70K down payment is not free money. If you rent instead and invest $70K in an index fund at 8% return:
$70,000 × (1.08)^7 = $119,922

Opportunity cost of buying: $49,922 in missed investment gains
Most rent vs buy calculators skip this. Ours includes it. When you buy, your down payment earns the appreciation rate (3%). When you rent and invest, it earns the stock market rate (8%). The 5% gap on $70K = $3,500/year in lost returns — real money that offsets the “equity building” argument for buying.
Per NAR research, the median homebuyer stays 13 years — long enough for buying to win in most scenarios. But investors and mobile professionals who move every 3–5 years should seriously consider renting.
5 Rent vs Buy Mistakes
1. Ignoring Transaction Costs
Why: Buying costs 3% and selling costs 6% = 9% round-trip. On $350K = $31,500. You need 2–3 years of appreciation just to break even on transaction costs.
Fix: Include buy + sell closing costs. The calculator has fields for both.
2. Assuming Constant Appreciation
Why: Markets cycle. 2006–2011 showed negative appreciation nationally. Using 4% for a 30-year projection is optimistic.
Fix: Run at 0%, 2%, and 4%. If buying only wins at 4%+, you are speculating, not planning.
3. Forgetting Maintenance
Why: Renters pay $0 for a broken furnace. Homeowners pay $5,000. Budget 1% of home value per year for maintenance — $3,500/year on a $350K home.
Fix: Include 1% maintenance. Older homes: 1.5–2%.
4. Comparing Mortgage to Rent Directly
Why: “$1,863 mortgage vs $2,000 rent — buying is cheaper!” Wrong. PITI (with tax $350/mo + insurance $200/mo) = $2,413. Plus maintenance $292/mo. True monthly cost: $2,705 — 35% higher than rent.
Fix: Compare total monthly housing cost, not just P&I. Use the mortgage calculator for PITI.
5. Not Considering Mobility
Why: If you might move in 2–3 years, transaction costs destroy the buy advantage. 3% buy + 6% sell = $31,500 on $350K — that is 16 months of rent.
Fix: Only buy if you plan to stay 5+ years. Under 5 years, renting almost always wins. Read the full rent vs buy guide.
Frequently Asked Questions
Is it better to rent or buy in 2026?
At 7% mortgage rates, buying is more expensive monthly than renting in most markets. But over 7+ years with 3% appreciation, buying wins by $25,000–$50,000 due to equity buildup. Short holds (under 5 years) favor renting. Use the rent vs buy calculator with your specific numbers.
How long do you need to own a home for buying to be worth it?
Does the rent vs buy calculator include opportunity cost?
What appreciation rate should I use?
Is renting throwing money away?
How does mortgage rate affect rent vs buy?
Related Calculators and Guides
- Rent vs Buy Calculator — Compare total cost over time
- Mortgage Calculator — Monthly PITI breakdown
- Rental Property Calculator — Investment property analysis
- Cash Flow Calculator — Monthly projections
- Closing Costs Calculator — Buy + sell costs
- Rent Projection Calculator — Future rent forecasting
- All 30+ Calculators
Blog guides:
Leave a Reply