Last updated: September 24, 2026 · Originally published: August 29, 2026 · By Alex Petrov
The gross rent multiplier by city ranges from 6.5 in Cleveland to 22+ in San Francisco — and that single number tells you more about a market’s investment potential than any listing photo. A GRM of 8 means you pay 8 years of gross rent to buy the property. A GRM of 20 means 20 years. Lower GRM = faster payoff = better cash flow potential. Here is the gross rent multiplier by city for the 20 most popular US investment markets in 2026, what the numbers actually mean, and how to use GRM to compare deals across different cities.
What Is Gross Rent Multiplier and Why It Varies by City
GRM = Property Price ÷ Annual Gross Rent
A $200K property renting for $24,000/year ($2,000/month) has a GRM of 8.3. A $500K property renting for $30,000/year ($2,500/month) has a GRM of 16.7. The lower the GRM, the more rent you collect relative to what you paid.
GRM varies dramatically by city because property prices and rents do not scale proportionally. In Cleveland, a $150K house rents for $1,250/month — prices are low relative to rents. In Austin, a $400K house rents for $2,200/month — prices are high relative to rents. Same rent-earning asset, completely different economics. Calculate your specific deal in the GRM calculator.
Gross Rent Multiplier by City: 2026 Data
Based on median home prices and median rents from Zillow Research, HUD Fair Market Rents, and US Census ACS, here is the gross rent multiplier by city for the top 20 investment markets:
Cash Flow Markets (GRM Under 10)
| City | Median Price | Monthly Rent (3BR) | GRM | Cash Flow Potential |
|---|---|---|---|---|
| Cleveland, OH | $150,000 | $1,250 | 10.0 | Strong |
| Memphis, TN | $155,000 | $1,200 | 10.8 | Strong |
| Indianapolis, IN | $185,000 | $1,450 | 10.6 | Strong |
| Augusta, GA | $165,000 | $1,300 | 10.6 | Strong |
| Columbus, OH | $210,000 | $1,400 | 12.5 | Moderate |
| Birmingham, AL | $145,000 | $1,150 | 10.5 | Strong |
| Kansas City, MO | $200,000 | $1,350 | 12.3 | Moderate |
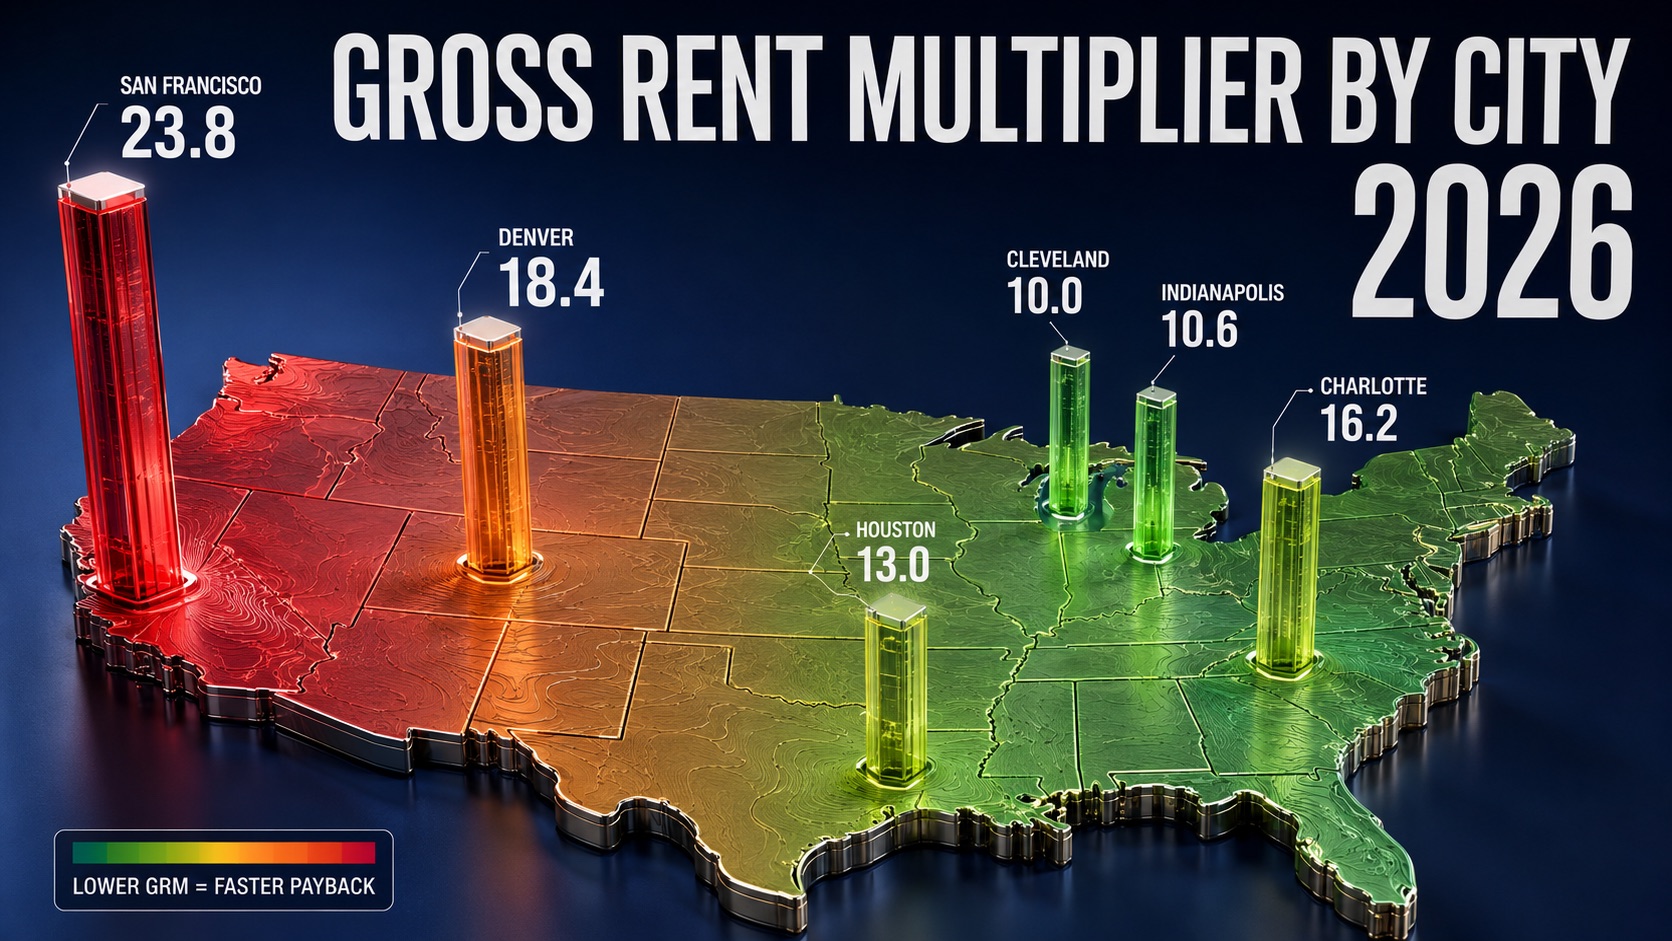
These markets have GRMs between 10 and 13 — meaning you pay 10–13 years of gross rent to own the property. At current 6.7% mortgage rates, these markets typically produce positive cash flow after all expenses. Cleveland and Memphis lead with the lowest gross rent multiplier by city among metros with populations over 300,000. Investors looking at the gross rent multiplier by city data consistently find that Midwest and Southeast markets dominate the top of the cash flow rankings because housing prices never spiked the way coastal and Sun Belt markets did in 2020–2022.
Balanced Markets (GRM 12–16)
| City | Median Price | Monthly Rent (3BR) | GRM | Cash Flow Potential |
|---|---|---|---|---|
| Greensboro, NC | $220,000 | $1,350 | 13.6 | Breakeven |
| Houston, TX | $250,000 | $1,600 | 13.0 | Breakeven |
| Atlanta, GA | $320,000 | $1,800 | 14.8 | Slightly negative |
| Charlotte, NC | $350,000 | $1,800 | 16.2 | Negative |
| Dallas, TX | $340,000 | $1,900 | 14.9 | Slightly negative |
| Phoenix, AZ | $380,000 | $2,000 | 15.8 | Negative |
GRM 13–16 means breakeven to slightly negative cash flow at current rates. These markets rely on appreciation and equity buildup for returns. Investors in Houston and Greensboro can sometimes achieve positive cash flow with larger down payments (30–35%) or below-market purchases.
Appreciation Markets (GRM Above 16)
| City | Median Price | Monthly Rent (3BR) | GRM | Cash Flow Potential |
|---|---|---|---|---|
| Tampa, FL | $360,000 | $2,100 | 14.3 | Negative |
| Denver, CO | $530,000 | $2,400 | 18.4 | Deeply negative |
| Austin, TX | $420,000 | $2,400 | 14.6 | Negative |
| Raleigh, NC | $400,000 | $2,000 | 16.7 | Negative |
| Nashville, TN | $420,000 | $2,200 | 15.9 | Negative |
| San Diego, CA | $850,000 | $3,200 | 22.1 | Deeply negative |
| San Francisco, CA | $1,200,000 | $4,200 | 23.8 | Deeply negative |
GRM above 16 means you are paying 16+ years of rent for the property. Cash flow is negative at any realistic financing. These are pure appreciation plays that require strong reserves and a long time horizon. San Francisco at 23.8 GRM means you need almost 24 years of gross rent to pay off the purchase price — before any expenses.
Compare any of these markets in the cap rate calculator (cap rate accounts for expenses while GRM does not). For state-specific data: Ohio, Georgia, North Carolina, Texas, Florida.
How to Use GRM by City to Compare Markets
The gross rent multiplier by city is a screening tool — not a final analysis. Here is how experienced investors use gross rent multiplier by city data:
Step 1: Screen Markets by GRM
If your strategy is cash flow, filter for cities with GRM under 12. If appreciation, GRM 15–20 with strong job and population growth. Eliminate markets that do not match your strategy before spending time on individual deal analysis.
Step 2: Compare Within a GRM Tier
Cleveland (GRM 10.0) and Memphis (GRM 10.8) are both cash flow markets, but they have different risk profiles. Cleveland has stronger job diversification (healthcare, finance, manufacturing). Memphis has higher crime and higher tenant turnover. Same GRM, different risk-adjusted returns. Always dig deeper than the gross rent multiplier by city headline number.
Step 3: Calculate GRM for Your Specific Deal
City-level GRM is a median — your deal may be better or worse. A $130K Cleveland property renting for $1,400/month has a GRM of 7.7 — significantly better than the city median of 10.0. Use the GRM calculator for your specific deal, then compare to the city median to see if you are getting above or below-average value.
Step 4: Run Full Analysis
GRM ignores expenses — taxes, insurance, maintenance, vacancy, management. The gross rent multiplier by city tables above use gross rent only. A GRM of 10 in Cleveland with $175/month insurance is very different from a GRM of 10 in a hypothetical Florida city with $375/month insurance. After GRM screening, run every deal through the cash flow calculator with all real expenses. For the full picture including ROI, appreciation, and tax benefits, use the ROI calculator.
GRM vs Cap Rate: Which to Use When Comparing Cities
| Metric | GRM | Cap Rate |
|---|---|---|
| Formula | Price ÷ Annual Gross Rent | NOI ÷ Price × 100 |
| Includes expenses? | No — gross rent only | Yes — after operating expenses |
| Best for | Quick screening, comparing markets | Deeper analysis, comparing deals |
| Lower = better? | Yes (lower = more rent per dollar) | Higher = better (more income per dollar) |
| Speed | 2 numbers needed | 5+ numbers needed (expenses) |
| Limitation | Ignores expenses entirely | Ignores financing, appreciation |
Use GRM first to screen cities and eliminate markets that do not fit your strategy. Then use cap rate to compare specific deals within your chosen markets. For a deeper comparison, see our cap rate vs GRM guide. Calculate both in the cap rate calculator and GRM calculator.
Why GRM Is Changing in 2026
The gross rent multiplier by city is shifting in 2026 due to three forces:
- Rents are flattening while prices hold. National rent growth slowed to 1.2% annually, down from 15%+ in 2021–2022. But home prices are still rising 1.8% nationally. Result: GRMs are increasing (getting worse for investors) in most markets. Per NAR data, the median existing-home price reached $440,600 in June 2026.
- Overbuilt Sun Belt markets are correcting. Austin rents dropped 5% YoY. Phoenix and Jacksonville are softening. GRMs in these markets are improving slightly as prices decline while rents stabilize.
- Midwest resilience. Cleveland, Indianapolis, and Columbus continue to see steady rent growth (2–4%) with moderate price appreciation. Their GRMs remain the most favorable in the country for cash flow investors.
The takeaway: if your gross rent multiplier by city analysis shows GRM rising in your target market (rent growth slower than price growth), cash flow is getting harder. Consider pivot to markets where GRM is stable or improving.
5 Mistakes When Using GRM to Compare Cities
1. Comparing GRM Across Different Property Types
A single-family GRM of 12 is not comparable to a multifamily GRM of 12. Multifamily properties have different expense ratios, management costs, and financing terms. Always compare same property type — SFR to SFR, duplex to duplex. Use the multifamily calculator for apartment buildings.
2. Ignoring Expense Differences Between Cities
Cleveland has $175/month insurance. Florida has $375/month. Texas has $275/month plus no income tax but high property taxes. Two cities with identical GRM of 11 can produce wildly different cash flows once you subtract actual expenses. GRM is a starting point, not a conclusion. See our insurance cost by state guide for the expense data that GRM hides.
3. Using Asking Rent Instead of Actual Rent
Zillow and Realtor.com show asking rents. Actual rents are often 3–8% lower after negotiation, concessions, and vacancy adjustments. Use actual achieved rents (from property managers, Rentometer “recently rented,” or HUD Fair Market Rents) for accurate GRM. Overestimating rent by 5% turns a GRM of 11 into 11.6 — potentially swinging a deal from positive to negative cash flow.
4. Not Accounting for Vacancy
GRM uses gross annual rent at 100% occupancy. No property is occupied 100% of the time. Cleveland has 5% vacancy. Austin has 9%. That 4% difference means $576/year less income on a $1,200/month rental in Austin — enough to change your GRM analysis. Factor vacancy into your cash flow analysis using the vacancy rate calculator.
5. Chasing the Lowest GRM Without Risk Analysis
The lowest GRM cities often have higher tenant turnover, property crime, and management challenges. A GRM of 7 in a high-crime neighborhood produces great numbers on paper but may result in $3,000 eviction costs, $2,000 in damage repairs, and 3 months vacancy every 2 years. Always visit the neighborhood. Always talk to local property managers. Numbers alone do not capture risk.
Frequently Asked Questions
What is a good gross rent multiplier for investment property?
A GRM under 12 is generally good for cash flow investors at current 2026 mortgage rates. GRM 8–10 is excellent — these are typically found in Midwest and Southeast markets like Cleveland (10.0), Memphis (10.8), and Indianapolis (10.6). GRM 12–15 is neutral — breakeven to slightly negative cash flow. GRM above 15 indicates an appreciation market where rents do not cover expenses. The “right” GRM depends on your strategy — cash flow investors want low GRM, appreciation investors accept high GRM with strong growth fundamentals. Calculate your deal in the GRM calculator.
Which US cities have the lowest gross rent multiplier in 2026?
How do I find the gross rent multiplier for my zip code?
Is GRM or cap rate better for comparing rental markets?
Why is gross rent multiplier increasing in most cities?
Related Calculators and Guides
- GRM Calculator — Calculate gross rent multiplier for any deal
- Cap Rate Calculator — Property return rate (includes expenses)
- Cash Flow Calculator — Monthly cash flow analysis
- Rental Property Calculator — Full investment analysis
- ROI Calculator — Total return over hold period
- Vacancy Rate Calculator — Market vacancy analysis
- Multifamily Calculator — Apartment building analysis
- All 30+ Calculators
Blog guides:
Leave a Reply