Published: June 23, 2026 · By Alex Petrov
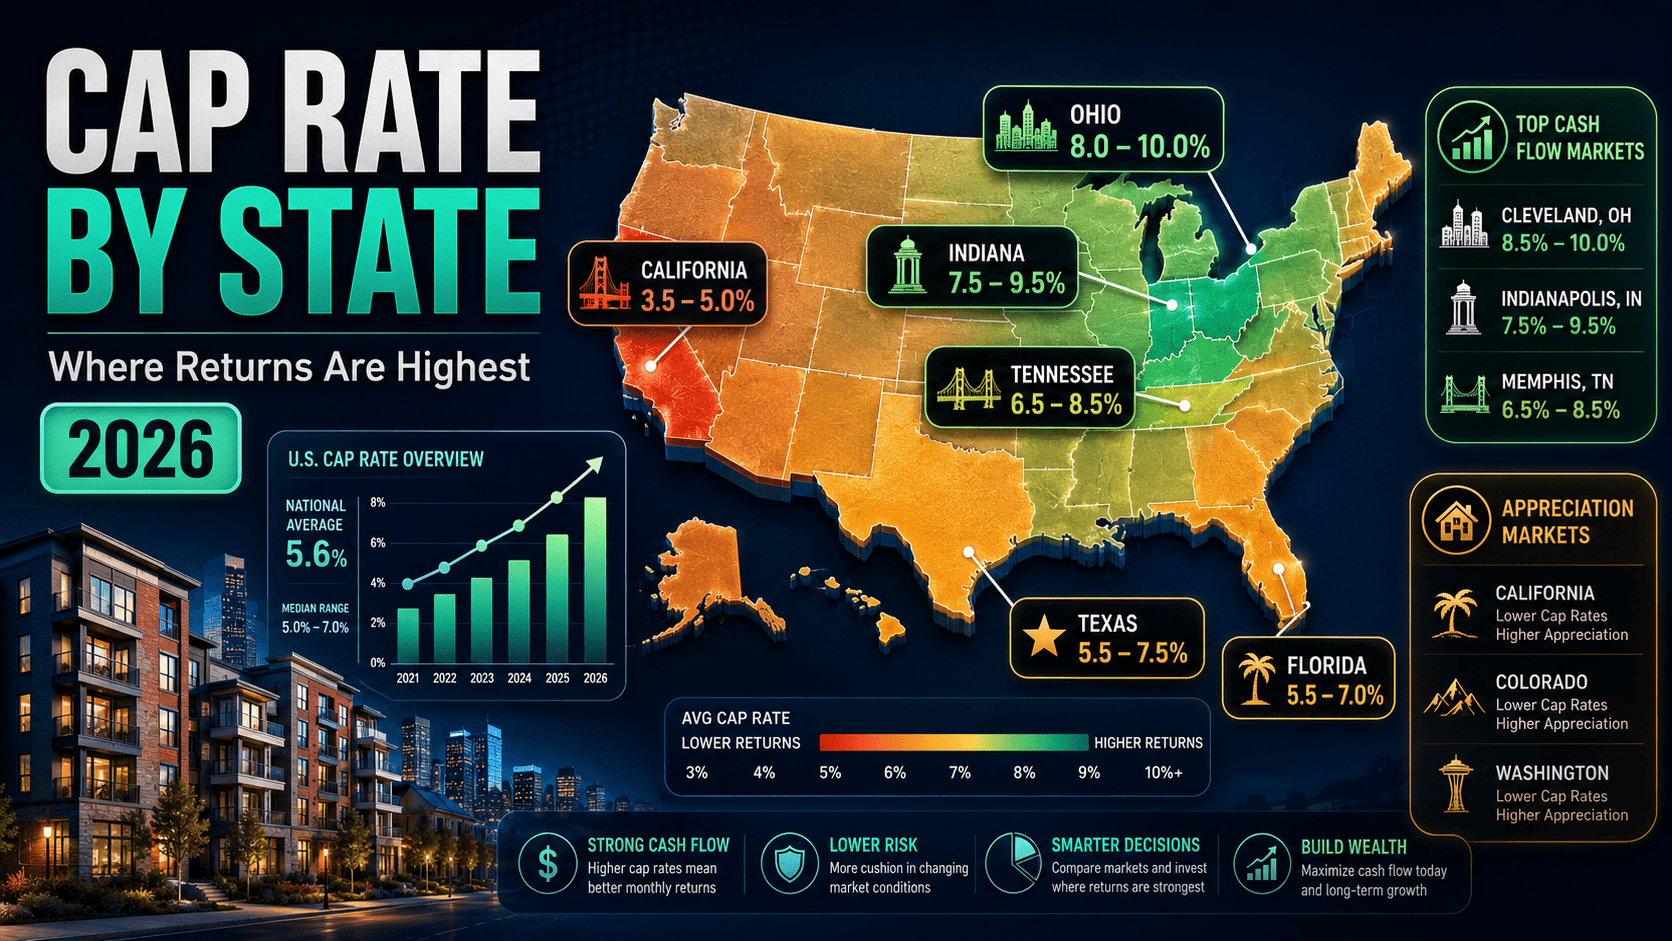
Cap Rate by State: Where Returns Are Highest
Cap rates vary dramatically across the United States. A rental property in Cleveland might offer an 8.5% cap rate while an identical building in San Jose produces 3.2%. The difference is not about property quality — it is about how each market prices rental income relative to property values.
Understanding cap rate by state is the first step to identifying markets where rental income actually covers your costs versus markets where you pay a premium for appreciation potential. This guide breaks down average cap rates in every major investment market, explains what drives the differences, and shows how to use this data to find the best deals.
Calculate your specific deal with the free Cap Rate Calculator. For a full primer on cap rates, see the cap rate guide.
Average Cap Rate by State in 2026
| State | Avg Cap Rate | Median Price | Avg Rent | Investor Verdict |
|---|---|---|---|---|
| Ohio | 8.0%–10.0% | $155,000 | $1,150 | Strong cash flow |
| Indiana | 7.5%–9.5% | $195,000 | $1,350 | Strong cash flow |
| Tennessee | 6.5%–8.5% | $250,000 | $1,500 | Balanced |
| Alabama | 7.5%–9.5% | $165,000 | $1,100 | High yield, lower appreciation |
| Missouri | 7.0%–9.0% | $180,000 | $1,200 | Strong cash flow |
| Georgia | 6.0%–8.0% | $280,000 | $1,650 | Balanced — Atlanta growing |
| Texas | 5.5%–7.5% | $290,000 | $1,800 | Watch property taxes (2.2%) |
| Florida | 5.5%–7.0% | $350,000 | $2,000 | Insurance costs rising |
| North Carolina | 5.5%–7.0% | $310,000 | $1,700 | Growth market, thinning caps |
| Arizona | 5.0%–6.5% | $380,000 | $1,900 | Appreciation play |
| Colorado | 4.0%–5.5% | $500,000 | $2,100 | Negative cash flow likely |
| Washington | 4.0%–5.5% | $520,000 | $2,200 | Appreciation dependent |
| New York | 4.0%–6.0% | $400,000 | $2,000 | Varies wildly by region |
| California | 3.5%–5.0% | $650,000 | $2,800 | Negative cash flow at these rates |
Data based on Zillow Research, U.S. Census Bureau, and local MLS averages. Cap rates vary significantly within each state — a Class A property in downtown Nashville has a different cap rate than a Class C duplex in rural Tennessee.
Why Cap Rate by State Varies So Much
1. Price-to-Rent Ratio
States with low property prices relative to rents (Ohio, Indiana, Alabama) produce higher cap rates. States where prices are high relative to rents (California, Colorado) produce lower cap rates. This is the single biggest driver of cap rate differences.
2. Property Taxes
High property taxes directly reduce NOI and lower cap rates. Texas charges 2.2% of assessed value annually — on a $300,000 property, that is $6,600/year in taxes. Ohio charges 1.5% ($4,500). California charges 0.7% ($4,550 on a much higher value).
The irony: Texas has some of the highest property taxes in the country, which eats into what would otherwise be strong cap rates. A Texas property at 6.5% cap rate with 2.2% taxes has the same net return as an Ohio property at 8% with 1.5% taxes. Use the NOI Calculator to see how taxes affect your specific deal.
3. Insurance Costs
Florida and Louisiana insurance premiums have increased 40-80% since 2022. A property that produced 7% cap rate in 2020 may now produce 5.5% after insurance increases. Always get an insurance quote before calculating your cap rate — do not use state averages.
4. Appreciation Expectations
Markets with strong population growth (Austin, Nashville, Raleigh) have lower cap rates because buyers pay a premium for expected appreciation. Markets with stable or declining populations (Cleveland, Detroit, St. Louis) have higher cap rates because the price reflects income only, not growth expectations.
Best Cap Rate by State for Each Strategy
| Strategy | Target Cap Rate | Best States | Why |
|---|---|---|---|
| Cash flow (buy-and-hold) | 7%+ | Ohio, Indiana, Alabama, Missouri | Low prices, strong rents, immediate positive cash flow |
| BRRRR | 6%+ (post-refi) | Ohio, Tennessee, Georgia | Value-add upside + rental income |
| Appreciation | 4%–6% | Texas, Florida, NC, Arizona | Growth markets, population influx |
| Balanced | 5.5%–7% | Tennessee, Georgia, NC | Some cash flow + some appreciation |
Cap Rate by State and City: Top 10 Cash Flow Markets
| # | City | State | Avg Cap Rate | Median Price | Avg Rent |
|---|---|---|---|---|---|
| 1 | Cleveland | OH | 9.2% | $130,000 | $1,100 |
| 2 | Detroit | MI | 9.0% | $110,000 | $950 |
| 3 | Birmingham | AL | 8.5% | $145,000 | $1,050 |
| 4 | Indianapolis | IN | 8.0% | $195,000 | $1,400 |
| 5 | Memphis | TN | 7.8% | $175,000 | $1,250 |
| 6 | Kansas City | MO | 7.5% | $210,000 | $1,350 |
| 7 | Columbus | OH | 7.2% | $235,000 | $1,500 |
| 8 | Jacksonville | FL | 6.8% | $280,000 | $1,650 |
| 9 | San Antonio | TX | 6.5% | $260,000 | $1,550 |
| 10 | Atlanta | GA | 6.2% | $310,000 | $1,750 |
These cap rate by state figures represent averages for Class B residential properties. Class A properties trade at 1-2% lower caps. Class C properties trade at 1-2% higher. Always run your specific deal through the Cap Rate Calculator.
How to Use Cap Rate by State Data for Investing
Step 1: Filter by Cap Rate
If you need cash flow, eliminate states with average caps below 6%. If you want appreciation, target states with 4-6% caps and strong job growth.
Step 2: Adjust for Local Costs
State averages hide city-level variation. Memphis (7.8%) and Nashville (5.2%) are both Tennessee but produce very different returns. Always drill into city-level data.
Step 3: Factor in Total Return
A 5% cap rate in a 4% appreciation market may produce higher total return (IRR) than an 8% cap rate in a 0% appreciation market. Use the IRR Calculator to compare total returns. See the IRR guide for how to model this.
Step 4: Run Full Screening
Cap rate is just the first filter. Run all five metrics: cap rate, DSCR, cash-on-cash, cash flow, and vacancy rate. The screening guide walks through the full process.
Cap Rate Trends: Where Are Rates Heading?
Cap rates compressed (dropped) from 2010-2022 as property values rose faster than rents. Since 2022, cap rates have expanded (risen) in most markets due to higher interest rates reducing buyer demand.
In 2026, cap rates are stabilizing. Midwest markets have held steady at 7-9%. Sun Belt markets that compressed to 4% in 2021 have expanded back to 5.5-6.5%. Coastal markets remain compressed at 3.5-5%.
The trend to watch: if interest rates decline in late 2026 or 2027, cap rates will compress again as more buyers enter the market. Buying at today’s higher caps may look very smart in hindsight.
Disclaimer
This article is for educational purposes only. Cap rate data is based on market averages and may not reflect specific properties, neighborhoods, or conditions. Cap rates change frequently based on market conditions, interest rates, and local factors. Always verify data with local market research and professional analysis. Consult a licensed real estate professional and financial advisor before making investment decisions. ArvCalc is not a broker, appraiser, or financial advisor.
Ohio consistently offers the highest cap rates for rental property, averaging 8-10% statewide. Cities like Cleveland (9.2%) and Columbus (7.2%) provide strong cash flow due to low purchase prices relative to rental income. Alabama and Indiana also offer high cap rates in the 7.5-9.5% range. These states have lower property values, which creates a favorable price-to-rent ratio for investors focused on cash flow.
A good cap rate depends on the state and your investment strategy. In Midwest states (Ohio, Indiana, Missouri), target 7%+ for strong cash flow. In Sun Belt states (Tennessee, Georgia, Texas), 5.5-7% is considered good with balanced cash flow and appreciation. In coastal states (California, Washington), cap rates of 4-5% are normal but usually produce negative cash flow — investors rely on appreciation instead.
California cap rates are low (3.5-5%) because property prices are extremely high relative to rents. A $650,000 property renting for $2,800/month produces a much lower cap rate than a $155,000 Ohio property renting for $1,150/month — even though the California rent is higher in absolute terms. Buyers in California accept low cap rates because they expect 4-6% annual appreciation to make up the difference.
Not necessarily. Higher cap rates mean more cash flow per dollar of purchase price, but they often come with lower appreciation, higher tenant turnover, and older properties requiring more maintenance. A 9% cap rate in a declining market may produce lower total returns than a 5% cap rate in a growing market with 4% annual appreciation. Compare total returns using IRR, not cap rate alone.
Property taxes directly reduce NOI, which lowers cap rate. Texas (2.2% average property tax) and New Jersey (2.4%) have among the highest property taxes in the country, which reduces their effective cap rates by 1.5-2% compared to low-tax states like Alabama (0.4%) or Colorado (0.5%). Always calculate cap rate using actual local tax rates, not state averages.
If you live in a low cap rate state (California, New York, Washington), investing out of state in Midwest or Southeast markets can significantly improve your returns. Many investors in coastal states buy in Ohio, Indiana, and Tennessee for 7-9% cap rates versus 3-5% locally. The trade-off is remote management (8-10% property management fee) and less hands-on control. Start with one out-of-state property to learn the process before scaling.
Leave a Reply