Last updated: September 24, 2026 · Originally published: August 19, 2026 · By Alex Petrov
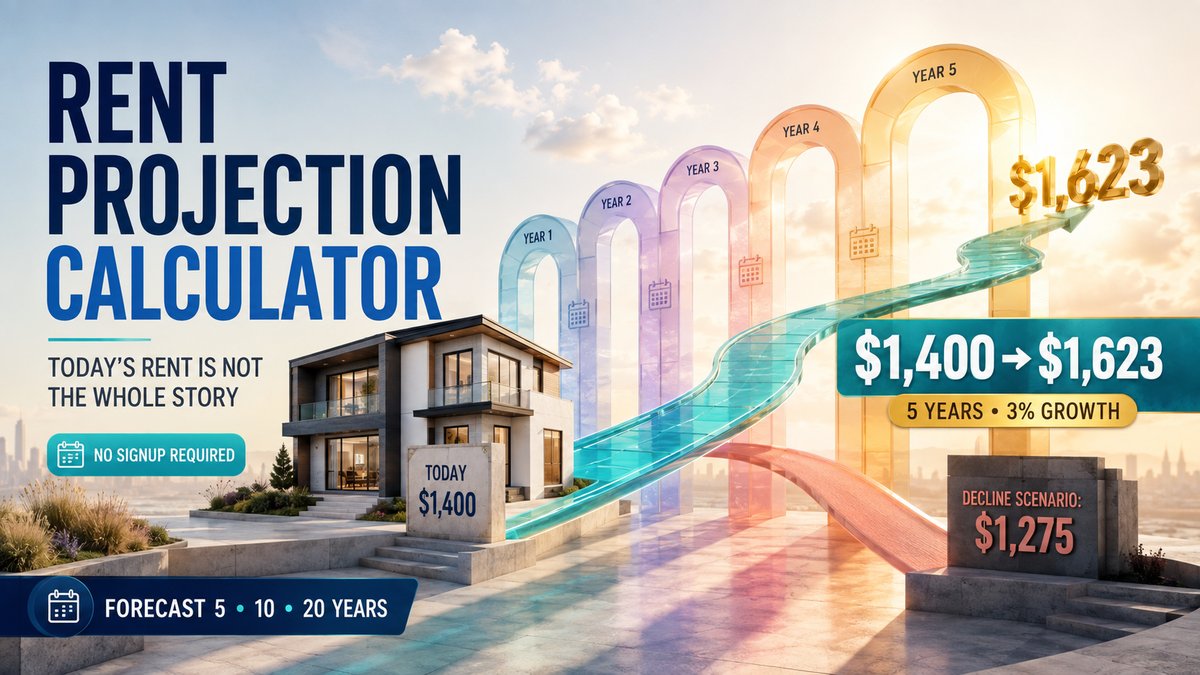
The rent projection calculator forecasts rental income over 5, 10, or 20 years — showing you how today’s $1,400/month rent grows to $1,623 at 3% annual growth or shrinks to $1,275 if the market declines 2%/year. This single tool turns a static cash flow analysis into a forward-looking investment decision. No signup required.
Why Rent Projections Matter
Most investors analyze rental property using today’s rent. But you hold for 5–20 years. A property that barely cash-flows at $1,400/month might produce $200/month positive cash flow at $1,623 rent five years from now — without any action on your part. Conversely, a market with declining rents can turn a cash-flow-positive deal negative within 3 years.
The rent projection calculator quantifies this by projecting year-by-year income at different growth rates. Use it alongside the ROI calculator (which includes appreciation) and the cash flow calculator (which shows monthly numbers) for the complete picture.
How to Use the Rent Projection Calculator
Step 1 — Enter Current Rent
Monthly rent today. Use actual market rent — not the listing price or what the seller claims. Verify with Zillow, Rentometer, or a local property manager. If the property is vacant, use conservative market comps.
Step 2 — Set Growth Rate
Annual rent growth percentage. This is the most important assumption. Guidelines:
| Growth Rate | When to Use | Example Markets |
|---|---|---|
| 4–5% | High-growth metros with supply constraints | Raleigh, Nashville, Charlotte |
| 2–3% | Stable markets tracking inflation | Memphis, Indianapolis, Columbus |
| 0–1% | Flat or oversupplied markets | Markets with apartment construction boom |
| −1 to −3% | Declining markets or correction | Austin (2023–2025 rent correction) |
Historical US rent growth averages 3.2%/year per FRED CPI rent data. But individual markets vary wildly — Austin rents dropped 5% in 2023 while Memphis rose 4%. Always use market-specific data from NAR or local MLS.
Step 3 — Choose Hold Period
5, 10, or 20 years. Longer holds amplify the growth rate effect — 3% annual growth over 20 years turns $1,400 into $2,528 (+80%). The same 3% over 5 years = $1,623 (+16%). Compound growth is effective.
Step 4 — Read Projections
The calculator shows year-by-year rent, cumulative income, and total rental income over the hold. Compare scenarios: what if growth is 2% vs 4%? The gap compounds over time.
Worked Example 1: Memphis SFR — 5-Year Projection
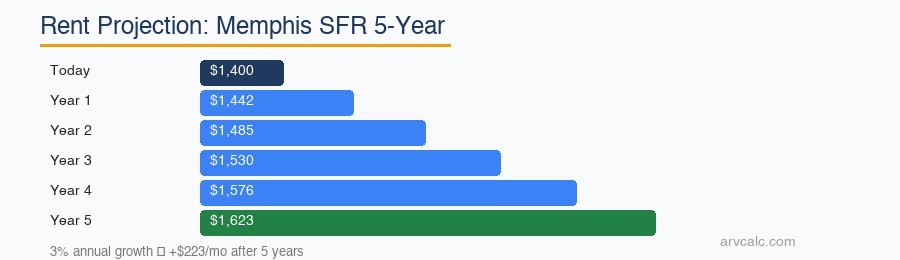
Current rent: $1,400/month · Growth: 3%/year · Hold: 5 years
| Year | Monthly Rent | Annual Income | Cumulative |
|---|---|---|---|
| Today | $1,400 | $16,800 | — |
| Year 1 | $1,442 | $17,304 | $17,304 |
| Year 2 | $1,485 | $17,820 | $35,124 |
| Year 3 | $1,530 | $18,360 | $53,484 |
| Year 4 | $1,576 | $18,912 | $72,396 |
| Year 5 | $1,623 | $19,476 | $91,872 |
Result: $1,400 → $1,623 after 5 years (+$223/month). That $223 increase goes straight to cash flow — if your mortgage is fixed at $958/month, every dollar of rent growth improves your bottom line. Over 5 years, total rental income is $91,872 vs $84,000 at flat rent — a $7,872 difference from 3% growth alone.
Run this in the rent projection calculator. Then plug the Year 5 rent into the cash-on-cash calculator to see your future CoC return — a property at −6% CoC today can be +3% CoC in 5 years if rents grow 3%.
Worked Example 2: Austin SFR — Rent Decline Scenario
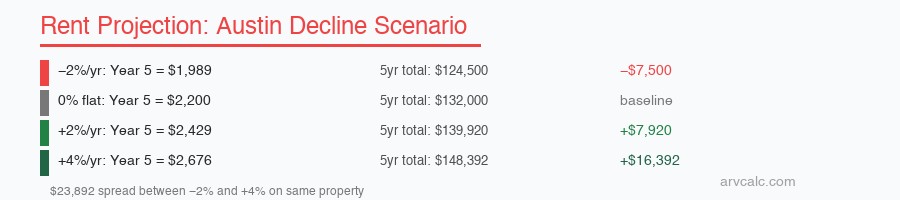
Current rent: $2,200/month · Growth: −2%/year · Hold: 5 years
| Scenario | Year 5 Rent | 5-Year Total Income | vs Flat |
|---|---|---|---|
| −2%/year (decline) | $1,989 | $124,500 | −$7,500 |
| 0% (flat) | $2,200 | $132,000 | baseline |
| +2%/year (growth) | $2,429 | $139,920 | +$7,920 |
| +4%/year (strong) | $2,676 | $148,392 | +$16,392 |
The spread between −2% and +4% growth is $23,892 over 5 years — on the same property. This is why rent projection is not optional. Austin experienced −5% rent correction in 2023–2024 due to record apartment deliveries. Investors who projected 4% growth got burned. Those who ran the −2% scenario were prepared.
Always run three scenarios: pessimistic, expected, optimistic. The rent projection calculator lets you compare side by side. For Austin-specific data, check Zillow Research rent indices.
How Rent Growth Affects Investment Returns
| Starting Metric | At 0% Growth (5yr) | At 3% Growth (5yr) | Difference |
|---|---|---|---|
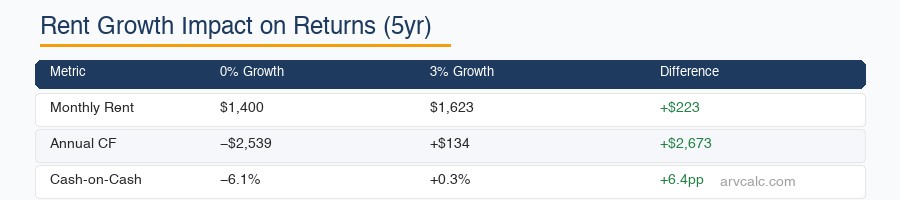
| Monthly Rent | $1,400 | $1,623 | +$223/mo |
| Annual Cash Flow | −$2,539 | +$134 | +$2,673 |
| Cash-on-Cash | −6.1% | +0.3% | +6.4pp |
| Cap Rate | 5.3% | 6.2% | +0.9% |
| NOI | $8,958 | $11,631 | +$2,673 |
At 0% growth, the Memphis SFR stays cash-flow negative for the entire hold. At 3% growth, it crosses into positive territory in Year 4. This table is why the rent projection calculator is necessary — it shows when a deal turns profitable, not just if. Calculate your breakeven year using the property cash flow calculator.
Where to Find Rent Growth Data
- FRED CPI Rent Index — national rent inflation (3.2% long-term average)
- Zillow Research — metro-level rent indices, updated monthly
- NAR Research — rental market statistics by metro
- RentCafe / Apartments.com — apartment rent trends by city
- Local property managers — on-the-ground rent growth estimates for specific neighborhoods
Use 2–3% as default if no local data is available. Use market-specific data when possible — the difference between Memphis (+4%) and Austin (−2%) is enormous over a 5-year hold.
5 Rent Projection Mistakes
1. Using National Averages for Local Markets
Why: National rent growth (3.2%) masks huge local variation. Austin dropped 5% while Memphis rose 4% in the same year.
Fix: Always use metro-specific data. Zillow Research provides city-level rent indices. The rent projection calculator shows impact of different rates.
2. Projecting Recent Growth Forward
Why: Markets that grew 8% last year won’t sustain that. Mean reversion is real. Using 8% for 10 years turns $1,400 into $3,023 — unrealistic.
Fix: Use 2–3% for conservative baseline regardless of recent performance. Run optimistic and pessimistic scenarios.
3. Ignoring Rent Decline Scenarios
Why: Rents can decline. New apartment supply, economic downturns, or population shifts can push rents down 3–5% in a single year.
Fix: Always run a −2% scenario. If your deal goes underwater at −2% growth, it is too dependent on rent appreciation.
4. Not Factoring Expense Growth
Why: Rent grows 3%, but expenses grow too — insurance, property tax, maintenance all inflate. If expenses grow 4% while rent grows 3%, cash flow actually declines.
Fix: Project expenses separately. Insurance in NC rose 7.5%/year recently. The cash flow calculator can model expense growth alongside rent growth.
5. Confusing Gross Rent Growth with Cash Flow Growth
Why: $223/month rent increase does not mean $223 more cash flow. Vacancy rate, PM fees, and maintenance all scale with rent. If PM is 10%, you keep $201 of the $223 increase.
Fix: Run the projected rent through the full rental property calculator to see net impact. Use the NOI calculator for operating income effect.
Frequently Asked Questions
What is a realistic rent growth rate to project?
Use 2–3% as a conservative baseline — roughly matching inflation. High-growth markets (Raleigh, Charlotte, Nashville) may warrant 4–5%. Markets with new apartment oversupply may justify 0% or even negative growth. The national long-term average is 3.2% per FRED CPI rent data. Always use market-specific data when available.
How does rent projection affect my investment decision?
Can rents actually decline?
How is rent projection different from ROI calculation?
Should I raise rent every year?
Where can I find historical rent growth data for my market?
Related Calculators and Guides
- Rent Projection Calculator — Forecast rent over 5-20 years
- ROI Calculator — Total return with appreciation + paydown
- Cash-on-Cash Calculator — Annual cash yield
- Cash Flow Calculator — Monthly projections
- Rental Property Calculator — Full deal analysis
- NOI Calculator — Operating income
- Vacancy Rate Calculator — Vacancy impact
- Cap Rate Calculator — Property yield
- All 30+ Calculators
Blog guides:
Leave a Reply