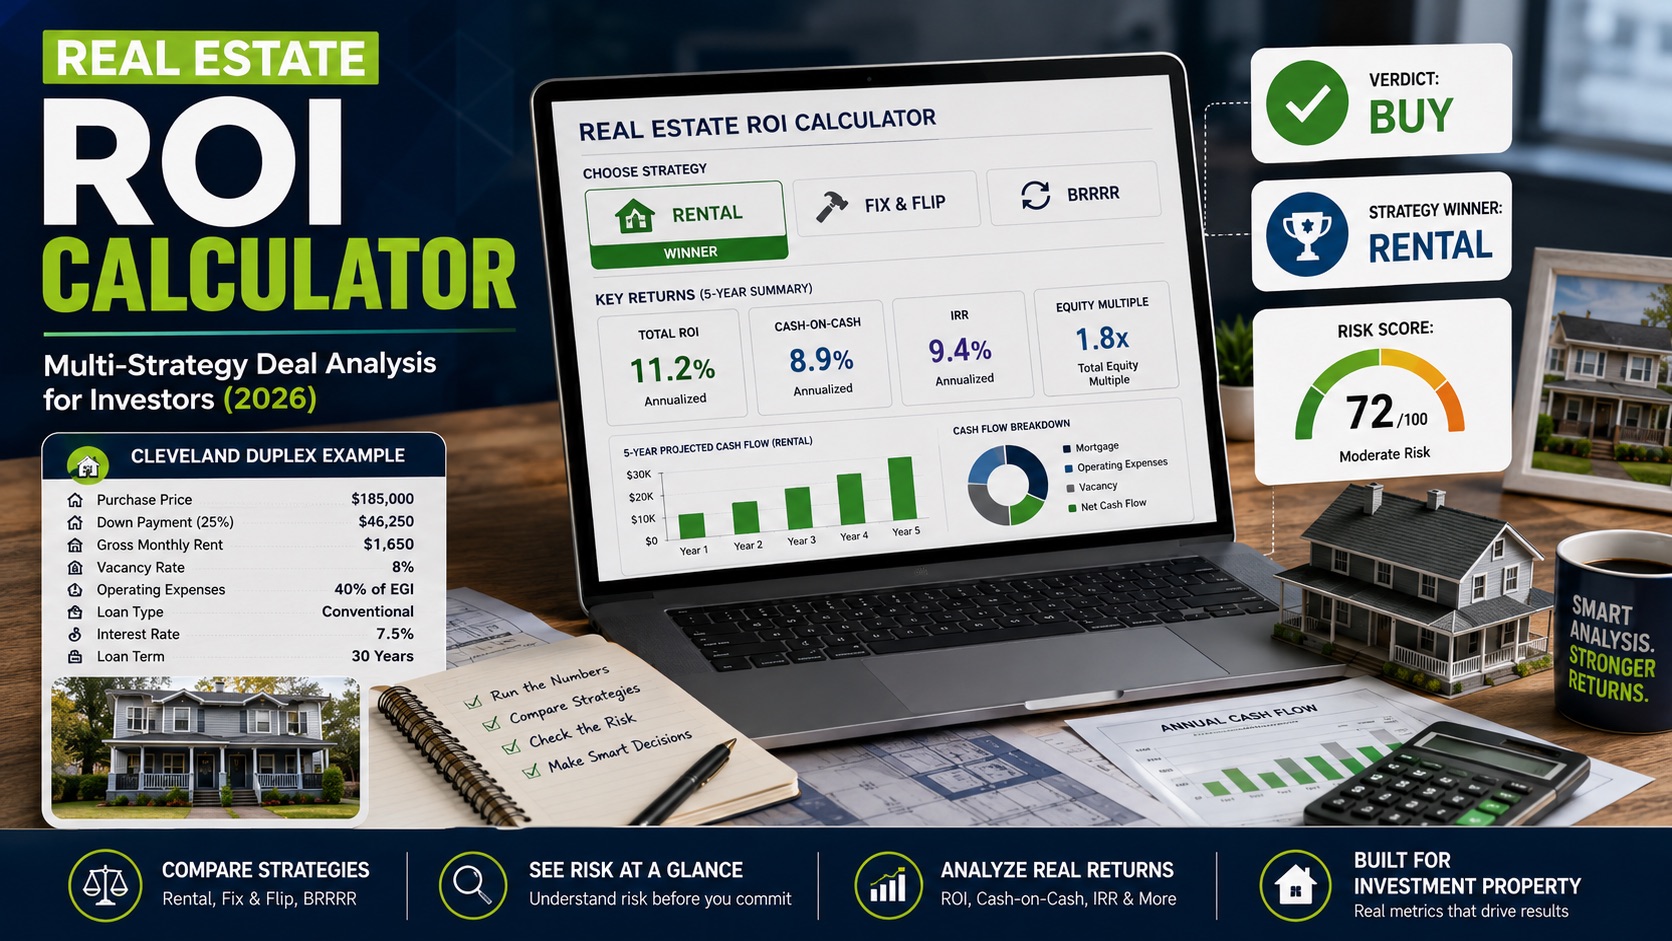
You put $46,250 down on a $185,000 Cleveland duplex, and your real estate ROI calculator shows 11.2% total return. In year one, your cash-on-cash return sits at 8.9%, and the risk score flags the 1970s roof. That single deal — common in today’s 7.5% conventional rate environment — illustrates exactly why a single ROI number never tells the full story. This guide walks you through the real estate ROI calculator on arvcalc.com, showing you how to interpret Verdict, Strategy Winner, and Risk Score for smarter investment decision.
Overview — Why Multi-Strategy ROI Analysis Matters
How to Use the Calculator
Inputs and Outputs
How Real Estate ROI Works
What Is Real Estate ROI?
What Your Verdict and Strategy Winner Mean
2026 ROI Benchmarks
Strategy Guide by Investor Type
Common Use Cases
Industry Conventions
Limitations
Common Mistakes
FAQ
Related Calculators
Overview — Why Multi-Strategy ROI Analysis Matters
Single-metric thinking kills deals. Here’s why you need three lenses.
In 2026, the average US investor faces a brutal reality: 7.5% conventional rates on investment properties, 8.25% on DSCR loans, and hard money pushing 12% with 3 points. A real estate ROI calculator that only spits out one number — say, 8% cash-on-cash — misses the bigger picture. Your duplex might show mediocre cash flow but killer appreciation potential. Or a flip might look great on total ROI but carry a risk score that keeps you up at night.
That’s why the real estate ROI calculator on arvcalc.com gives you three outputs: Verdict (buy, pass, or caution), Strategy Winner (rental, flip, or BRRRR), and Risk Score (0–100). You get a decision engine, not just a number.
I’ve been analyzing deals since 2018. I’ve seen investors reconsider the assumptions from 12% CoC returns because the roof needed replacement and the neighborhood had declining rents. I’ve also seen people jump on 6% total ROI deals that turned into gold mines through forced appreciation. The calculator helps you see both sides.
This guide covers how to use the tool, what each metric means, and how to apply 2026 benchmarks to real deals. Everything here assumes you’re evaluating investment property — not your primary residence. If you need help deciding whether to rent or buy your own home, use the Rent vs Buy Calculator instead.
The real estate ROI calculator walks you through a straightforward four-step process to evaluate any investment property.
How to Use the Calculator
Four steps to get your deal analyzed in under two minutes.
Step one: Enter the purchase price. For our Cleveland duplex, that’s $185,000. Add your down payment percentage — 25% is standard for investment properties in 2026, though DSCR loans might require 30%.
Step two: Input your financing terms. Conventional loan at 7.5% for 30 years. Include closing costs (typically 2–5% of purchase price). Don’t forget property taxes, insurance, and HOA fees if applicable.
Step three: Add your rental income. For our duplex, two units at $825 each = $1,650/month gross. Factor in vacancy — I use 8% for stable markets, 12% for transitional areas. Operating expenses run 35–50% of gross income depending on age and condition.
Step four: Click calculate. You’ll see three outputs plus a full breakdown of Total ROI, Cash-on-Cash Return, IRR, Equity Multiple, and Capital Payback. The calculator also shows a comparison table for rental, flip, and BRRRR scenarios.
Pro tip: Run three scenarios — conservative (higher vacancy, lower rent growth), base case (your best estimates), and optimistic (forced appreciation). The Verdict and Risk Score change dramatically between them.
Understanding what goes into the real estate ROI calculator — and what comes out — helps you use the tool more effectively.
Inputs and Outputs
Every field matters. Here’s what goes in and what comes out.
| Input Field | Example Value | Why It Matters |
|---|---|---|
| Purchase Price | $185,000 | Base for all ROI calculations |
| Down Payment | 25% ($46,250) | Determines advantage and cash needed |
| Interest Rate | 7.5% | 2026 conventional investment rate |
| Loan Term | 30 years | Affects monthly payment and total interest |
| Gross Monthly Rent | $1,650 | Primary income source for rentals |
| Vacancy Rate | 8% | Reduces effective gross income |
| Operating Expenses | 40% of EGI | Includes taxes, insurance, repairs |
| Output Metric | Duplex Example | Interpretation |
|---|---|---|
| Total ROI | 11.2% | Total return on all invested capital |
| Cash-on-Cash Return | 8.9% | Annual return on cash invested |
| IRR | 9.4% | Time-weighted annual return |
| Equity Multiple | 1.8x | Total equity created per dollar invested |
| Capital Payback | 4.2 years | Time to recover initial cash investment |
| Verdict | Buy | Passes all thresholds |
| Strategy Winner | Rental | Best strategy for this deal |
| Risk Score | 72/100 | Moderate risk due to property age |
How Real Estate ROI Works
Formulas you can actually use without a finance degree.
The real estate ROI calculator uses five core formulas. Let’s walk through each with our Cleveland duplex example.
Total ROI = (Net Profit + Appreciation) / Total Cash Invested. Net profit is rental income minus all expenses. Appreciation assumes 3% annual growth. For year one: net cash flow of $3,420 plus appreciation of $5,550 = $8,970. Divide by $46,250 down payment plus $9,250 closing costs = $55,500. Total ROI = 16.2% in year one. By year five, with rent increases and principal paydown, it hits 11.2% annualized.
Cash-on-Cash Return = Annual Pre-Tax Cash Flow / Total Cash Invested. Our duplex generates $285/month after all expenses including mortgage = $3,420/year. $3,420 / $55,500 = 6.2% in year one. After rent increases and refi at lower rate, it climbs to 8.9% by year five.
Formula: Cash-on-Cash Return = Annual Cash Flow ÷ Total Cash Invested
IRR (Internal Rate of Return) accounts for timing of cash flows. Money received earlier is worth more. Our duplex has negative cash flow in year one (repairs), positive by year three, and a big jump in year five from refi proceeds. IRR calculates to 9.4% — lower than total ROI because early years drag it down.
Equity Multiple = Total Equity / Total Cash Invested. After five years, you’ve built $99,900 in equity through appreciation and principal paydown. $99,900 / $55,500 = 1.8x. Every dollar you put in created $1.80 in equity.
Capital Payback Period = Total Cash Invested / Annual Cash Flow. $55,500 / $13,200 average annual cash flow = 4.2 years. That’s how long until you’ve recovered your initial investment from cash flow alone.
These five metrics together tell you more than any single number. The real estate ROI calculator computes all five automatically and shows you how they change over time.
What Is Real Estate ROI?
ROI isn’t one number. It’s a family of metrics that smart investors use together.
Real estate ROI measures the return you earn on the money you invest in a property. But unlike stocks where ROI is straightforward (sell price minus buy price divided by buy price), real estate involves advantage, cash flow, appreciation, and tax benefits.
Total ROI is the broadest measure. It includes rental income, appreciation, principal paydown, and tax savings. For our duplex, total ROI of 11.2% means your $55,500 investment grew at 11.2% annually over five years.
Cash-on-Cash Return focuses only on the cash you actually receive. It ignores appreciation and principal paydown. This is the metric most flippers and rental investors watch monthly. An 8.9% CoC means your bank account grows by 8.9% of your initial cash each year.
IRR is the most sophisticated metric. It accounts for the time value of money — a dollar today is worth more than a dollar tomorrow. For long-term holds, IRR tends to be lower than total ROI because early years have lower cash flow.
Equity Multiple tells you how much wealth you’ve built. A 1.8x multiple means you’ve nearly doubled your money in equity. This is the metric Warren Buffett would watch.
Capital Payback Period answers the question: “When do I get my money back?” 4.2 years means you’ve recovered your entire cash investment from operations alone. Everything after that is pure profit.
The this tool shows all five metrics side by side. You can toggle between year 1, year 5, and year 10 views to see how returns compound.
What Your Verdict and Strategy Winner Mean
The decision engine that separates good deals from traps.
The calculator’s Verdict is a simple green-yellow-red system. Green means “Buy” — the deal passes all your threshold metrics. Yellow means “Caution” — one or two metrics are borderline. Red means “Pass” — the deal fails on multiple fronts.
Thresholds are based on 2026 market data. For rentals, we use 8% minimum cash-on-cash return, 10% total ROI, and 3-year maximum capital payback. For flips, we use 20% minimum total ROI and 6-month maximum hold time. For BRRRR, we use 15% minimum IRR and 80% maximum loan-to-value after refi.
Strategy Winner compares the same deal across three strategies. Our duplex scores “Rental” as the winner because cash flow is strong and appreciation is moderate. The same property with a 12% hard money loan might flip to “BRRRR” if you can force appreciation through renovations.
Risk Score ranges from 0 to 100. Scores above 70 are low risk. Scores between 40 and 70 are moderate. Scores below 40 are high risk. Risk factors include property age, market volatility, vacancy rates, and debt service coverage ratio.
For our Cleveland duplex, the Risk Score is 72. The property is 50 years old (roof and HVAC concerns), but the neighborhood has stable employment and growing rents. The calculator flags the age but doesn’t kill the deal.
You can adjust risk tolerance — which you can adjust in the settings. Aggressive investors might accept scores as low as 50. Conservative investors should stick with 70+.
2026 ROI Benchmarks
What good looks like in today’s market.
| Strategy | Metric | Good | Great | Elite |
|---|---|---|---|---|
| Long-Term Rental | Cash-on-Cash | 8–10% | 10–14% | 14%+ |
| Long-Term Rental | Total ROI | 10–12% | 12–16% | 16%+ |
| Fix & Flip | Total ROI | 20–30% | 30–50% | 50%+ |
| BRRRR | IRR | 15–20% | 20–30% | 30%+ |
| Short-Term Rental | Cash-on-Cash | 10–14% | 14–20% | 20%+ |
These benchmarks assume 25% down, 7.5% conventional financing, and 30-year amortization. DSCR loans at 8.25% will reduce returns by 1–2%. Hard money at 12% will cut returns by 3–5% and is only suitable for flips or BRRRR with quick exits.
Market type matters. In secondary markets like Cleveland or Indianapolis, target higher cash-on-cash returns (10%+) because appreciation is lower. In primary markets like Austin or Nashville, accept lower cash flow (6–8%) in exchange for 5–7% annual appreciation.
Strategy Guide by Investor Type
Match your personality and capital to the right approach.
Beginners with $50,000–$100,000 cash: Start with long-term rentals in secondary markets. Use the Rental Property Calculator to analyze 10–20 deals before making an offer. Target 10%+ cash-on-cash with 25% down at 7.5%. Avoid hard money until you have 3–5 deals under your belt.
Experienced investors with $200,000+ cash: Mix strategies. Use BRRRR to recycle capital — buy with hard money, renovate, refinance into conventional, repeat. The BRRRR Calculator helps you model the full cycle. Target 20%+ IRR on BRRRR deals and 12%+ cash-on-cash on holds.
Flippers with construction experience: Focus on forced appreciation. Use the Fix and Flip Calculator to model ARV, rehab costs, and holding costs. Target 25%+ total ROI with 12% hard money. Exit within 6 months to avoid interest accumulation.
BRRRR specialists: You need a 20%+ discount to ARV after rehab. Use the Compare Deals tool to stack up multiple BRRRR opportunities. The calculator will show you which properties can cash flow after refinance.
Hybrid investors: Consider house hacking — buy a duplex, live in one unit, rent the other. You can get 3.5% down FHA financing (not available for pure investment properties). After one year, convert to full rental and refinance into conventional. The calculator handles this scenario if you input the initial owner-occupant terms.
Common Use Cases
Five real scenarios where the calculator saves you money.
Scenario 1: The Cleveland Duplex — $185,000 purchase, $46,250 down, $1,650 rent. The calculator shows 11.2% total ROI and 8.9% cash-on-cash. Verdict: Buy. Strategy: Rental. Risk Score: 72. You make the offer.
Scenario 2: The Overpriced Flip — $300,000 purchase with $50,000 rehab, ARV of $400,000. Hard money at 12% with 3 points. The calculator shows 18% total ROI — below the 20% threshold. Verdict: Caution. Strategy: Pass on flip, consider BRRRR if you can reduce purchase price to $270,000.
Scenario 3: The BRRRR Candidate — $150,000 purchase, $40,000 rehab, ARV of $250,000. Hard money at 12%. After refi at 75% LTV, you pull out $187,500 — more than your total investment of $190,000. The calculator shows 28% IRR. Verdict: Buy. Strategy: BRRRR. Risk Score: 65 (higher due to rehab risk).
Scenario 4: The Cash Flow Trap — $250,000 purchase in a growing market, $1,800 rent, 7.5% rate. Cash-on-cash is 4.2% — below the 8% threshold. Verdict: Pass. The calculator suggests waiting for a better deal or negotiating a lower price.
Scenario 5: The Portfolio Expansion — You own 5 rentals and want to add a sixth. The calculator compares your existing portfolio’s average return (9.5% CoC) against the new deal (11.2% CoC). It recommends buying because the new deal diversifies your market exposure.
Industry Conventions
How this calculator compares to industry standards.
The industry tools community has standardized real estate analysis for over a decade. Their calculators focus on cash flow, CoC return, and cap rate. The arvcalc the ROI calculator adds three features they don’t have: Verdict, Strategy Winner, and Risk Score.
The ROI vs IRR debate is real. IRR captures the time value of money and is essential for BRRRR and flip strategies. Use both.
Cap rate is another convention. The Cap Rate Calculator on arvcalc.com gives you net operating income divided by purchase price. For our duplex, NOI of $11,880 / $185,000 = 6.4% cap rate. That’s average for Cleveland. This tool uses cap rate as one input but doesn’t rely on it exclusively.
The industry standard for investment property analysis assumes 25% down, 7.5% interest, 30-year amortization, 8% vacancy, 40% expenses. These are the defaults in the calculator. Adjust them based on your specific market and property condition.
Limitations
Every calculator has blind spots. Here are six you need to know.
First, the calculator assumes linear appreciation. Real estate markets cycle — you could see 10% appreciation one year and 0% the next. The model smooths this out, which can overstate returns in flat markets and understate them in hot markets.
Second, operating expenses are estimates. A 40% expense ratio works for most properties, but a 1970s duplex with original plumbing might need 55%. Always get a home inspection and adjust the expense ratio accordingly.
Third, vacancy rates are averages. A single-family home in a strong market might have 2% vacancy. A duplex in a transitional area might have 15%. Use market-specific data from your local real estate investment association.
Fourth, the calculator doesn’t account for tax benefits. Depreciation, cost segregation, and 1031 exchanges can significantly improve after-tax returns. Consult a CPA for your specific situation.
Fifth, the Risk Score is based on property and market factors but doesn’t include personal risk tolerance. A 65 score might be fine for a seasoned investor but terrifying for a beginner. Use your judgment.
Sixth — and this is critical — the calculator is designed for investment property, not your primary residence. The 7.5% rates, 25% down, and tax assumptions don’t apply to owner-occupied homes. If you’re deciding whether to rent or buy your own home, use the Rent vs Buy Calculator instead.
Common Mistakes
Five errors that cost investors thousands.
Mistake one: Using the wrong interest rate. Investment property rates in 2026 average 7.5% for conventional, 8.25% for DSCR, and 12% for hard money. Don’t use owner-occupied rates (6.5%–7%) — they don’t apply to investment properties.
Mistake two: Ignoring closing costs. The calculator includes them by default, but many investors manually enter a down payment and forget to add 2–5% for closing. That $9,250 in closing costs on our duplex reduces cash-on-cash from 8.9% to 6.2% in year one.
Mistake three: Overestimating rent. New investors often use the highest rent comps they find. Use the average of three comparable properties, and apply an 8–12% vacancy factor. The calculator defaults to 8% vacancy — increase it if your market is seasonal.
Mistake four: Forgetting capital expenditures. The calculator includes a capex reserve of 5% of gross income. If your property has an aging roof, HVAC, or foundation issues, increase this to 10–15%. A new roof on a duplex costs $12,000–$18,000 — that can wipe out two years of cash flow.
Mistake five: Treating all deals the same. A 10% cash-on-cash return in Cleveland is solid. The same return in San Francisco is terrible because you’re missing out on appreciation. Use the Strategy Winner output to see which approach maximizes your specific deal.
FAQ
Answers to the eight most common questions about the calculator.
Is this calculator for my primary residence or investment property?
This calculator is designed exclusively for investment property analysis. It assumes 7.5%+ interest rates, 25% down payment, and rental income. If you’re analyzing a home you plan to live in, use the Rent vs Buy Calculator instead. Using investment property assumptions for a primary residence will give misleading results.
What does a “Buy” verdict mean?
A “Buy” verdict means the deal passes all three threshold metrics: cash-on-cash return above 8%, total ROI above 10%, and capital payback under 5 years. It doesn’t guarantee profit — you still need to verify all inputs with real data.
How is the Risk Score calculated?
The Risk Score combines property age (25% weight), market volatility (25%), vacancy rate (20%), debt service coverage ratio (20%), and expense ratio (10%). Scores above 70 are low risk, 40–70 are moderate, below 40 are high.
Can I use this for commercial real estate?
The calculator works best for residential properties with 1–4 units. For commercial (5+ units), use the Cap Rate Calculator which handles NOI-based valuation for larger properties.
What’s the difference between Total ROI and Cash-on-Cash?
Total ROI includes appreciation and principal paydown. Cash-on-Cash only includes actual cash received. Total ROI is always higher for long-term holds. Cash-on-Cash is more conservative and focuses on liquidity.
How do I adjust for DSCR loans?
In the financing section, change the interest rate to 8.25% and the down payment to 30%. DSCR loans typically require higher down payments and have slightly higher rates than conventional investment loans.
What if I’m using hard money?
Select “Hard Money” from the loan type dropdown. The calculator will apply 12% interest and 3 points. Hard money is best for flips and BRRRR deals with exit timelines under 12 months.
Disclaimer: This article is for educational purposes only and does not constitute financial, investment, legal, or tax advice. Real estate investing involves significant risk, including the potential loss of capital. All numbers, rates, and projections are illustrative examples and may not reflect your specific situation. Consult qualified financial, legal, and tax professionals before making any investment decisions.
Leave a Reply