Why Screening Rental Property Deals Matters
Most rental property deals that fail do so because the investor skipped the screening step. They fell in love with the property, trusted the listing agent’s pro forma, or ran one metric and called it good enough. Then reality hit — negative cash flow, a DSCR below 1.0, or a vacancy rate that ate every dollar of projected profit.
Learning to screen rental property deals quickly separates serious investors from those who burn through capital on bad acquisitions. A disciplined screening process takes 10 to 15 minutes per property and eliminates 80% of deals before you ever schedule a showing.
This guide covers the five metrics that matter most when you screen rental property deals, with real numbers, screening tiers, and worked examples. Use the free calculators at ArvCalc to run each metric on any deal you are evaluating.
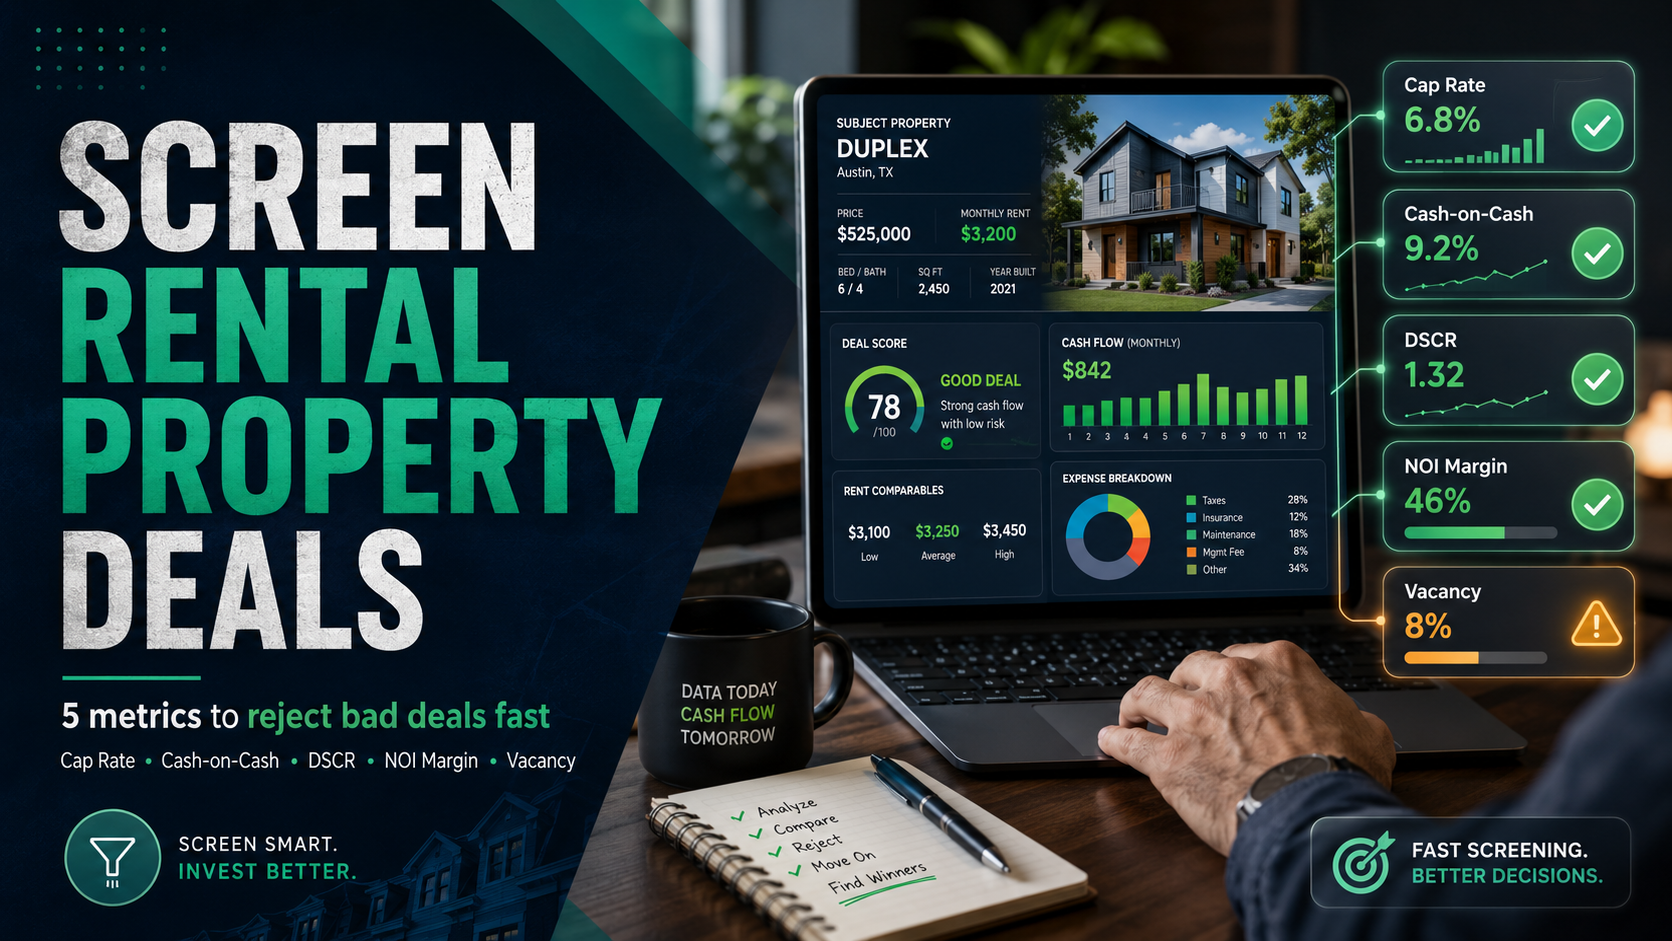
The 5 Metrics to Screen Rental Property Deals
Each metric answers a different question about the deal. Used together, they give you a complete picture in minutes.
1. Cap Rate — Is the Price Reasonable?
Cap rate measures the property’s return based on its net operating income and purchase price, independent of financing. It answers: “Am I paying a fair price for this income stream?”
Formula: Cap Rate = (Net Operating Income ÷ Purchase Price) × 100
| Cap Rate | Screening Tier | What It Signals |
|---|---|---|
| 8%+ | Strong | High yield — verify the income is real and sustainable |
| 6%–8% | Solid | Competitive return for stable markets |
| 4%–6% | Average | Typical for coastal cities and Class A properties |
| Below 4% | Weak | Hard to cash flow — only works for appreciation plays |
Example: A duplex in Indianapolis lists for $195,000 with $1,650/month gross rent. After operating expenses of $6,200/year, NOI is $13,600. Cap rate = $13,600 ÷ $195,000 = 6.97%. This passes the 6% minimum screen. Run it through the Cap Rate Calculator to stress-test at different price points.
Cap rate does not account for financing — two investors buying the same property at different down payments will have the same cap rate but very different cash-on-cash returns. That is why you need the next metric. For a deeper dive, read the Cap Rate Guide.
2. Cash-on-Cash Return — What Do I Earn on My Cash?
Cash-on-cash return measures your annual pre-tax cash flow as a percentage of the total cash you invested. This is the metric that tells you whether the deal is worth your capital.
Formula: Cash-on-Cash = (Annual Cash Flow ÷ Total Cash Invested) × 100
| Cash-on-Cash | Screening Tier | What It Signals |
|---|---|---|
| 10%+ | Excellent | Strong performer — move to full underwriting |
| 6%–10% | Good | Solid return, competitive with other investments |
| 3%–6% | Marginal | Thin margin — one bad month hurts |
| Below 3% | Poor | Barely better than a savings account |
Example: Using the Indianapolis duplex at $195,000 with 20% down ($39,000) plus $7,000 closing costs = $46,000 total cash invested. After mortgage payments on a $156,000 loan at 7%, annual cash flow is $2,448. Cash-on-cash = $2,448 ÷ $46,000 = 5.3%. This is marginal — the deal needs either a lower price, higher rent, or less down payment to pass. Test scenarios with the Cash-on-Cash Calculator.
3. DSCR — Will the Bank Approve This?
Debt Service Coverage Ratio tells you whether the property’s rental income covers the mortgage payment. DSCR lenders require a minimum of 1.0 to 1.25. Below 1.0 means you subsidize the property out of pocket every month.
Formula: DSCR = Gross Rent ÷ PITIA (Principal + Interest + Taxes + Insurance + Association)
| DSCR | Screening Tier | What It Signals |
|---|---|---|
| 1.25+ | Strong | Qualifies for best DSCR loan pricing |
| 1.10–1.25 | Acceptable | Passes most lenders, standard rates |
| 1.00–1.10 | Borderline | May need higher down payment or rate buydown |
| Below 1.00 | Fail | Property loses money monthly — walk away or renegotiate |
Example: The Indianapolis duplex rents for $1,650/month. PITIA on a $156,000 loan at 7% = P&I $1,038 + taxes $163 + insurance $108 = $1,309/month. DSCR = $1,650 ÷ $1,309 = 1.26. This passes the 1.25 threshold — the deal qualifies for competitive DSCR loan terms. Verify your numbers with the DSCR Calculator.
4. NOI Margin — How Efficient Is This Property?
NOI margin shows what percentage of gross rental income survives after operating expenses. A higher margin means the property is more resilient to rent drops or expense increases.
Formula: NOI Margin = (NOI ÷ Gross Rental Income) × 100
| NOI Margin | Screening Tier | What It Signals |
|---|---|---|
| 60%+ | Excellent | Low expenses relative to income — strong operator |
| 45%–60% | Good | Typical for well-managed single-family and small multi |
| 35%–45% | Average | Expenses are high — look for cost reduction opportunities |
| Below 35% | Weak | Expense-heavy property — verify taxes, insurance, PM fees |
Example: Gross rent $19,800/year, operating expenses $6,200/year, NOI $13,600. NOI margin = $13,600 ÷ $19,800 = 68.7%. Excellent. This duplex has low operating costs relative to its income. Run detailed expense breakdowns with the NOI Calculator.
5. Vacancy Rate — How Risky Is the Market?
Vacancy rate reflects how much rental income you lose to empty units. High vacancy kills cash flow faster than any other factor because you still pay the mortgage, taxes, and insurance on an empty property.
Formula: Vacancy Rate = (Vacant Days ÷ Total Days) × 100
| Vacancy Rate | Screening Tier | What It Signals |
|---|---|---|
| Below 5% | Excellent | Strong rental demand — tight market |
| 5%–8% | Good | Healthy market with normal tenant turnover |
| 8%–12% | Elevated | Softer demand — budget higher vacancy reserves |
| Above 12% | High Risk | Oversupplied market or problem property |
The U.S. Census Bureau Housing Vacancies Survey reports national rental vacancy at 6.4% as of Q1 2026. Markets like Indianapolis, Memphis, and Columbus typically run 5%–7%. Coastal cities like San Francisco and New York often run below 4%. Check local vacancy data before assuming a number. The Vacancy Rate Calculator models how different vacancy assumptions affect your cash flow.
Quick Screening Checklist
When you screen rental property deals, run all five metrics before doing any deeper analysis. Here is a pass/fail reference:
| Metric | Minimum to Pass | Target | Calculator |
|---|---|---|---|
| Cap Rate | 5% | 7%+ | Cap Rate |
| Cash-on-Cash | 4% | 8%+ | Cash-on-Cash |
| DSCR | 1.0 | 1.25+ | DSCR |
| NOI Margin | 40% | 55%+ | NOI |
| Vacancy Rate | Below 10% | Below 6% | Vacancy |
A deal that passes all five screens deserves full underwriting — property inspection, rent comps verification, title search, and detailed financial modeling. A deal that fails two or more screens is almost always a pass.
Red Flags That Kill Deals
Even if the metrics look good on paper, watch for these warning signs when you screen rental property deals:
Seller-reported income that cannot be verified. Ask for 12 months of bank statements or tax returns showing actual rental income. Pro forma numbers from listing agents assume 100% occupancy and above-market rents. Trust the HUD Fair Market Rent data over the seller’s word.
Property taxes about to spike. When a property sells, the county often reassesses the property tax based on the sale price. A property currently taxed at $2,000/year on a $120,000 assessment may jump to $3,500/year after a $200,000 sale. This alone can flip a deal from cash-flow-positive to negative.
Deferred maintenance hiding in the numbers. A property with a 20-year-old roof, original HVAC, and aging plumbing may show strong NOI today — but one $15,000 roof replacement wipes out three years of cash flow. Budget for capital expenditures using the Rehab Cost Estimator.
Neighborhood with declining rents. If comparable rents have dropped 5%+ in the past year, your projected cash flow is built on a shrinking foundation. Check rent trends on Zillow Research before underwriting.
Insurance costs eating the margin. Properties in flood zones, hurricane-prone areas, or high-crime neighborhoods carry insurance premiums 2x to 4x the normal rate. This often does not show up in the listing — call an insurance broker before making an offer.
How to Screen Rental Property Deals in Practice
Here is the step-by-step process experienced investors follow:
- Get the listing price and gross rent. Calculate cap rate in your head: if monthly rent × 12 ÷ price is below 5%, move on immediately unless you are buying for appreciation.
- Estimate operating expenses. Use 35%–45% of gross rent as a quick estimate for taxes, insurance, maintenance, vacancy, and management. This gives you a rough NOI.
- Run the DSCR Calculator. Enter gross rent and estimated PITIA. If DSCR is below 1.0, the deal does not work at this price — calculate what price would make it work.
- Calculate cash-on-cash return. Enter your expected down payment and closing costs into the Cash-on-Cash Calculator. If the return is below 4%, the capital is better deployed elsewhere.
- Check local vacancy data. Search for your target city’s rental vacancy rate. If it exceeds 10%, increase your vacancy reserve to 12%+ and rerun the numbers.
- If all five metrics pass, do full underwriting. Order an inspection, verify rents with comparable listings, pull title, and model the deal in the Rental Property Calculator with detailed inputs.
This process lets you screen rental property deals at speed. Most investors who adopt this system review 20 to 30 properties per week and make offers on 1 to 3.
Worked Example: Screening a Memphis Triplex
A triplex in Memphis lists for $235,000 with three units renting at $850, $825, and $800/month ($2,475/month total, $29,700/year gross).
| Metric | Calculation | Result | Pass? |
|---|---|---|---|
| Expenses (est. 40%) | $29,700 × 0.40 | $11,880 | — |
| NOI | $29,700 − $11,880 | $17,820 | — |
| Cap Rate | $17,820 ÷ $235,000 | 7.6% | Yes (target 7%+) |
| NOI Margin | $17,820 ÷ $29,700 | 60.0% | Yes (target 55%+) |
| Loan ($188K @ 7.25%) | P&I + Tax + Ins | $1,632/mo | — |
| DSCR | $2,475 ÷ $1,632 | 1.52 | Yes (target 1.25+) |
| Cash Invested (20% + closing) | $47,000 + $7,000 | $54,000 | — |
| Annual Cash Flow | $17,820 − ($1,632 × 12) | −$1,764 | — |
| Cash-on-Cash | −$1,764 ÷ $54,000 | −3.3% | No |
Wait — cap rate and DSCR pass, but cash-on-cash is negative? That is because NOI estimated at 40% of gross is used for cap rate, but the mortgage payment exceeds the NOI. Let me recalculate with actual expenses:
Actual PITIA: P&I on $188,000 at 7.25% 30yr = $1,282/mo. Taxes $294/mo. Insurance $142/mo. Total PITIA = $1,718/mo.
Cash flow = $2,475 − $1,718 − vacancy 7% ($173) − maintenance 8% ($198) − PM 10% ($248) = $138/month = $1,656/year.
Cash-on-Cash = $1,656 ÷ $54,000 = 3.1%. Marginal but positive. This deal passes the screen narrowly — worth full underwriting if the neighborhood fundamentals are solid.
Disclaimer
This article and the referenced calculators are for educational purposes only. Results are estimates based on user-entered assumptions and do not constitute financial, investment, tax, legal, or lending advice. Actual property performance depends on factors not captured in screening metrics, including property condition, tenant quality, local regulations, and market cycles. Consult a licensed real estate professional and financial advisor before making investment decisions. ArvCalc is not a broker, lender, or financial advisor.
Check all five core metrics: cap rate, cash-on-cash return, DSCR, NOI margin, and vacancy rate. Each answers a different question about the deal. A property might have a strong cap rate but fail on DSCR because of high property taxes. Running all five takes 10 to 15 minutes and prevents costly mistakes.
Start with a mental cap rate calculation: monthly rent times 12 divided by the asking price. If the result is below 5%, skip the property unless you are investing for appreciation only. For deals that pass this first filter, run DSCR and cash-on-cash through a calculator. The entire process takes under 10 minutes per property.
For buy-and-hold rental properties in stable markets, target a minimum 6% cap rate. Properties in high-growth metros like Nashville or Austin may trade at 4% to 5% cap rates with the expectation of rent growth and appreciation. In Midwest markets like Cleveland, Indianapolis, and Memphis, 7% to 10% cap rates are common. The right cap rate depends on your risk tolerance and investment goals.
Most DSCR lenders require a minimum ratio of 1.0, meaning the property’s rent must at least equal the mortgage payment (PITIA). To get the best interest rates and terms, target a DSCR of 1.25 or higher. Some lenders offer loans at DSCR below 1.0, but these carry significantly higher rates and lower LTV limits.
Yes. In expensive coastal markets, cap rates of 3% to 5% are normal, and cash-on-cash returns below 4% are common. Investors in these markets rely more on appreciation and rent growth than current cash flow. Adjust your screening thresholds accordingly — but never accept a DSCR below 1.0, regardless of market.
Use 35% to 45% of gross rental income as a quick expense estimate. This covers property taxes, insurance, vacancy, maintenance, and property management. Single-family properties in low-tax states trend toward 35%. Older multifamily properties in high-tax states trend toward 45% or higher. For full underwriting, break expenses into line items using actual local tax rates and insurance quotes.
Most investors target 8% or higher for a buy-and-hold rental. Returns of 4% to 8% are acceptable if the property offers appreciation potential or strategic portfolio value. Below 4% suggests the capital would earn more in alternative investments. BRRRR deals that recover all invested cash produce infinite cash-on-cash returns by definition, which is why the strategy is popular despite its complexity.
Leave a Reply