Last updated: October 7, 2026 · Originally published: July 19, 2026 · By Alex Petrov
Every real estate investor hits the same wall at some point: you find a rental property, the numbers look fine on the surface, but you have no idea whether the asking price is anywhere close to what the asset is actually worth. That gap between price and value is where deals are made or lost.
Fair market value of rental property is the price a willing, knowledgeable buyer would pay a willing, knowledgeable seller when neither party is under pressure to close. It sounds simple, but arriving at a credible number requires blending three distinct valuation approaches, reading local market data carefully, and understanding exactly which income and expense figures drive the math.
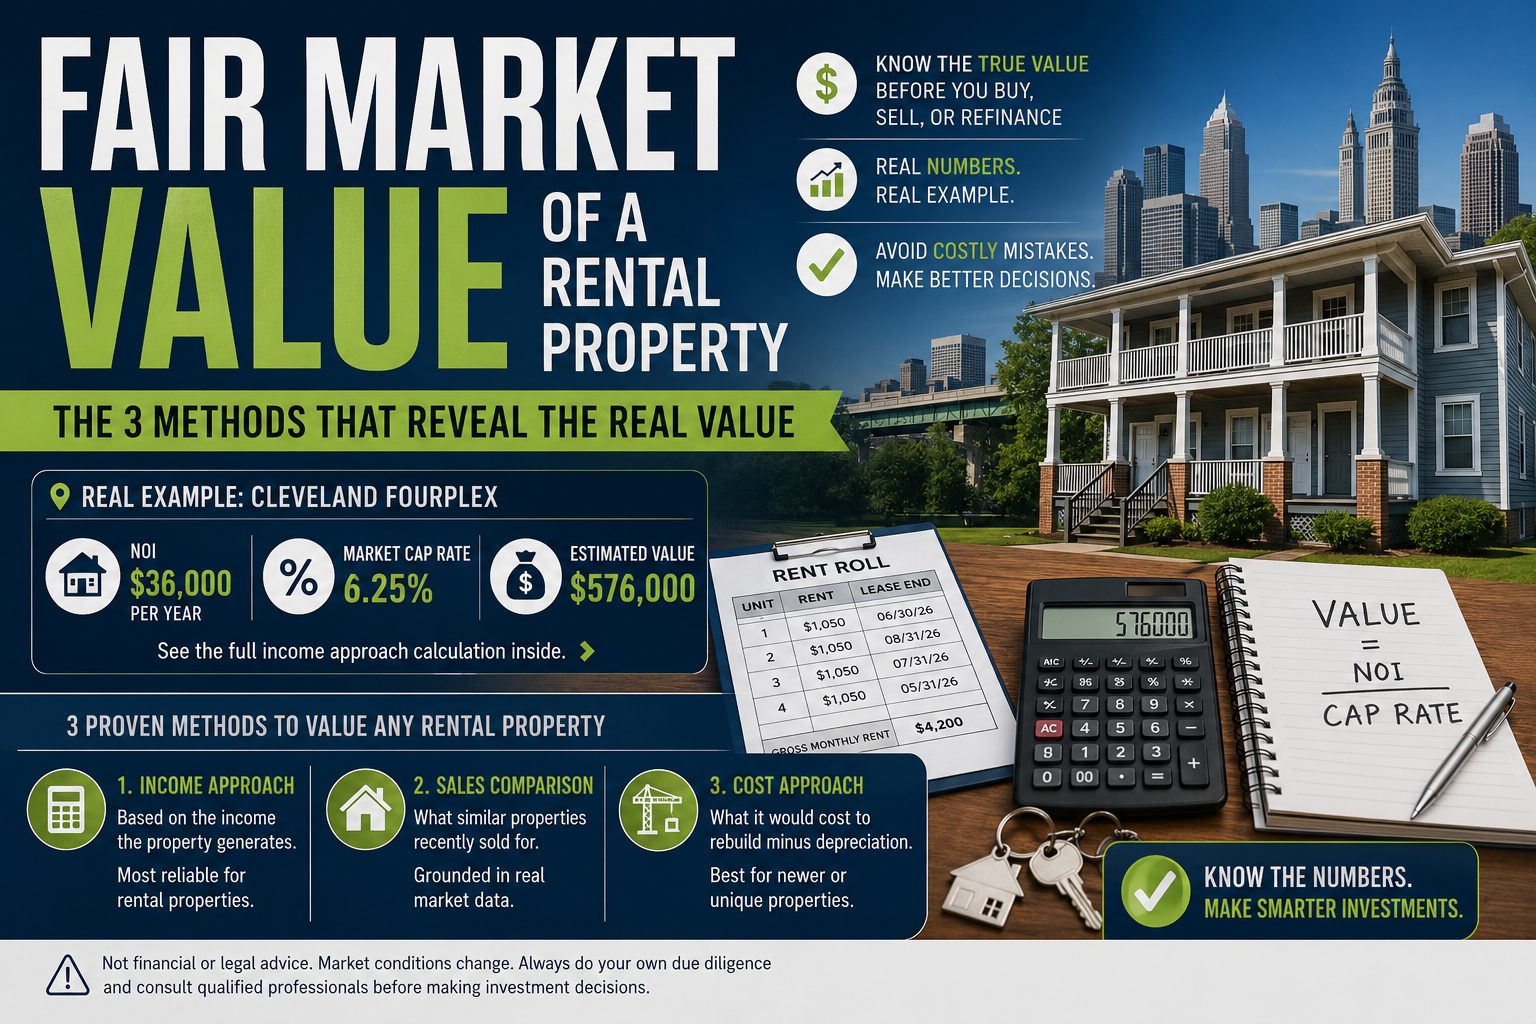
This guide walks you through all three fair market value rental property methods, works through a realistic fourplex example in Cleveland, and flags the mistakes that send investors chasing the wrong number.
What Is Fair Market Value Rental Property Worth?
The IRS defines fair market value as “the price at which the property would change hands between a willing buyer and a willing seller, neither being under any compulsion to buy or to sell and both having reasonable knowledge of relevant facts.” That definition was written with estate and gift taxes in mind, but appraisers and courts use the same standard across every property type.
For income-producing real estate, the definition carries an extra layer of complexity. A rental property’s value is not just a function of bricks, location, and comparable sales — it is fundamentally tied to the income stream the property generates. A fourplex in a strong rental market is worth more than an identical structure sitting half-vacant, even if both are on the same street. That income sensitivity is why professional appraisers almost always lead with the income approach when determining fair market value rental property of two units or more.
Fair market value matters in more situations than most investors realize: purchase negotiations, refinancing, estate settlement, property tax appeals, divorce proceedings, 1031 exchanges, and insurance coverage all hinge on having a defensible FMV figure. Getting it wrong in any of those contexts costs real money.
The Appraisal Institute trains and certifies the professionals who produce formal appraisals, but investors do not need a certified appraisal to think clearly about value. Understanding the three underlying approaches gives you a framework to sanity-check any fair market value rental property number a broker, seller, or lender puts in front of you.
The Income Approach: The Engine of Rental Property Valuation
The income approach treats a rental property the way a stock analyst treats a dividend-paying equity: fair market value rental property is a function of the income the asset produces relative to the return rate investors demand in that market. The fair market value rental property formula is:
Value = Net Operating Income ÷ Capitalization Rate
Both inputs require careful construction.
Building Net Operating Income (NOI)
Net operating income is the cash a property generates after operating expenses but before debt service and income taxes. You start with gross potential rent — what the property would earn at 100% occupancy at market rents — then subtract vacancy and credit losses, then subtract all operating expenses.
Operating expenses that reduce NOI include property taxes, insurance, property management fees (typically 8%–12% of collected rent), maintenance and repairs, utilities paid by the owner, landscaping, and a capital expenditure reserve for big-ticket items like roofs and HVAC systems. What does not reduce NOI: mortgage principal and interest, depreciation, and income taxes. Those are financing and tax items, not operating items.
Many sellers present pro forma rent rolls that reflect optimistic assumptions — low vacancy, no management fee if self-managed, minimal repairs. Always reconstruct NOI from market data, not the seller’s spreadsheet. Our NOI calculator lets you build this figure from scratch so you see exactly which line items move the needle.
Selecting the Capitalization Rate
The cap rate is the return investors in a specific market currently accept for a specific property type. It is derived from recent comparable sales: divide each property’s NOI by its sale price, and the resulting percentage is that property’s implied cap rate. Average several recent sales of similar properties in the same submarket and you have a reasonable market cap rate.
Cap rates vary enormously by location and asset class. Urban multifamily in gateway cities like New York or San Francisco has traded at 3%–4% cap rates in recent cycles. Secondary markets like Cleveland, Memphis, or Kansas City typically see 6%–8% on similar product. Higher perceived risk — older buildings, marginal neighborhoods, high vacancy — pushes cap rates up, which compresses value. Our cap rate calculator handles this math directly, and the deep dive at what is a good cap rate explains what ranges signal good versus mediocre deals.
Why the Formula Is Sensitive to Small Changes
The division relationship between NOI and cap rate creates significant leverage on value. A property generating $36,000 in NOI:
- At a 6% cap rate = $600,000 value
- At a 7% cap rate = $514,286 value
- At an 8% cap rate = $450,000 value
A one-point shift in cap rate changes value by roughly 14%–17% in this example. Similarly, a $3,000 annual change in NOI — less than $250/month — moves value by $37,500–$50,000 depending on where cap rates sit. This is why precise expense modeling matters so much. The guide to estimating rental property income covers the revenue side of this equation in detail.
The Sales Comparison Approach
The sales comparison approach to fair market value rental property analysis is the method most buyers instinctively reach for first because it mirrors how residential home values are set: find recent sales of similar properties, make adjustments for differences, and arrive at an indicated value for the subject property.
For small rental properties — two to four units — this approach carries real weight because buyers in that segment are often a mix of owner-occupants and small investors, and the market price reflects both groups’ bidding. For larger apartment buildings, the income approach tends to dominate, and the sales comparison serves as a check rather than a primary indicator.
Meaningful comparables share several characteristics with the subject property:
- Same general submarket (ideally within one to three miles in urban areas)
- Similar unit count or gross building size
- Comparable construction vintage and condition
- Closed within the past six to twelve months
- Similar unit mix (all two-bedrooms versus a mix of studios and two-bedrooms, for example)
Once you have three to five solid comparables, adjustments are applied for differences: a subject property with renovated kitchens gets a positive adjustment if comps have original finishes, additional parking adds value, a busy street in front subtracts it. These adjustments are inherently judgmental, which is one reason two appraisers looking at the same evidence can arrive at values that differ by 5%–8%.
When reviewing broker price opinions or appraisals, check whether the comps selected actually sold or merely listed. Listed prices tell you what sellers hope to get; sold prices tell you what the market will bear.
The Cost Approach
The cost approach estimates value by asking: what would it cost to build this exact structure today, minus physical depreciation, plus the land value? The formula is:
Value = Land Value + Replacement Cost New − Accrued Depreciation
This approach is most reliable for newer properties or specialty assets where income data and comparable sales are thin. For a ten-year-old apartment building in a market with plenty of transaction volume, the cost approach usually serves as a check rather than the primary indicator — mainly because depreciation estimates on older buildings become increasingly subjective.
Construction costs vary sharply by location. Multifamily construction in the Midwest might run $120–$160 per square foot for a simple wood-frame building; the same structure in coastal California can cost $250–$350 per square foot or more once labor, permits, and material costs are factored in. Land values are determined by extracting them from nearby vacant land sales or by backing them out of known improved-property transactions where the improvement’s value can be independently estimated.
Investors most often encounter the cost approach in insurance contexts: replacement cost coverage on a rental property is necessaryly the cost approach without the land (since land does not burn down). Understanding this distinction matters if you are trying to right-size your policy.
Worked Example: Cleveland Fourplex — Fair Market Value Rental Property Analysis
Let’s put all three approaches to work on a realistic property: a 1968-built fourplex in Cleveland’s Old Brooklyn neighborhood, currently asking $385,000.
Property Details
- 4 units: all 2-bedroom/1-bath, approximately 850 square feet each
- One unit currently vacant
- Market rent: $950/month per unit (confirmed from current listings)
- Seller-reported gross rents: $3,400/month (three occupied units at below-market $933 average)
- Year built: 1968, updated mechanicals, original kitchens and baths
- Lot size: 6,000 sq ft, 2 off-street parking spaces
Income Approach
We build NOI from market rents, not current actuals, because we are valuing the property at stabilized occupancy.
| Item | Annual Amount |
|---|---|
| Gross Potential Rent (4 × $950 × 12) | $45,600 |
| Less Vacancy & Credit Loss (7%) | ($3,192) |
| Effective Gross Income | $42,408 |
| Property Taxes | ($4,200) |
| Insurance | ($2,400) |
| Property Management (10%) | ($4,241) |
| Maintenance & Repairs | ($3,600) |
| Water/Sewer (owner-paid) | ($2,400) |
| CapEx Reserve ($100/unit/month) | ($4,800) |
| Landscaping/Snow Removal | ($900) |
| Total Operating Expenses | ($22,541) |
| Net Operating Income | $19,867 |
Market cap rates for fourplexes in Old Brooklyn currently run 6.5%–7.5% based on recent comparable sales. Using the midpoint of 7.0%:
Value = $19,867 ÷ 0.07 = $283,814
At 6.5%: $305,646. At 7.5%: $264,893. The income approach range is roughly $265,000–$306,000.
Sales Comparison Approach
Three recent fourplex sales in adjacent Cleveland neighborhoods:
- Comp 1: $310,000 — renovated units, same vintage, sold 4 months ago
- Comp 2: $270,000 — similar condition to subject, sold 7 months ago
- Comp 3: $295,000 — one additional parking space, sold 9 months ago
After adjusting for the subject’s original kitchens (negative) and below-average parking (negative), the sales comparison approach indicates a value of approximately $275,000–$290,000.
Cost Approach
- Replacement cost new: 3,400 sq ft × $145/sq ft = $493,000
- Less physical depreciation (58 years, economic life 60 years): approximately $476,000 in depreciation leaves minimal improvement value
- Land value: $45,000 (from vacant lot sales nearby)
- Indicated value: approximately $62,000
The cost approach produces a low number here because the building is nearly fully depreciated — this result is typical for older rental properties and is given little weight. The indicator confirms the income and sales approaches are carrying the analysis.
Reconciled Value
Weighting the income approach most heavily (60%), the sales comparison approach meaningfully (35%), and the cost approach lightly (5%), the reconciled fair market value lands around $282,000–$295,000.
The asking price of $385,000 implies a cap rate of roughly 5.2% on market NOI — well below what this submarket supports. Either the seller is betting on above-market rent assumptions, or the price needs to come down substantially. Use the rental property calculator to model different purchase prices against this NOI and see how your returns shift. The full analysis framework is covered at how to analyze rental property.
When Fair Market Value of Rental Property Matters Most
FMV is not just a number for purchase negotiations. Here are the situations where having a well-supported value figure changes outcomes:
Financing and Refinancing
Lenders order appraisals that establish the FMV used to calculate loan-to-value ratios. If the appraisal comes in below the contract price, the lender will base the loan on the appraised value, not the purchase price — the buyer must cover the gap in cash or renegotiate. On a refinance, a higher FMV means more available equity to pull out.
Property Tax Appeals
Assessors often overvalue income property, particularly when they rely on automated valuation models that ignore vacancy and expense realities. A documented income approach analysis, with market-derived cap rates and detailed expense data, can support a tax appeal and reduce your annual bill. The guide on calculating property value from rental income lays out exactly the documentation you need.
1031 Exchanges
In a 1031 exchange, both the relinquished property and the replacement property need values that support the exchange structure and avoid boot. An informal but defensible FMV analysis helps you identify replacement properties that genuinely work at the price being asked.
Estate Planning and Settlement
The IRS requires FMV reporting for rental properties transferred as gifts or as part of an estate. Defensible appraisals reduce audit exposure. The IRS guidance links the standard directly to the willing buyer/willing seller test, which is why the income approach — the most market-derived method — carries weight with examiners.
Divorce and Partnership Dissolution
When jointly held rental property must be divided or bought out, FMV determines what one party owes the other. Courts regularly appoint independent appraisers, but both sides benefit from understanding how the number is constructed before negotiations start.
Insurance Coverage Review
Rental property insurance covers replacement cost, not market value — but market value gives you a ceiling check. If your policy’s replacement cost coverage is significantly above market value, you may be over-insured. If it’s well below what it would cost to rebuild, a total loss could leave you short. The property cash flow calculator can help you model insurance cost as a line item and test its impact on returns.
4 Mistakes When Estimating Fair Market Value Rental Property
Mistake 1: Using Seller’s Pro Forma NOI Without Verification
Sellers routinely present optimistic income projections: full occupancy, minimal expenses, no management fee because “it manages itself.” Every single line item on a pro forma should be verified against actual leases, local rent surveys, tax bills, insurance declarations pages, and utility records. Build your own NOI from scratch. The gap between seller-presented NOI and verified NOI is often 15%–25%, which translates directly into overpayment at any given cap rate.
Mistake 2: Ignoring Capital Expenditure Reserves
CapEx reserves — money set aside for future roof replacements, HVAC systems, plumbing work, and major renovations — are a real operating cost even if no major expense occurs this year. Many investors omit this line item entirely, which overstates NOI and inflates the apparent value of the property. A common rule of thumb is $100–$150 per unit per month for properties over 15 years old, higher for buildings with deferred maintenance.
Investopedia’s explanation of capital expenditures covers why these must be treated differently from routine operating expenses and why they still belong in your value analysis even though they don’t technically reduce NOI in the traditional definition.
Mistake 3: Applying National or City-Wide Cap Rate Averages
Cap rates are hyperlocal. A 6.5% average cap rate for “Cleveland multifamily” masks enormous variation between, say, Ohio City (lower cap rates, higher rents, more appreciation) and Glenville (higher cap rates, more cash flow, higher risk). Using the wrong cap rate denominator shifts your value estimate by tens of thousands of dollars. Source cap rates from closed sales within two to three miles of your subject property, not from national reports or broker marketing materials.
Mistake 4: Confusing Assessed Value With Market Value
Tax assessed value is set by a government assessor using mass appraisal techniques applied to an entire jurisdiction. In many markets, assessed value lags true market value by one to three years or more. In other markets, it’s set at a fixed percentage of market value (60%, 80%, etc.) and doesn’t represent FMV directly. Never use assessed value as a proxy for fair market value without understanding how your specific county calculates assessments. It can be wildly off in either direction.
Frequently Asked Questions
In practice, a certified appraisal is simply a formal, documented estimate of fair market value produced by a licensed professional. The standard being applied — the willing buyer/willing seller test — is the same. The difference is in the evidence, methodology documentation, and legal defensibility. An appraisal carries weight in court, with lenders, and with the IRS in a way that an investor’s informal analysis does not. For your own underwriting, however, the analytical process is identical.
Yes, for your own investment analysis. Using the income approach — dividing stabilized NOI by a market-derived cap rate — is a legitimate method any investor can apply. Supplement it with sales comparison data from your county assessor’s records or MLS and you have a reasonable value range. You cannot, however, submit a self-prepared analysis in place of a certified appraisal for lender or legal purposes. For those situations, you need a licensed appraiser.
Use cap rates derived from recent closed sales of comparable rental properties in the same submarket — ideally three to five transactions from the past six to twelve months. Your county assessor’s database, MLS if you have access, or a local commercial broker can provide this data. Avoid using national average cap rates published in research reports; they reflect too broad a sample to be reliable for a specific property valuation. Our cap rate guide walks through what market ranges look like across different property types and markets.
Property tax is calculated by applying your jurisdiction’s assessment rate and millage rate to the property’s assessed value. If the assessor’s FMV estimate is too high — which happens regularly on income properties that have experienced rent declines or high vacancy — your tax bill is inflated. Filing a formal tax appeal with documented income and expense data, comparable sale evidence, and an income approach analysis can reduce your assessed value and lower your annual taxes. Many investors recoup several thousand dollars per year through successful appeals on properties where the assessment has drifted above true FMV.
Yes, in two ways. First, if renovations increase achievable rents — kitchen updates, bathroom refreshes, in-unit laundry — they raise NOI, which raises value under the income approach directly. Second, renovations can shift a property into a higher-quality tier that commands a lower (more compressed) cap rate from buyers, which further multiplies value. The classic value-add play works precisely because FMV is driven by income: buy at a higher cap rate (depressed NOI), renovate, raise rents, and sell at a lower cap rate on higher income. The spread between entry and exit cap rate, combined with the NOI increase, is where the equity is created.
Fair Market Value FAQ
What is the difference between fair market value and appraised value?
Fair market value is what a property would sell for in an open market between a willing buyer and seller. Appraised value is a professional appraiser’s estimate, often required by lenders. They are usually close but can differ by 5-10% depending on market conditions and the appraiser’s methodology.
How do I find fair market value for a rental property?
Three methods: (1) Comparable sales — find 3-5 similar recently sold properties within 1 mile. (2) Income approach — divide annual NOI by the market cap rate. (3) Online tools — Zillow, Redfin, and county assessor records provide estimates. The income approach is most accurate for investment property because it values the property based on what it earns.
Is fair market value the same as the listing price?
No. The listing price is what the seller asks for. Fair market value is what the property is actually worth based on data. Sellers often list 5-15% above fair market value, especially in seller’s markets. Always verify with comps and an income analysis before making an offer.
How does the income approach work for rental property valuation?
The income approach formula: Property Value = NOI / Cap Rate. If a property generates $48,000 in annual NOI and the market cap rate is 7%, the estimated value is $48,000 / 0.07 = $685,714. Use the cap rate calculator to run this analysis on any property.
How often should I reassess fair market value of my rental?
Annually at minimum — when property tax assessments arrive and when reviewing your portfolio. Also reassess before refinancing, selling, or adjusting rents. Market conditions can shift fair market value 3-8% in a single year.
Related Calculators and Guides
- Cap Rate Calculator — value property using the income approach
- NOI Calculator — calculate net operating income for any rental
- Rental Property Calculator — full cash flow and return analysis
- ARV Calculator — estimate after repair value from comps
- How to Find ARV: Comp Selection Guide
- Rental Property ROI: 4 Ways to Calculate Returns
- What Is a Good Cap Rate for Rental Property?
Leave a Reply