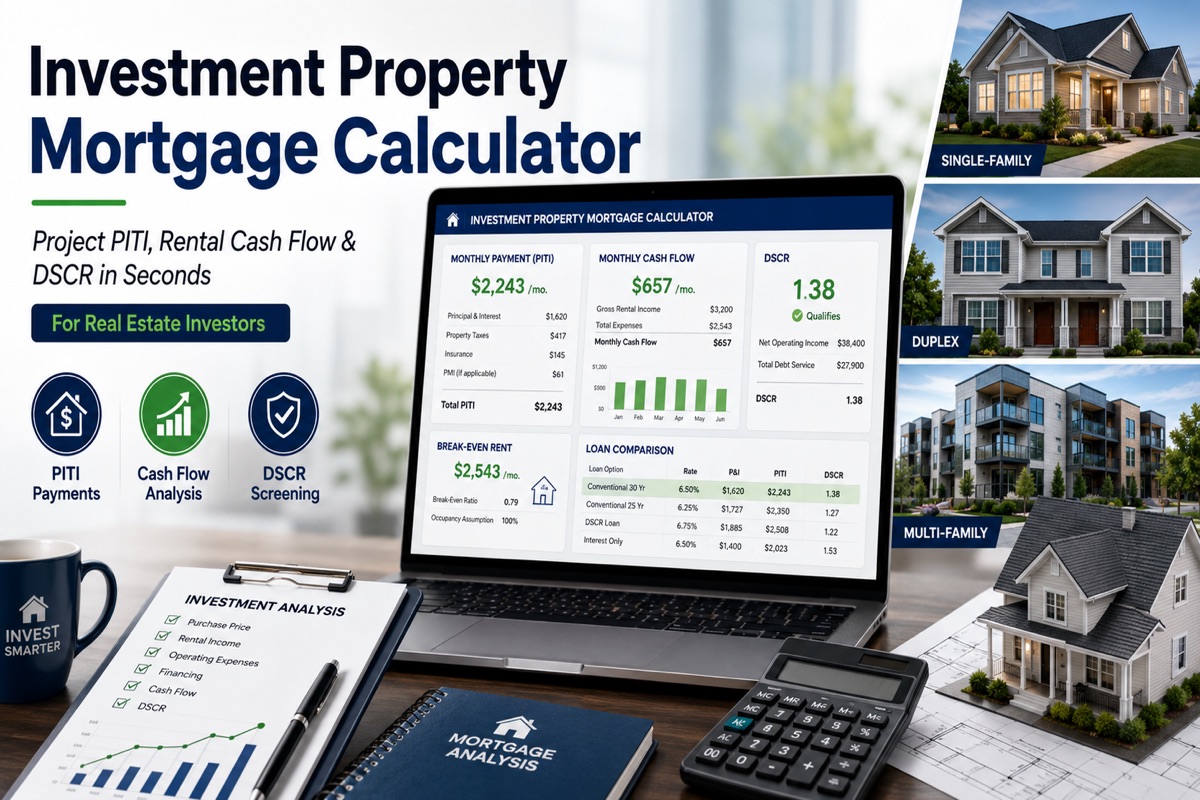
The Investment Property Mortgage Calculator helps real estate investors project the full monthly payment — principal, interest, taxes, and insurance — and estimate cash flow after rental income, all using 2026 investor mortgage rates rather than primary residence rates. In short, think of it as a rental property mortgage calculator and DSCR mortgage calculator rolled into one tool, built specifically for the way investors evaluate deals. Use the free Investment Property Mortgage Calculator to run your own numbers.
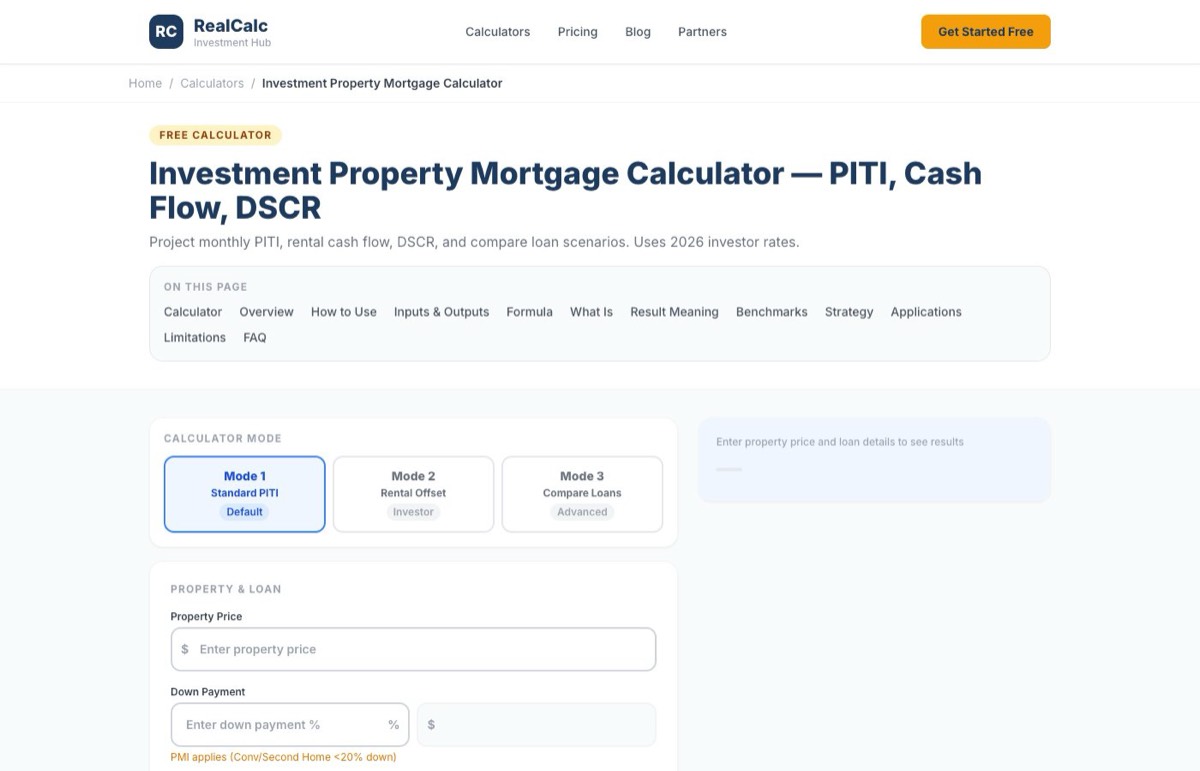
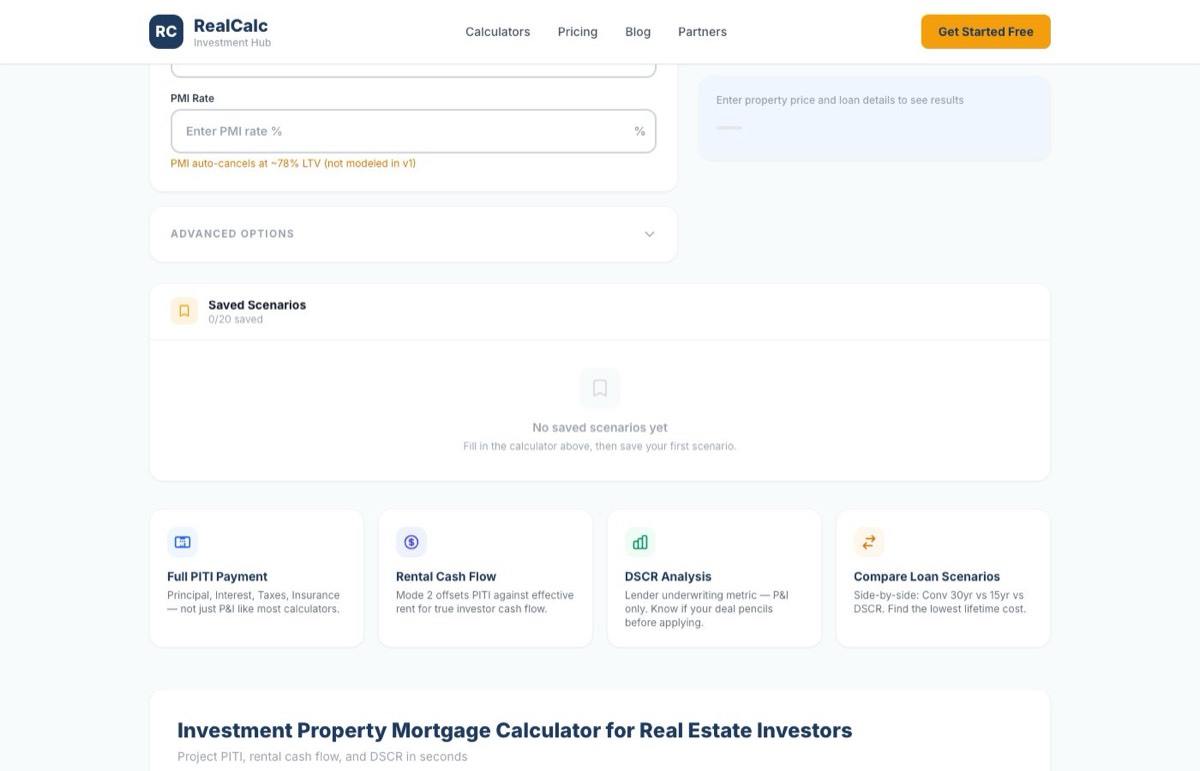
What sets this calculator apart from generic mortgage tools is the three-mode design. Mode 1 gives you a standard PITI breakdown — how much the property actually costs to carry each month.
Mode 2 adds rental income offset, showing Net Monthly Cash Flow (or Net Monthly Cost if the deal is negative), plus DSCR and Break-Even Rent. Mode 3 lets you compare two or three loan scenarios side by side — say, a 30-year Conventional against a DSCR loan against a 15-year term — and highlights the lowest-cost option. Each mode defaults to investor-appropriate rates (7.5% Conventional, 8.25% DSCR, 12% Hard Money), loan type variety that primary residence calculators don’t offer, and a two-tier analysis that separates lender risk from investor outcome.
This tool fits into a broader workflow. Start here to price the financing, then validate Year 1 operating cash flow in the Rental Property Calculator, project 10-year wealth in the Rental Property ROI Calculator, or check lender underwriting thresholds in the DSCR Calculator. If you’re comparing strategies — flip vs BRRRR vs rental hold — Compare Real Estate Deals brings everything together. The mortgage calculator handles the financing question; sibling tools handle the operating and strategic questions.
This calculator is designed for investment properties, not primary residences. It uses 2026 investor rates and 25% down payment defaults. All outputs are projections based on your inputs — not rate quotes or lender commitments.
On This Page
How to Use the Investment Property Mortgage Calculator
From property price to projected PITI and cash flow
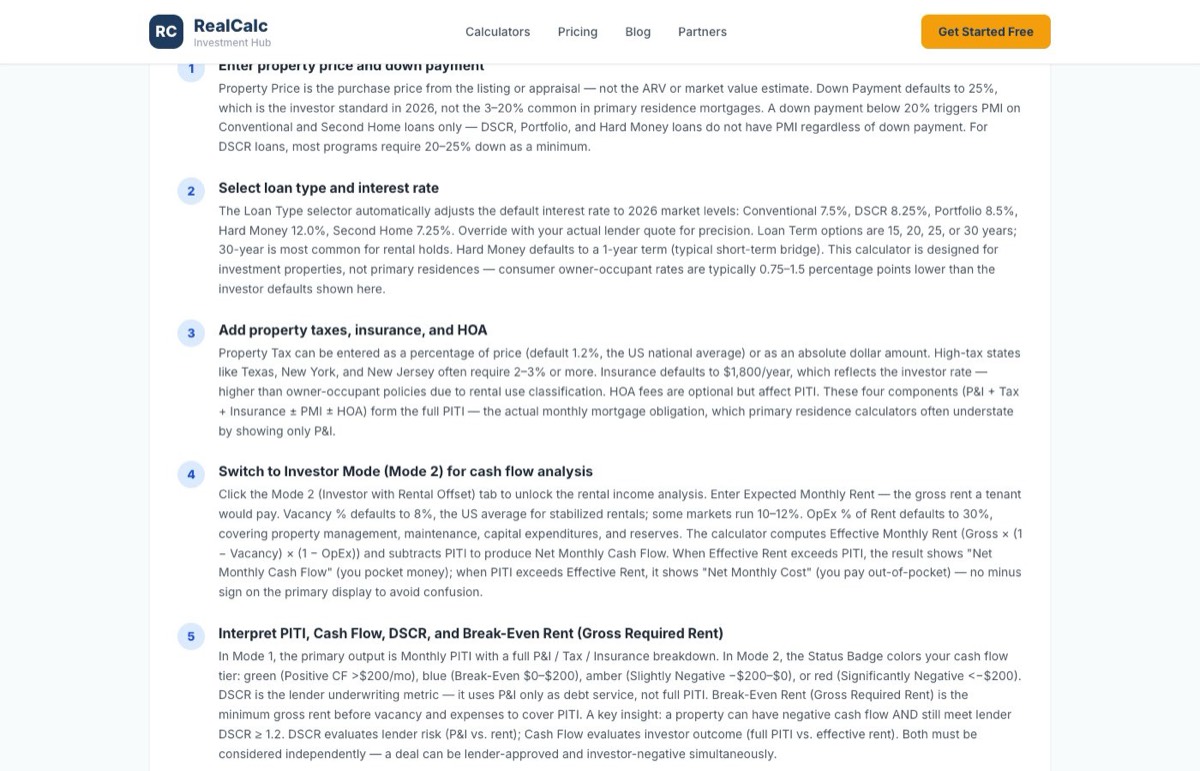
Step 1: Enter property price and down payment
First, start with the purchase price — what you’re actually paying, not the Zestimate or the ARV. Down payment defaults to 25%, which is the investor standard for most conventional investment property loans. Drop below 20% and PMI kicks in on Conventional loans, adding $100-$250/month to your carry cost. For DSCR loans, most lenders require 25% minimum regardless.
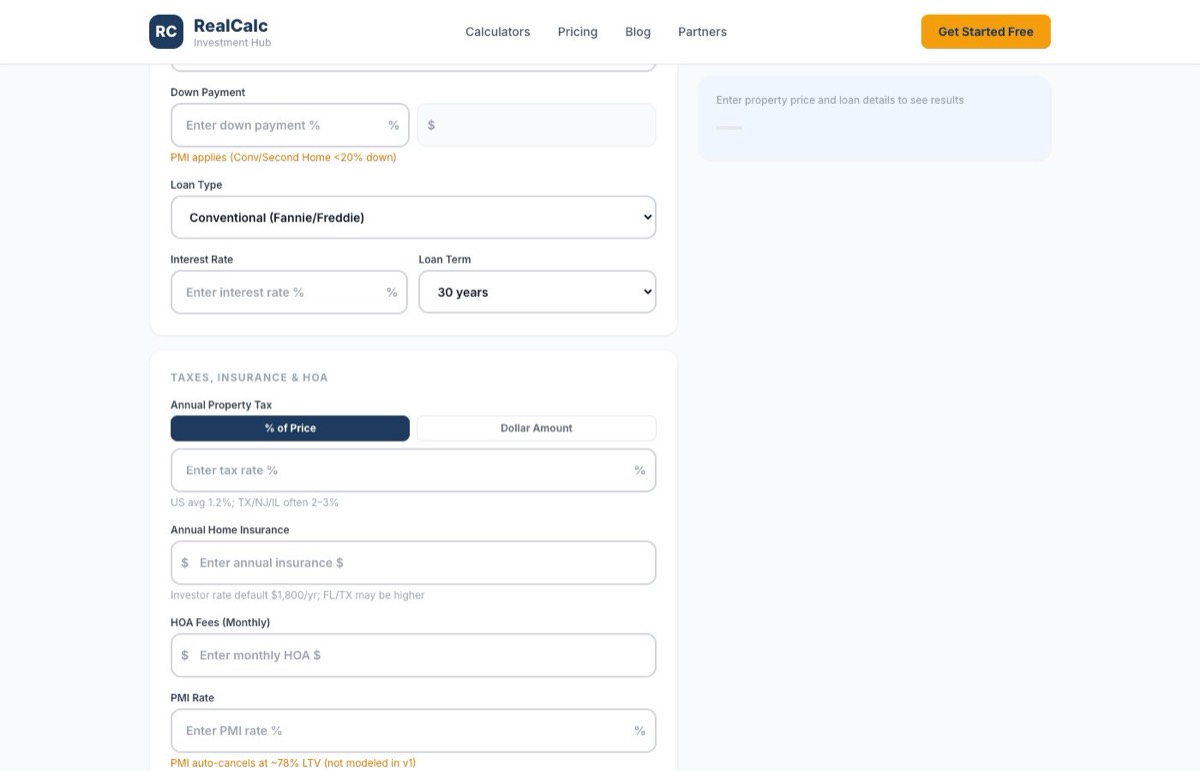
Step 2: Select loan type and interest rate
The Loan Type selector is where this calculator earns its name. Five options: Conventional (most common, personal income required), DSCR (qualifies on property income, no W-2 needed), Portfolio (relationship lenders, flexible terms), Hard Money (short-term bridge at 12%+), and Second Home (semi-owner-occupied, slightly lower rate). Rates auto-adjust by type — 7.5% for Conventional, 8.25% for DSCR, 12% for Hard Money in 2026. Override with your actual lender quote for precision. This calculator is designed for investment properties, not primary residences — consumer owner-occupant rates are typically 0.75-1.5 percentage points lower.
Step 3: Add property taxes, insurance, and HOA
Property tax defaults to 1.2% of price (the US average), but this varies wildly. Texas and New Jersey run 2-3%, while Hawaii and Colorado sit under 0.7%. Toggle between entering a dollar amount or a percentage — whichever you know. Insurance defaults to $1,800/year, reflecting investor rates that run higher than owner-occupant policies. HOA is optional. Together with P&I, these form your PITI — the full monthly payment that actually hits your account.
Step 4: Switch to Investor Mode (Mode 2) for cash flow analysis
Then, click the Investor with Rental Offset tab and enter your Expected Monthly Rent. Pull this from comparable leases within a mile, not Zillow estimates (which tend to run 5-15% optimistic). Vacancy defaults to 8% and Operating Expenses to 30% of gross rent — covering property management, repairs, capex reserves, and turnover costs. The calculator computes Effective Monthly Rent and subtracts PITI to show your Net Monthly Cash Flow. When the number is negative, it displays as “Net Monthly Cost” — how much you’re subsidizing the property each month out of pocket.
Step 5: Interpret PITI, Cash Flow, DSCR, and Break-Even Rent
As a result, your primary output in the investment property mortgage calculator Mode 2 is Net Monthly Cash Flow (or Net Monthly Cost). The status badge rates the deal: green for positive cash flow, blue for break-even, amber for slightly negative, red for significantly negative. Below that, DSCR shows whether a lender would fund the deal — 1.2 or higher is the typical threshold. Break-Even Rent (Gross Required Rent) tells you the minimum gross rent needed before vacancy and expenses to cover PITI.
And here’s what trips up most investors: projected profit is an estimate based on your assumptions. A property can have negative cash flow AND still meet lender DSCR requirements. DSCR evaluates lender risk using P&I only; Cash Flow evaluates your pocket using full PITI. Before committing capital, validate rental income with lease comparables and financing terms with your lender.
Pro Tips
Rate reality check. Investor rates run 0.75-1.5 percentage points above primary residence rates. If a lender quotes you a primary residence rate for an investment property, that’s a red flag — they may be underwriting incorrectly. Use 7.5% Conventional and 8.25% DSCR as your 2026 baseline.
Break-Even Rent is higher than you think. It’s almost always 30-40% above your PITI. A property with PITI of $2,023 needs gross rent of roughly $3,141 for zero cash flow at standard 8% vacancy and 30% operating expenses. Many first-time investors skip this math and discover the gap after closing.
DSCR and Cash Flow aren’t the same thing. A DSCR of 1.25 means the lender sees enough P&I coverage to fund the loan. But if property taxes and insurance push total PITI above effective rent, your monthly Cash Flow can still be negative. Always check both metrics — DSCR for approvability, Cash Flow for your bank account.
Compare before committing. Mode 3 puts two or three loan options side by side. A 15-year term has brutal monthly payments but slashes total interest in half. A DSCR loan has a higher rate but no income documentation. Ultimately, the right loan depends on your cash flow needs and long-term strategy — not the lowest monthly payment alone.
Choosing the Right Mode
Mode 1 — Standard Amortization (blue). Use when you want a classic PITI breakdown showing all four components. Best for understanding the raw carry cost before rental income enters the picture.
Mode 2 — Investor with Rental Offset (indigo). Use when you want to see whether rental income covers the mortgage. Shows Net Cash Flow, DSCR, Cash-on-Cash %, and Break-Even Rent. This mode is unique to investor tools — primary residence calculators don’t offer it.
Mode 3 — Compare Loan Scenarios (emerald). Use when you’re weighing two or three different loan options. Side-by-side comparison with the “Lowest Cost” winner highlighted. For full strategy comparison (flip vs BRRRR vs rental), use Compare Real Estate Deals instead.
Inputs and Outputs
What you enter, what the calculator projects
Inputs
| Input | Required | Default |
|---|---|---|
| Property Price | Yes | — |
| Down Payment % | Yes | 25% |
| Loan Term | Yes | 30 years |
| Interest Rate % | Yes | 7.5% (adjusts by loan type) |
| Loan Type | Yes | Conventional |
| Annual Property Tax | No | 1.2% of price |
| Annual Insurance | No | $1,800 |
| HOA Fees (monthly) | No | $0 |
| Expected Monthly Rent (Mode 2) | Mode 2 | — |
| Vacancy % (Mode 2) | No | 8% |
| OpEx % of Rent (Mode 2) | No | 30% |
| Extra Monthly Principal | No | $0 |
| Closing Costs % | No | 2% |
| Points Paid | No | 0 |
Outputs
| Output | Formula | Purpose |
|---|---|---|
| Monthly PITI | P&I + Tax/12 + Insurance/12 + PMI + HOA | Full monthly carry cost |
| Net Monthly Cash Flow | Effective Rent − PITI | Investor outcome (Mode 2) |
| Loan Amount | Price − Down Payment | Total borrowed |
| Total Cash to Close | Down Payment + Closing Costs | Cash needed at closing |
| Total Interest | Sum of all interest over loan life | Lifetime borrowing cost |
| Effective Monthly Rent | Gross × (1−Vacancy) × (1−OpEx) | Rent after vacancy and expenses |
| Annual Cash Flow | Net Monthly × 12 | Yearly investor return |
| Year 1 Cash-on-Cash % | Annual CF / Cash to Close × 100 | Return on cash invested |
| DSCR | Annual NOI / Annual P&I | Lender underwriting metric. NOT the same as Cash Flow — a property can meet DSCR and have negative Cash Flow simultaneously |
| Break-Even Rent (Gross Required Rent) | PITI / [(1−Vacancy) × (1−OpEx)] | GROSS rent BEFORE vacancy and expenses needed to cover PITI. Typically 30-40% higher than PITI |
How the Investment Property Mortgage Calculator Works
Amortization + PITI breakdown — with a worked Austin 2026 example
The Investment Property Mortgage Calculator applies the standard mortgage amortization formula to project monthly Principal and Interest, then adds property taxes, insurance, PMI (if applicable), and HOA fees for the full PITI payment. In Mode 2, it subtracts effective rental income — gross rent minus vacancy and operating expenses — to project Net Monthly Cash Flow. All defaults reflect planning-default investor rates, not primary residence rates.
The Formulas
Monthly P&I (Standard Amortization):
M = L × [r(1+r)^n] / [(1+r)^n − 1]
Where L = loan amount, r = monthly interest rate, n = total payments.
PITI:
Monthly PITI = P&I + Property Tax/12 + Insurance/12 + PMI (if applicable) + HOA
Cash Flow (Mode 2):
Effective Monthly Rent = Gross Rent × (1 − Vacancy %) × (1 − OpEx %)
Net Monthly Cash Flow = Effective Rent − PITI
DSCR:
DSCR = Annual NOI / Annual Debt Service (P&I only — taxes and insurance are NOT in debt service)
Break-Even Rent (Gross Required Rent):
Break-Even Rent = PITI / [(1 − Vacancy %) × (1 − OpEx %)]
Worked Example: Austin, TX — $300K Rental Property (2026)
A mid-range rental in Austin. Conventional 30-year loan at 7.5%, 25% down.
Inputs:
- Property Price: $300,000
- Down Payment: 25% ($75,000)
- Rate: 7.5%, 30-year fixed
- Property Tax: 1.2% ($3,600/year)
- Insurance: $1,800/year
- Rent: $2,500/month
- Vacancy: 8%, OpEx: 30%
Mode 1 — PITI Breakdown:
- Loan Amount: $225,000
- Monthly P&I: $1,573
- Monthly Tax: $300
- Monthly Insurance: $150
- Monthly PITI: $2,023 (no PMI — 25% down)
- Total Interest over 30 years: ~$340,300
Mode 2 — Cash Flow Analysis:
- Effective Monthly Rent: $2,500 × 0.92 × 0.70 = $1,610
- Net Monthly Cash Flow: $1,610 − $2,023 = −$413 (Net Monthly Cost)
- DSCR: $19,320 / $18,876 = 1.02
- Break-Even Rent (Gross Required Rent): $2,023 / (0.92 × 0.70) = $3,141/month
The $2,500 rent looks reasonable for Austin, but after 8% vacancy and 30% operating expenses, effective rent drops to $1,610 — leaving you $413 short of PITI every month. The DSCR of 1.02 sits below most lender minimums of 1.2. Both metrics tell the same story here: this deal doesn’t pencil at $300K with current rates. You’d need rent of $3,141 (26% higher) or a lower purchase price to break even.
In contrast, a different picture in a lower-cost Sunbelt market: a $200K property with $2,200 rent, 6% vacancy, and 25% OpEx produces PITI of roughly $1,349 and effective rent of $1,551 — positive cash flow of $202/month. Rent-to-price ratio drives the outcome more than rate alone.
What Is an Investment Property Mortgage?
How investor financing differs from primary residence mortgages
An investment property mortgage finances a property you don’t live in — a rental, a flip, a short-term vacation unit. The mechanics look similar to a primary residence loan, but the terms are materially different. Rates run 0.75-1.5 percentage points higher (lenders price in higher default risk during downturns). Down payments start at 20-25%, not 3-5%. Underwriting scrutinizes the property’s rental income or demands larger cash reserves. And interest is deductible against rental income (per IRS Publication 527) without the SALT cap that limits primary residence deductions. This calculator models the investor-specific cost structure from the start.
Two metrics matter more than any other for investor mortgages: DSCR and Cash Flow. DSCR — Debt Service Coverage Ratio — is the lender’s question: “Does the property’s net operating income cover the principal and interest?” It uses P&I only, excluding taxes and insurance from the denominator. Cash Flow is the investor’s question: “Does the deal put money in my pocket each month after everything?” It uses full PITI subtracted from effective rent.
The critical insight: a property can meet DSCR requirements (lender approves the loan) and still produce negative Cash Flow (you write a check every month). Consequently, this happens commonly in high-tax states like Texas, Illinois, and New Jersey, where property taxes push PITI well above P&I. Both metrics must be considered — one for financeability, the other for outcome.
The 2026 rate environment makes this distinction sharper. Investor rates averaging 7.5% Conventional and 8.25% DSCR sit 250-300 basis points above pre-2022 levels. Properties that cash-flowed comfortably at 5% rates now bleed money at 7.5%. The Break-Even Rent required has climbed 20-30% in many markets. DSCR loan programs have surged in popularity — they don’t require personal income documentation, which appeals to multi-property investors and the self-employed. Hard money at 12-14% remains viable only for short-term flips, never long-term holds. This calculator uses 2026 defaults so your projections reflect today’s market, not a distant memory of 3% rates.
What Your PITI, Cash Flow, and DSCR Mean
Interpreting the primary and secondary metrics
Your PITI is the full monthly payment — not just interest, not just principal and interest, but the complete cost of carrying this property. Cash Flow in Mode 2 shows what happens after rental income enters the picture. DSCR tells you whether a lender would touch the deal. All three together tell the financing story.
PITI — The Full Monthly Payment
- Principal (P): The portion reducing your loan balance — builds equity over time
- Interest (I): What the lender charges for lending — largest component in early years
- Taxes (T): Annual property taxes divided by 12
- Insurance (I): Homeowner insurance divided by 12
- PMI (if applicable): Only on Conventional/Second Home with less than 20% down
- HOA (if applicable): Condo or PUD association fees
However, many primary residence calculators show only P&I, which understates actual monthly cost by 20-40%. That gap has caught more than a few new investors off guard at their first closing.
Net Monthly Cash Flow Tiers (Mode 2)
- Cash Flow > $200/mo (GREEN): Property pays you every month after all costs. Sustainable hold.
- Cash Flow $0 to $200/mo (BLUE): Self-sustaining but thin. One vacancy month can tip it negative for the quarter.
- Cash Flow −$200 to $0/mo (AMBER): Modest monthly subsidy. May be acceptable if you’re buying for appreciation or equity build.
- Cash Flow < −$200/mo (RED): Significant monthly cost. Verify your rent assumptions and consider alternative financing or a lower purchase price.
DSCR Tiers (Lender Underwriting)
- DSCR ≥ 1.25: Conventional lender-friendly range
- DSCR 1.15-1.25: Most DSCR and Portfolio loan programs will approve
- DSCR 1.00-1.15: Marginal — may require higher down payment or reserves
- DSCR < 1.00: Below typical thresholds — rental income doesn’t cover P&I
DSCR vs Cash Flow — Both Matter
Here’s where most investors get tripped up. DSCR uses only P&I as debt service — it’s a lender underwriting metric that answers “Will the property income cover the mortgage payment?” Cash Flow uses full PITI — taxes, insurance, HOA, everything — subtracted from effective rent to answer “Will this deal actually put money in my pocket?”
A property in Houston with DSCR of 1.25 and Cash Flow of −$150/month is simultaneously lender-approvable and investor-negative. The lender sees enough P&I coverage. You see a $150/month drain. Both are correct. Both must be weighed.
Break-Even Rent (Gross Required Rent) — What It Tells You
This is the minimum gross rent — before vacancy and expenses eat into it — needed to cover your full PITI. It’s always higher than PITI, typically by 30-40% at standard 8% vacancy and 30% OpEx assumptions. When your market rent sits below this number, the deal will be cash-flow negative under these assumptions. A PITI of $2,023 translates to a Break-Even Rent of $3,141 — 55% higher.
2026 Investor Mortgage Market Context
Since 2021, rates have climbed 250-300 basis points since 2021, compressing cash flow margins across most US markets. Many Sunbelt rentals that produced $200-$400/month positive cash flow at 5% rates now show negative cash flow at 7.5%. DSCR loans have become the fastest-growing investor product — no income docs, property-based qualification, rates roughly 1 point above conventional. Hard money holds steady at 12-14%, making sense only for 6-12 month flips. Running your deal at actual 2026 rates, not leftover assumptions from YouTube videos recorded in 2020, is the single most important thing this investment property mortgage calculator does.
Investment Property Mortgage Benchmarks for 2026
Rate ranges, typical PITI, and lender thresholds
These are illustrative patterns for investor mortgage scenarios in illustrative US markets. Your rate depends on credit score, property type, LTV, reserves, and lender relationships.
illustrative Investor Mortgage Rates
| Loan Type | Rate Range | Notes |
|---|---|---|
| Conventional (Fannie/Freddie) | 7.25-7.75% | Personal income required, 20-25% down |
| Second Home | 7.00-7.50% | Semi-owner-occupied, lower than investment |
| DSCR | 8.00-8.75% | No income docs, property cash flow qualifies |
| Portfolio | 7.50-9.00% | Relationship lender, varies widely |
| Hard Money | 11.00-14.00% + 2-4 pts | Short-term bridge, 6-18 months |
Rates shift weekly with market conditions. Use current lender quotes for actual underwriting.
Typical Monthly PITI Ranges (Austin, TX baseline, 25% down, 7.5%)
| Property Price | Approx Monthly PITI |
|---|---|
| $200,000 | $1,350-$1,450 |
| $300,000 | $2,000-$2,100 |
| $400,000 | $2,700-$2,800 |
| $500,000 | $3,350-$3,500 |
However, adjust by state. Texas has higher property taxes (2-3% vs 1.2% average). Florida has higher insurance. New York has higher everything.
DSCR Lender Thresholds (Common 2026 Programs)
- Conventional investor: DSCR ≥ 1.25 typical
- DSCR-specific loans: DSCR ≥ 1.15 (some programs accept 1.00 with compensating factors)
- Portfolio lenders: DSCR ≥ 1.10-1.20, relationship-based
- Commercial 5+ units: DSCR ≥ 1.25-1.35
These ranges are illustrative patterns, NOT measured statistical datasets, NOT rate predictions for any specific deal. Rates depend heavily on credit score, property type, LTV, reserves, and lender. The calculator’s output on YOUR inputs always takes precedence. For actual rate quotes, contact licensed mortgage lenders.
How to Use This Calculator by Investor Type
Matching the mortgage analysis to your strategy
First-Time Investor (1st rental property)
Start with Mode 1 to understand your raw PITI — what the property costs before rent enters the equation. Then switch to Mode 2 with conservative rent estimates (use actual lease comparables, not Zillow). Target DSCR ≥ 1.25 for comfortable lender approval and positive Cash Flow for a sustainable hold. Before signing anything, validate the full Year 1 picture in the Rental Property Calculator.
Portfolio Builder (scaling to 5+ properties)
DSCR loans become your best friend at scale — no personal income scrutiny means your 4th property doesn’t compete with your 3rd for DTI room. Use Mode 3 to compare DSCR vs Portfolio loan terms side by side. Negative cash flow compounds across properties, so focus on deals that at least break even individually. Run each deal through a Conservative scenario (vacancy +2%, rate +0.5%) to stress-test before adding it to the portfolio.
Fix-and-Flip Investor
Select Hard Money as your loan type with a 1-year term. Mode 2 is blocked for Hard Money — rental cash flow doesn’t apply to a flip. The calculator shows monthly carry cost during the rehab and sale period. For full flip deal analysis including rehab, selling costs, and profit projection, use the Fix and Flip Calculator.
Wholesaler
Instead, run the calculator from your end-buyer’s perspective. Enter the purchase price your buyer will pay (your contract price plus your assignment fee) and see whether the deal cash flows at investor rates. If DSCR falls below 1.0, buy-and-hold investors won’t bite. Use Mode 3 to demonstrate loan flexibility — showing a buyer that a DSCR loan at 8.25% still produces positive cash flow can close a deal.
Retirement Income Investor
Instead, higher down payment is your lever. Moving from 25% to 40% down cuts the loan amount — and PITI — substantially, often tipping negative cash flow into positive. Use Mode 2 with Conservative assumptions (higher vacancy, higher OpEx) for realistic retirement income projections. The Rental Property ROI Calculator extends this analysis over 10-30 years.
Common Use Cases
When this calculator is the right tool
Pre-purchase financing feasibility
Before making an offer, project PITI and Cash Flow at realistic planning-default investor rates. If the deal shows significant negative cash flow or DSCR below 1.0, you know to either negotiate harder or move on — before spending money on inspections and due diligence.
Comparing loan programs
Conventional at 7.5% vs DSCR at 8.25% vs a 15-year term? Mode 3 shows monthly payment, total interest, and lifetime cost side by side. The right loan isn’t always the lowest rate — a higher-rate DSCR loan with no income docs may save you weeks of underwriting headache.
Refinance decision analysis
Enter your current loan as Scenario A and the refi option as Scenario B. Compare monthly savings against closing costs to find the break-even month. If you plan to hold the property past break-even, the refi makes sense.
DSCR loan underwriting preview
Select DSCR as loan type, enter your rental income in Mode 2, and check whether the property meets the 1.15-1.25 DSCR threshold before submitting an application. Avoids wasted applications and credit pulls.
Rate sensitivity stress test
Run Mode 2 at your quoted rate, then again at +1 percentage point. If the deal flips from positive to significantly negative with a 1-point rate increase, it’s fragile. Markets shift between pre-approval and closing — build in a cushion.
Client presentations
Agents and advisors: use this calculator to show investor clients the real difference between primary residence expectations and investment property reality. The PDF export creates a clean one-page summary for meetings. Nothing kills unrealistic expectations faster than seeing $2,023/month PITI next to $1,610 effective rent.
How This Calculator Aligns with Industry Conventions
Investor vs primary residence conventions, loan types, peer tools
Investor vs primary residence mortgage conventions
Investment property lending operates under different rules than the primary residence world most buyers know. Rates carry a 0.75-1.5 percentage point premium reflecting higher default risk during downturns. Down payments start at 20-25% — FHA’s 3.5% and conventional 5% don’t apply here. Reserves requirements jump to 6+ months of PITI (vs 2 months for primary). Fannie Mae counts only 75% of rental income toward debt-to-income calculations, applying a 25% haircut that primary residence borrowers never see.
The 5 investor loan types
Conventional: Fannie/Freddie-backed, best rates, but requires personal income documentation and caps at 10 financed properties. DSCR: Qualifies on the property’s cash flow alone — no W-2, no tax returns. Rates run ~1 point higher, but underwriting is faster and scales better for portfolio investors. Portfolio: Held by the originating bank, terms negotiable, relationship-driven. Hard Money: Bridge financing at 12-14% plus points, designed for 6-18 month flips — never for long-term holds. Second Home: A gray zone — semi-owner-occupied properties with lower rates, but strict occupancy requirements.
How this differs from Zillow, Bankrate, and industry surveys
Zillow and Bankrate are consumer-focused. They default to primary residence rates, don’t offer investor loan types, and don’t model rental cash flow offset. industry surveys has investor calculator features but combines mortgage analysis with full deal analysis in a single tool. DealCheck offers solid investor modeling with less emphasis on the DSCR vs Cash Flow distinction. RealCalc’s approach separates the financing question (this calculator) from the operating question (Rental Property Calculator) with explicit Mode 2 rental offset, five loan types with investor-appropriate rate defaults, the DSCR vs Cash Flow key insight, and cross-calculator validation where the investment property mortgage calculator Year 1 Cash-on-Cash matches the Rental Property Calculator within ±0.1 percentage point.
These comparisons describe market positioning, not endorsements. This calculator emphasizes investor-specific framing — rates, loan types, cash flow, DSCR — rather than generic primary residence mortgage modeling.
Limitations of This Calculator
What this calculator cannot tell you
Rates are illustrative, not quotes
Default rates in this investment property mortgage calculator reflect 2026 market averages for investment properties — this calculator is designed for investment properties, not primary residences. Your actual investor rate depends on credit score, LTV, property type, reserves, and the lender. Override the default with your actual lender quote for precision. Rates shift weekly with market conditions.
Rental income assumptions require validation
The calculator processes whatever rent number you enter. Zillow Rent Zestimates tend to overstate by 5-15%. Best source: 3-5 recent lease comparables within 1 mile, matched by bedroom count and condition. Overestimated rent inflates both Cash Flow and DSCR, masking a deal that doesn’t actually work.
PMI auto-cancellation not modeled
PMI typically cancels at roughly 78% LTV through normal amortization. This calculator assumes PMI continues for the full loan term, which overstates total interest slightly. For precise post-cancellation projections, recalculate with PMI removed or consult your servicer.
Property taxes vary significantly by location
The default 1.2% is the US average, but actual rates range from 0.3% (Hawaii) to 3%+ (New Jersey, Illinois, Texas). This single input can swing your PITI by $200-$500/month. Always override with your county’s actual effective tax rate.
Does not model ARM adjustments or balloon terms
Currently, version 1 assumes fixed-rate fully-amortizing loans for the full term. Adjustable-rate and balloon loans have different payment structures that change over time. For ARM or balloon analysis, consult your lender directly. These structures are more common in commercial and portfolio lending.
Not a substitute for professional advice
This investment property mortgage calculator is an educational and screening tool. Before committing capital: get rate quotes from a licensed mortgage broker, tax projections from a CPA, and contract review from a real estate attorney. Projections are based on your inputs and assumptions — not guarantees of lending terms or investment outcomes.
When Not to Use This Calculator
- Primary residence mortgage: Use a primary residence mortgage calculator with owner-occupant rates
- Commercial property (5+ units): Different DSCR thresholds and underwriting standards apply
- Cash purchase (100% down): Use the Rental Property Calculator — no financing needed
- Long-term wealth projection: Use the Rental Property ROI Calculator for 10-30 year analysis
- ARM or balloon loan analysis: Not modeled in v1; consult lender
- Lender underwriting certainty: DSCR thresholds vary by program and lender
Common Mistakes When Using Mortgage Calculators
Avoid these five errors
Using primary residence rates for investor analysis
For example, plugging in 6% when your actual investor rate is 7.5% produces a monthly payment that’s $150-$250 too low on a $300K property. That gap is the difference between positive and negative cash flow for many deals. This calculator defaults to investor rates — keep them there unless you have an actual investor quote.
Confusing DSCR with Cash Flow
DSCR of 1.25 doesn’t mean the deal is profitable. It means the lender sees enough P&I coverage to underwrite the loan. Your actual Cash Flow can still be negative once taxes, insurance, and HOA enter the equation. A deal in Dallas with DSCR of 1.20 and Cash Flow of −$180/month is simultaneously lender-approvable and investor-negative.
Forgetting taxes and insurance
To illustrate, P&I on a $225,000 loan at 7.5% is $1,573/month. Add property taxes and insurance and you’re at $2,023. That’s a 29% jump that many calculators hide behind a “P&I” label. Budget around PITI from day one.
Underestimating Break-Even Rent
Break-Even Rent (Gross Required Rent) is typically 30-40% higher than PITI because rent must cover vacancy, maintenance, property management, and capital reserves before it covers the mortgage. PITI of $2,023 requires gross rent of $3,141 to break even at standard assumptions. The gap surprises most first-time investors.
Using Hard Money for long-term rental analysis
Hard money is 12-14% (per industry survey data) bridge financing for 6-18 month flips. Modeling a 30-year hold at those rates produces terrifying numbers that have no basis in reality. This calculator blocks Mode 2 when Hard Money is selected for exactly this reason.
Frequently Asked Questions
Common questions about investment property mortgages
What’s the difference between investor and primary residence mortgage rates?
Investor rates run 0.75-1.5 percentage points higher than primary residence rates. In 2026, Conventional investor rates average 7.5% versus 6.5-7.0% for primary residence. Because the premium reflects lender risk — investment properties have higher default rates during market downturns because owners prioritize their own home’s mortgage. This calculator is designed for investment properties, not primary residences — it uses investor rates by default. For primary residence analysis, use a primary residence mortgage calculator with owner-occupant rates. Projected outputs are estimates based on your inputs; always confirm terms with your lender.
What does PITI stand for?
PITI stands for Principal, Interest, Taxes, and Insurance — the four components of your full monthly mortgage payment. Primary residence calculators often show only P&I (principal and interest), which understates actual cost by 20-40%. Full PITI also includes PMI (if applicable) and HOA fees. Always budget around PITI, not P&I.
When does PMI apply to investor mortgages?
PMI applies only when down payment is less than 20% AND loan type is Conventional or Second Home. DSCR, Portfolio, and Hard Money loans typically never carry PMI — the higher base rate already covers the risk premium. PMI typically auto-cancels at roughly 78% LTV through normal amortization, though this calculator doesn’t model that cancellation in the current version.
Why does DSCR show approvable but my Cash Flow is negative?
This is the most important insight in investor mortgage analysis. DSCR uses only P&I — principal and interest — as debt service. It’s a lender metric that answers whether the property’s net operating income covers the loan payment. Cash Flow uses full PITI — adding property taxes, insurance, and HOA — subtracted from effective rent. It’s an investor metric showing whether you write a check or receive one each month. In high-tax states like Texas, Illinois, or New Jersey, or high-insurance markets like Florida, property taxes and insurance push PITI far above P&I. A property can easily meet DSCR of 1.25 while producing Cash Flow of −$150/month. Both numbers are correct. They answer different questions.
What’s a DSCR loan?
DSCR loans qualify borrowers based on the property’s rental income covering the mortgage payment — no W-2s, no personal tax returns required. Typical minimum DSCR for approval is 1.15-1.25. Rates run roughly 1 percentage point above Conventional investor rates (8.00-8.75% in 2026), but underwriting is faster and doesn’t cap the number of financed properties. They’ve become the dominant loan product for portfolio investors and the self-employed.
Can I use this for a flip?
If flipping, select Hard Money as your loan type with a 1-year term. This shows your monthly carry cost during the rehab and sale period. Mode 2 (rental offset) is intentionally blocked for Hard Money — rental cash flow analysis doesn’t apply to a property you’re renovating and selling. For full flip deal analysis including rehab costs, holding costs, selling costs, and profit projection, use the Fix and Flip Calculator.
What down payment should I expect?
Specifically, investor minimums by loan type: Conventional 20-25%, DSCR 20-25%, Portfolio 15-30% (varies by lender), Hard Money 10-30% plus points, Second Home 10-20%. This calculator defaults to 25%. Dropping below 20% on Conventional or Second Home triggers PMI. Most investors put 25% down to avoid PMI and access better rates.
How do I calculate Break-Even Rent?
Break-Even Rent (Gross Required Rent) = PITI / [(1 − Vacancy %) × (1 − OpEx %)]. This gives the gross rent needed before vacancy and expenses to cover your full PITI. With PITI of $2,023, 8% vacancy, and 30% OpEx, Break-Even Rent = $2,023 / (0.92 × 0.70) = $3,141/month. If your market rent is below this number, the deal will be cash-flow negative at standard assumptions.
Does this calculator model ARM or balloon loans?
Not in the current version. The calculator assumes fixed-rate fully-amortizing loans for the full term. Adjustable-rate mortgages and balloon notes have payment structures that change over time — initial teaser rates reset, balloons require lump-sum payoff or refinancing. For ARM or balloon analysis, work directly with your lender to model the payment schedule.
Related Calculators
Continue your investor analysis workflow
- Rental Property Calculator — Year 1 operating cash flow with DSCR, Cash-on-Cash, and NOI. Validate financing assumptions from this calculator.
- Rental Property ROI Calculator — Lifetime wealth projection over 5-30 year holds with IRR, appreciation, and depreciation benefits.
- DSCR Calculator — Dedicated lender underwriting analysis with detailed DSCR modeling.
- Fix and Flip Calculator — Full flip deal analysis. Use for Hard Money scenarios with rehab, holding, and selling costs.
- Compare Real Estate Deals — Side-by-side Flip vs BRRRR vs Rental strategy comparison.
- BRRRR Calculator — Buy-Rehab-Rent-Refi-Repeat analysis with mid-hold refinancing.
Disclaimer: This article is for educational purposes only and does not constitute financial, investment, legal, or tax advice. Real estate investing involves significant risk, including the potential loss of capital. All numbers, rates, and projections are illustrative examples and may not reflect your specific situation. Consult qualified financial, legal, and tax professionals before making any investment decisions.
Leave a Reply