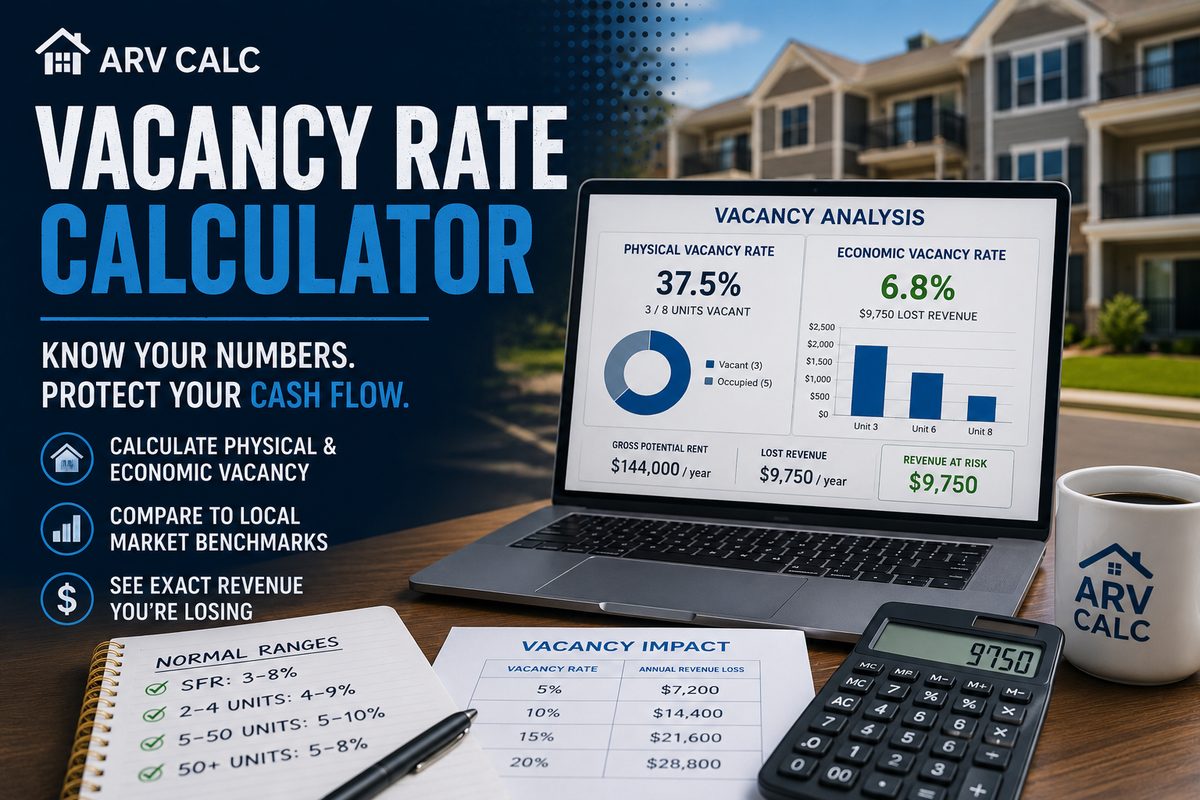
A vacancy rate calculator tells you exactly how much rent you are losing — and whether your vacancy is normal or a red flag. Here is how to use one with real numbers.
{
“@context”: “https://schema.org”,
“@type”: “FAQPage”,
“mainEntity”: [
{
“@type”: “Question”,
“name”: “What is the national average vacancy rate for rental properties?”,
“acceptedAnswer”: {
“@type”: “Answer”,
“text”: “The national average rental vacancy rate is approximately 6.6% as of 2025, according to the U.S. Census Bureau’s Current Population Survey/Housing Vacancy Survey (CPS/HVS). However, this figure varies significantly by market — Texas runs around 11%, Florida near 10%, while coastal markets like California and New York sit closer to 4–4.5%.”
}
},
{
“@type”: “Question”,
“name”: “What is the formula for calculating vacancy rate?”,
“acceptedAnswer”: {
“@type”: “Answer”,
“text”: “Physical vacancy rate = (Vacant Units ÷ Total Units) × 100. Economic vacancy rate = (Lost Rent Due to Vacancy ÷ Gross Potential Rent) × 100. Physical vacancy counts empty units at a point in time; economic vacancy measures actual revenue lost over a period.”
}
},
{
“@type”: “Question”,
“name”: “What is a good vacancy rate for a rental property?”,
“acceptedAnswer”: {
“@type”: “Answer”,
“text”: “For single-family rentals, 3–8% is considered healthy. Multifamily properties typically run 5–10%. Anything above your local market average signals a problem with pricing, condition, or marketing. Seasonal and student housing can run 15–30% and that can still be normal for those asset classes.”
}
},
{
“@type”: “Question”,
“name”: “What is the difference between physical vacancy and economic vacancy?”,
“acceptedAnswer”: {
“@type”: “Answer”,
“text”: “Physical vacancy is the percentage of units that are empty right now. Economic vacancy is the percentage of potential rental income you actually lost — it accounts for the duration a unit sat empty, concessions, and rent-free periods. A unit vacant for 2 months costs twice as much in economic vacancy as one vacant for 1 month, even though both count as one unit in physical vacancy.”
}
},
{
“@type”: “Question”,
“name”: “How does vacancy rate affect NOI?”,
“acceptedAnswer”: {
“@type”: “Answer”,
“text”: “Vacancy is a direct subtraction from gross potential rent before you calculate NOI. On a property with $2,000/month average rent, a 10% vacancy rate costs $2,400 per year per unit in lost revenue. At 15% vacancy that rises to $3,600 per unit. This lost income flows straight to the bottom line — it cannot be recovered through expense cuts.”
}
},
{
“@type”: “Question”,
“name”: “Why is my vacancy rate high even when my units look occupied?”,
“acceptedAnswer”: {
“@type”: “Answer”,
“text”: “Economic vacancy can be high even when physical occupancy looks good. Rent concessions (first month free), tenants on reduced rent, units in turnover that are technically occupied by a holdover tenant, and lease-up periods all reduce effective income without showing up as an empty unit. Always calculate both metrics.”
}
},
{
“@type”: “Question”,
“name”: “How do I reduce vacancy rate on my rental property?”,
“acceptedAnswer”: {
“@type”: “Answer”,
“text”: “The seven most effective strategies are: (1) price competitively using real-time comps, (2) upgrade curb appeal and unit condition before listing, (3) reduce turnover time by starting marketing 60 days before lease end, (4) list on all major platforms, (5) offer lease renewal incentives to current tenants, (6) allow pets with a deposit, and (7) offer flexible lease terms like 14-month leases to stagger expirations.”
}
}
]
}
Imagine you own an 8-unit apartment building and right now 3 of those units are sitting empty. Is that a crisis, or just a slow month between leases? The answer depends on how you use a vacancy rate calculator — and most landlords do not know how to use one correctly. They calculate the wrong metric, compare it to the wrong benchmark, or ignore vacancy entirely until it wipes out a quarter’s profit. This guide walks through the exact formulas, worked examples, industry benchmarks, and the specific mistakes that cost landlords thousands of dollars a year.
Vacancy Rate Formula: Physical vs. Economic Vacancy
There are two distinct vacancy metrics and both matter. Most landlords only track one — and it is usually the wrong one for the decision they are trying to make.
Physical Vacancy Rate
Physical vacancy is a snapshot. It answers the question: “What percentage of my units are empty right now?”
Physical Vacancy Rate = (Vacant Units ÷ Total Units) × 100
If you have 8 units and 3 are empty: (3 ÷ 8) × 100 = 37.5%
This is the number lenders, appraisers, and market reports quote. It is easy to calculate and easy to compare across properties. But it has a major limitation: it treats every vacant unit equally, regardless of how long it has been empty or how much rent it could have collected.
Economic Vacancy Rate
Economic vacancy measures what you actually lost in dollars, expressed as a percentage of what you could have collected.
Economic Vacancy Rate = (Lost Rent Due to Vacancy ÷ Gross Potential Rent) × 100
Gross Potential Rent (GPR) is what you would collect if every unit were leased at market rent for the entire measurement period — typically 12 months.
Economic vacancy also captures:
- Concessions (free months, reduced rent during lease-up)
- Units held offline for renovation
- Lease-up periods on new construction
- Tenants in holdover paying below-market rates
A property can have 100% physical occupancy and still have 8–12% economic vacancy if you gave concessions to fill units quickly or if long-term tenants are paying below-market rents. That is why underwriters analyzing a deal with the NOI calculator always ask for both figures.
Worked Example 1: The 8-Unit Building
Back to our landlord with the 8-unit building. Let’s build out the full picture.
Property Details
- 8 units total, all 2BR at $1,500/month market rent
- Gross Potential Rent: 8 × $1,500 × 12 = $144,000/year
- Currently 3 units vacant
Physical Vacancy — Snapshot
(3 ÷ 8) × 100 = 37.5%
That is an alarming number on its own. But the physical vacancy snapshot does not tell the full story. Let’s look at what actually happened with those 3 units over the past 12 months:
- Unit 3: Tenant moved out in October. Unit sat vacant for 4 months while the landlord renovated the kitchen. Now re-leased.
- Unit 6: Lease ended in November. Unit vacant for 2 months. Signed new tenant in January.
- Unit 8: Tenant just vacated last week. Unit is currently being turned.
Economic Vacancy — 12-Month Calculation
| Unit | Months Vacant | Monthly Rent | Lost Revenue |
|---|---|---|---|
| Unit 3 | 4 months | $1,500 | $6,000 |
| Unit 6 | 2 months | $1,500 | $3,000 |
| Unit 8 | ~0.5 months (so far) | $1,500 | $750 |
| Total | $9,750 |
Economic Vacancy Rate = ($9,750 ÷ $144,000) × 100 = 6.8%
The physical vacancy rate of 37.5% sounds dire. The economic vacancy rate of 6.8% is actually close to the national average — because most of those vacancies were brief turnover periods, not chronic empty units. Knowing which number you are looking at completely changes how you respond.
Run the same analysis on your own portfolio with the vacancy rate calculator. Then plug the result into your rental property calculator to see the full investment picture.
Worked Example 2: SFR Portfolio
Single-family rentals behave differently from multifamily because each vacancy is a larger percentage of the portfolio.
Portfolio Details
- 5 SFRs, each renting at $1,800/month
- Gross Potential Rent: 5 × $1,800 × 12 = $108,000/year
- 1 house currently vacant
Physical Vacancy
(1 ÷ 5) × 100 = 20%
On paper, 20% physical vacancy looks terrible. But let’s examine the economic reality over 12 months:
- House 2 was vacant from March 1 through April 15 (1.5 months) after a tenant broke the lease early. $2,700 lost.
- The other 4 houses were leased continuously all year.
Economic Vacancy Rate = ($2,700 ÷ $108,000) × 100 = 2.5%
A 2.5% economic vacancy on an SFR portfolio is excellent by any standard. The 20% physical vacancy was a moment-in-time snapshot taken during an unusually busy turnover period. This is exactly why seasonal snapshots can be misleading — see the “Common Mistakes” section below.
For SFR investors analyzing specific markets, the Texas rental property calculator and Florida rental property calculator include state-specific vacancy assumptions built into the underwriting model.
What’s a Normal Vacancy Rate? Benchmarks by Property Type
The Federal Reserve Bank of St. Louis tracks vacancy data through FRED’s Rental Vacancy Rate series, which updates quarterly. The U.S. Census Bureau CPS/HVS publishes the most detailed breakdown by region, unit type, and tenure. HUD’s Fair Market Rents database also provides useful context on rental demand by metro.
Here is how normal vacancy ranges look across different property types:
| Property Type | Healthy Range | Concern Threshold | Notes |
|---|---|---|---|
| Single-Family Rental | 3–8% | >10% | Low supply markets can sustain sub-3% |
| Small Multifamily (2–4 units) | 4–9% | >12% | Each vacancy is 25–50% of income |
| Apartment Complex (5–50 units) | 5–10% | >13% | Natural turnover accounts for 4–6% |
| Large Multifamily (50+ units) | 5–8% | >10% | Economies of scale reduce management vacancy |
| Student Housing | 5–15% | >20% | Highly seasonal; summer spikes are normal |
| Seasonal/Vacation Rental | 15–30% | >40% | Must be measured over full annual cycle |
| Section 8 / Affordable Housing | 2–6% | >8% | Demand typically exceeds supply |
The NAR tracks commercial and multifamily vacancy through their quarterly research reports. For multifamily specifically, submarkets within the same metro can vary by 8–12 percentage points, so never use national averages to make local decisions.
Vacancy Rate by State
State-level vacancy rates reflect underlying supply and demand dynamics — population growth, construction activity, and job markets. Sun Belt states with heavy new apartment construction tend to run higher vacancy than supply-constrained coastal markets.
| State | Approx. Vacancy Rate | Key Driver |
|---|---|---|
| Texas | ~11% | Heavy multifamily construction; Austin and DFW pipeline |
| Florida | ~10% | Seasonal markets + Miami/Tampa new supply |
| Georgia | ~9% | Atlanta metro absorption lagging new deliveries |
| North Carolina | ~8% | Charlotte and Raleigh growth attracting new supply |
| Ohio | ~7% | Stable Midwest market; Columbus is tighter |
| New York | ~4.5% | Chronic undersupply in NYC metro |
| California | ~4% | Restrictive zoning limits new construction |
Texas and Florida investors need to be especially careful about using national vacancy benchmarks. A 6.6% economic vacancy assumption in a Texas underwriting model will underestimate real risk by 4+ percentage points. Use the Texas rental property calculator or Florida rental property calculator which use state-adjusted assumptions.
How Vacancy Rate Destroys NOI
Vacancy is not a soft metric. It is a direct, dollar-for-dollar subtraction from your top line before a single operating expense is paid. Understanding the compounding impact on net operating income is what separates professional underwriters from amateur landlords.
Here is how vacancy wipes out income on a single unit renting at $2,000/month ($24,000/year potential):
| Vacancy Rate | Lost Revenue (1 unit) | Lost Revenue (8 units) | NOI Impact |
|---|---|---|---|
| 5% | $1,200/year | $9,600/year | Low; manageable turnover |
| 10% | $2,400/year | $19,200/year | Material; review pricing and marketing |
| 15% | $3,600/year | $28,800/year | Serious; cash flow likely negative |
| 20% | $4,800/year | $38,400/year | Crisis; asset may not service its debt |
| 25% | $6,000/year | $48,000/year | Distress; likely operating at a loss |
What makes this especially painful is the leverage effect. On a property with 50% expense ratio, a $19,200 vacancy loss on an 8-unit building does not just reduce your profit by $19,200 — it may eliminate profit entirely and push the property into negative cash flow. Every dollar of vacancy loss comes straight off the top, before expenses.
This is why vacancy rate is the first line item in any professional NOI model. Use the NOI calculator to see exactly how different vacancy assumptions change your property’s profitability, and then run a full deal analysis with the cap rate calculator to understand the valuation impact.
For a complete breakdown of how vacancy flows through a rental investment, see the guide on how to analyze a rental property investment.
5 Causes of High Vacancy
High vacancy rarely has a single cause. But when landlords work through these five systematically, most chronic vacancy problems trace back to one or two root issues.
1. Overpricing
This is the most common cause and the most fixable. If your asking rent is 8–10% above comparable units in your immediate submarket, you will see longer vacancy periods even if demand is strong. Tenants have good information — they see Zillow, Apartments.com, and Craigslist. A unit priced $150/month above market will often sit empty for 2–3 months, costing $300–$450 more than the pricing premium would have earned over a year.
The fix: Pull 5–10 true comps within 0.5 miles, same bed/bath count, and price within 3–5% of the median. Use the rental property calculator to model the NPV difference between a higher rent with 2 extra vacancy months versus a market rent with rapid lease-up.
2. Poor Property Condition
First impressions filter prospects before they tour. Deferred maintenance, dated kitchens, worn carpet, and poor photos all extend time-on-market. A unit that shows poorly will be skipped by qualified prospects and attract only tenants who have already been rejected elsewhere — creating a selection problem that compounds over time.
3. Location Friction
Location is fixed, but how you market to location is not. A property near a highway without noise mitigation, near a school but marketed to young professionals, or in a transitional neighborhood marketed with the wrong price point will struggle. Match your tenant profile to the property’s genuine strengths.
4. Slow or Poor Tenant Screening
Paradoxically, landlords who screen too slowly create vacancy by losing qualified prospects who sign elsewhere while waiting. Those who screen too loosely fill units fast but generate turnover — chronic vacancy disguised as high occupancy. The standard: complete applications within 48 hours, screen with consistent criteria, and hold units for no more than 10–14 days with a deposit.
5. Seasonal Market Misalignment
Lease expirations clustered in January–February in a market where most people move in May–August create structural vacancy. If you inherit a building where half the leases end in winter, you will fight the calendar. Student housing, military housing, and resort markets have strong seasonal patterns that require different occupancy strategies than year-round residential properties.
7 Ways to Reduce Vacancy Rate
These strategies are ranked roughly by impact-to-effort ratio, based on what operators in high-vacancy markets report as most effective.
1. Price Competitively with Real-Time Data
Do not set rents once a year and forget them. Pull fresh comps every time you have a vacancy. Markets move faster than annual rent surveys reflect. In a softening market, pricing $50/month below the median for the first 30 days of listing is often worth more than waiting at the median for 60 days.
2. Front-Load Property Upgrades
Units that show well — clean paint, updated fixtures, professional photos — lease 20–40% faster than comparable units that are merely functional. Budget $500–$1,500 in cosmetic refresh per turnover. That investment is almost always recovered in reduced vacancy days.
3. Start Marketing 60 Days Before Lease End
The single biggest operational cause of preventable vacancy is landlords who list the unit on the day the tenant moves out. Best-in-class operators begin marketing 60 days before the lease expiration — with the current tenant’s cooperation and sometimes with showings (with proper notice) while occupied. This alone can reduce average days vacant by 2–3 weeks per turnover.
4. Maximize Listing Distribution
List on Zillow, Apartments.com, Trulia, Facebook Marketplace, Craigslist, and any local property management group. Syndicating across platforms takes 30 minutes and can triple your inquiry volume. Quality professional photos are not optional — they are a prerequisite for the primary search platforms where prospects swipe past low-quality images instantly.
5. Offer Lease Renewal Incentives to Current Tenants
Retaining a good tenant is almost always cheaper than finding a new one. A vacancy of even 2 weeks at $1,500/month costs $750 before you account for cleaning, repairs, and leasing time. Offering a $200 renewal incentive or holding rent flat for a year is usually ROI-positive. Calculate your true turnover cost before deciding on renewal terms.
6. Allow Pets with a Pet Deposit
The majority of renters have pets. Properties that prohibit pets eliminate a large portion of the qualified applicant pool and often sit vacant longer than comparable pet-friendly units. A refundable $300–$500 pet deposit and/or pet rent of $25–$50/month covers expected wear, and the larger applicant pool reduces vacancy. Many landlords who run the numbers discover that pet-friendly policies are net-positive even accounting for additional maintenance.
7. Offer Flexible Lease Terms
Standard 12-month leases mean all your renewals cluster at the same time each year. A 14-month lease on a new tenant, or staggered 11- and 13-month options, smooths your turnover calendar and avoids the winter vacancy trap. Month-to-month at a premium ($100–$200 above base rent) gives tenants flexibility and gives you a higher monthly rate during transition periods.
For a deeper look at how these factors feed into your overall investment returns, see the rental property cash flow guide.
5 Common Mistakes When Tracking Vacancy Rate
These errors appear constantly when landlords review their own vacancy numbers. Each one leads to either complacency (thinking performance is better than it is) or unnecessary panic (overcorrecting in response to a temporary blip).
Mistake 1: Using National Averages as Your Local Benchmark
The national average vacancy rate of 6.6% is useful as a macro context, but it is functionally useless for evaluating your 4-unit building in Austin. Austin’s submarket may be running 13% due to new supply. Your specific zip code may be 8%. Your property type (Class C workforce housing vs. Class A luxury) has its own norm. Always compare to your MSA and property-type cohort — not the national figure.
Mistake 2: Ignoring Economic Vacancy
Landlords who only track physical vacancy miss the real cost of concessions, holdover tenants, and below-market rents. A property showing 95% physical occupancy that gave 6 “first month free” concessions to fill units quickly may have 12%+ economic vacancy. Use the vacancy rate calculator to track both metrics for every property.
Mistake 3: Not Tracking Vacancy by Unit
Portfolio-level vacancy can mask a chronic problem unit. If one unit in your 8-unit building has been vacant 3 times in 18 months while the others are stable, that unit has a specific problem — location in the building, layout, condition, or a pricing issue. You will not find it unless you track vacancy at the unit level over time.
Mistake 4: Measuring at the Wrong Time of Year (Seasonal Bias)
Taking a physical vacancy snapshot in February in a market where leases expire in June will overstate your vacancy. Taking a snapshot in July will understate it. Always measure economic vacancy over a 12-month trailing period, not at a point in time. When comparing year-over-year, use the same calendar month to avoid seasonal bias. Student housing, coastal markets, and military-adjacent properties are especially susceptible to this error.
Mistake 5: Comparing Different Property Types
A 10% vacancy rate means something very different on a 100-unit apartment complex versus a 5-unit building. On the complex, it is 10 vacant units out of 100 — manageable. On the 5-unit, it is half a unit, or statistically it means one vacancy every 2 months — a very different operational reality. Comparisons must be apples-to-apples: same property type, same class, same submarket.
Understanding how vacancy fits into the full picture of rental investment analysis is covered in detail in the existing vacancy rate calculator guide, which covers additional edge cases including lease-up scenarios and value-add repositioning.
Frequently Asked Questions
What is the national average vacancy rate for rental properties in 2026?
The national average rental vacancy rate is approximately 6.6% based on U.S. Census Bureau CPS/HVS data. This is an aggregate across all market types and property classes. Sun Belt markets like Texas (~11%) and Florida (~10%) run significantly higher than supply-constrained coastal markets like California (~4%) and New York (~4.5%). Always compare your property to your local submarket, not the national figure.
What is the formula for calculating vacancy rate?
There are two formulas. Physical vacancy rate = (Vacant Units ÷ Total Units) × 100. This is a point-in-time snapshot. Economic vacancy rate = (Lost Rent Due to Vacancy ÷ Gross Potential Rent) × 100. This measures actual revenue lost over a period, typically 12 months. Economic vacancy is the more useful number for financial analysis and underwriting.
What is a good vacancy rate for a rental property?
For single-family rentals, 3–8% economic vacancy is healthy. Multifamily properties typically run 5–10%. Above your local market average signals a problem. Student and seasonal properties have higher natural vacancy (5–30%) that is normal for those asset classes. Compare your number to your property type and submarket, not to a universal standard.
How does vacancy rate affect property value?
Commercial and multifamily property values are set by NOI divided by cap rate. Vacancy is a direct subtraction from revenue before NOI is calculated. On an 8-unit building at a 7% cap rate, reducing vacancy from 15% to 5% could add $150,000–$250,000 to market value by increasing NOI — even without a single rent increase. Use the cap rate calculator to model the valuation impact of vacancy improvements.
What is an acceptable vacancy rate when underwriting a deal?
Most conservative underwriters use 5–10% vacancy in their pro forma regardless of current occupancy, to account for future turnover and market softness. In high-vacancy markets like Texas, 10–12% is more appropriate. For value-add acquisitions with current vacancies, model vacancy at the market rate for your property type during stabilization, not at the current distressed level.
Why is my vacancy rate high in winter?
Winter vacancy spikes are normal in most residential markets because fewer households move between November and February. If you measure physical vacancy in January, you will see higher vacancy than in July — even if your economic vacancy for the full year is healthy. This is seasonal bias. Always measure trailing 12-month economic vacancy to get a true performance picture, and compare the same month year-over-year rather than looking at absolute numbers.
What is the vacancy rate in Texas vs. Florida?
Texas runs approximately 11% rental vacancy, driven by heavy apartment construction in the Dallas-Fort Worth, Austin, and Houston metros. Florida runs approximately 10%, influenced by Miami and Tampa new supply plus seasonal coastal markets. Both states are well above the national average. If you are investing in either state, use conservative vacancy assumptions of 9–12% in your underwriting. The Texas and Florida rental property calculators build these state-specific assumptions into the models.
Related Calculators
- Vacancy Rate Calculator — Calculate physical and economic vacancy for any property, compare to local benchmarks
- Rental Property Calculator — Full investment analysis including vacancy, expenses, cash flow, and returns
- NOI Calculator — Model net operating income with vacancy, operating expenses, and capital reserves
- Cap Rate Calculator — See how vacancy improvements translate into property value increases
Leave a Reply