
Last updated: September 24, 2026 · Originally published: August 25, 2026 · By Alex Petrov
Every investor should stress test rental deals before buying — especially now. The Fed holds rates at 3.50–3.75% heading into September 16, and three Fed presidents are publicly discussing a rate hike — not a cut. If you are closing on a rental property in Q4 2026, you need to run your numbers at 4.0–4.5% before you sign. A deal that produces +$227/month at today’s 7% mortgage rate might only produce +$76 at 8.5% — and that thin margin evaporates with one unexpected vacancy or maintenance bill. Here is how to stress test any rental deal in under 10 minutes using free calculators, with real worked examples from Indianapolis, Charlotte, and Cleveland.
Why September 16 Matters for Real Estate Investors
The Federal Reserve has held rates steady for 5 consecutive meetings through 2026. Markets priced in cuts that never came — bond futures showed 3 expected cuts at the start of the year, but zero materialized. Now hawkish signals are emerging: inflation still runs 1%+ above the 2% target, unemployment remains low at 3.8%, and geopolitical tensions (US/Iran trade disruptions) are adding supply-side pressure to energy and construction costs.
The September 16 FOMC meeting is particularly significant because it comes with updated economic projections (the “dot plot”). Even if the Fed holds rates, the forward guidance language determines where mortgage rates go next. A shift from “prepared to adjust” to “may need to tighten” could push 30-year mortgage rates from 7.0% to 7.5% within days.
For rental property investors, this means:
- Mortgage rates may rise from 7.0% to 7.5–8.0% if the Fed signals a hike
- DSCR qualification gets harder — higher rates = higher debt service = lower DSCR ratio
- Hard money gets more expensive — expect 12–14% base rates, up from 10–12%
- Cash flow margins compress — every 0.5% rate increase = $50–$75/month on a $200K loan
The smart move: stress test every rental deal you are evaluating right now at current rates AND at +1% higher. If the deal only works at 7.0% and breaks at 7.5%, it is too thin. Per FRED mortgage rate data, rates have fluctuated 0.5–1.0% within single quarters in 2025–2026.
Step 1: Stress Test Your Cash Flow
Open the property cash flow calculator. Enter your deal at the current rate (7.0%), then re-run at 7.5% and 8.0%.
Example: Indianapolis duplex $160K, $1,800/mo rent, 25% down
| Rate | Monthly P&I | Cash Flow | Verdict |
|---|---|---|---|
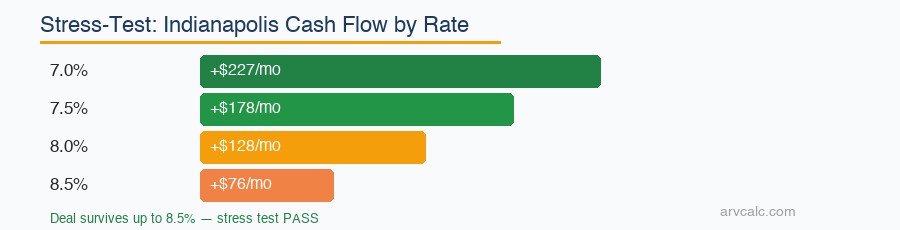
| 7.0% | $798 | +$227/mo | Positive — deal works |
| 7.5% | $839 | +$178/mo | Still positive — deal survives |
| 8.0% | $881 | +$128/mo | Thin but positive — deal holds |
| 8.5% | $924 | +$76/mo | Marginal — one vacancy kills it |
This Indianapolis deal survives up to 8.0%. At 8.5%, cash flow is too thin to absorb any vacancy or maintenance surprise. If rates go to 8%, you are still OK. That is a deal worth pursuing.
Compare to a Charlotte SFR at $420K:
| Rate | Cash Flow | Verdict |
|---|---|---|
| 7.0% | −$305/mo | Already negative |
| 7.5% | −$400/mo | Worse |
| 8.0% | −$500/mo | Hemorrhaging |
Charlotte does not survive any rate scenario. It is a pure appreciation play — acceptable if you have reserves, dangerous if you are counting on cash flow. Run your deal in the cash flow calculator. For detailed how-to, see the cash flow calculator guide.
Step 2: Stress Test DSCR Qualification
If you are using a DSCR loan, rate changes directly affect qualification. Higher rate = higher P&I = lower DSCR ratio.
Same Indianapolis duplex:
| DSCR Rate | Monthly P&I | DSCR Ratio | Qualifies? |
|---|---|---|---|
| 7.5% | $839 | 1.22 | Marginal — below 1.25 |
| 8.0% | $881 | 1.16 | Some lenders only |
| 8.5% | $924 | 1.11 | No-ratio programs only |
| 9.0% | $968 | 1.05 | Most lenders decline |
At current DSCR rates (7.5–8.5%), this deal is marginal. If the Fed hikes and DSCR rates go to 9%+, qualification becomes nearly impossible without a larger down payment or self-management.
Action: Lock your DSCR rate NOW if you are under contract. Rate locks cost 0.25–0.50% upfront but protect against a September surprise. Run scenarios in the DSCR calculator. See the DSCR calculator guide for step-by-step.
Step 3: Stress Test Hard Money Costs
Hard money rates track above the Fed rate. If the Fed goes to 4.0%, expect hard money at 13–15% — up from today’s 10–12%.
| Hard Money Rate | Monthly Interest ($200K loan) | 6-Month Cost | Impact on Flip Profit |
|---|---|---|---|
| 11% | $1,833 | $11,000 | Manageable |
| 12% | $2,000 | $12,000 | Standard |
| 14% | $2,333 | $14,000 | Eats $3K more profit |
| 15% | $2,500 | $15,000 | Thin margins — risky |
Every 1% rate increase on hard money costs $2,000 more per 6-month flip. If your flip profit margin is $30K, that is manageable. If it is $15K, a 3% rate increase wipes half your profit.
Model your hard money costs in the hard money calculator. See the hard money guide. For flip analysis, use the fix and flip calculator.
Step 4: Check Your Total ROI at Higher Rates
Higher rates reduce cash flow but do not change appreciation or principal paydown much. Use the ROI calculator to see total return at different rate scenarios.
Indianapolis duplex — 5-year total ROI:
| Rate | 5-Year Cash Flow | Appreciation | Paydown | Total ROI |
|---|---|---|---|---|
| 7.0% | +$13,620 | $17,400 | $7,200 | 85% |
| 7.5% | +$10,680 | $17,400 | $6,800 | 78% |
| 8.0% | +$7,680 | $17,400 | $6,400 | 70% |
| 8.5% | +$4,560 | $17,400 | $6,000 | 62% |
Even at 8.5%, total ROI is 62% over 5 years (12.4% annualized) — still beats the stock market. The deal works at any realistic rate scenario because appreciation and paydown carry the return. That is a pass. See the ROI calculator guide.
Step 5: Evaluate Your Cap Rate Cushion
Cap rate does not change with interest rates (it is unlevered). But your spread between cap rate and mortgage rate determines cash flow viability.
Cap Rate Spread = Cap Rate − Mortgage Rate

Indianapolis duplex: 7.7% cap rate − 7.0% mortgage = +0.7% spread (positive CF)
Indianapolis duplex: 7.7% cap rate − 8.5% mortgage = −0.8% spread (negative CF)

Charlotte SFR: 2.4% cap rate − 7.0% mortgage = −4.6% spread (deeply negative)
If your cap rate is within 1% of the mortgage rate, any rate increase pushes you negative. Target deals with 2%+ cap rate spread for rate-resilience. Calculate in the cap rate calculator. See cap rate guide.
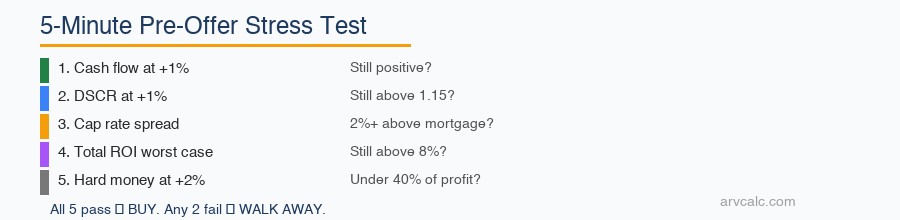
The 5-Minute Pre-Offer Stress Test
- Cash flow at +1% rate → Cash Flow Calculator — still positive?
- DSCR at +1% rate → DSCR Calculator — still above 1.15?
- Cap rate spread → Cap Rate Calculator — 2%+ above mortgage rate?
- Total ROI at worst case → ROI Calculator — still above 8% annualized?
- Hard money cost at +2% → Hard Money Calculator — still under 40% of flip profit?
If all five checks pass, buy the deal with confidence — you have quantified the downside and it is acceptable. If any two fail, walk away no matter how good the listing photos look. If one fails marginally, use the failed metric as negotiation leverage: “My analysis shows cash flow breaks at 8% rates, so I need $5,000 off the price to create adequate margin.” This 5-minute process saves $10,000+ in bad decisions and gives you concrete data to negotiate with.
Per NAR, US housing inventory is at the highest level since 2019 — buyer leverage is improving. Use it to negotiate better prices that survive any Fed scenario.
Markets That Survive Rate Stress Analysis
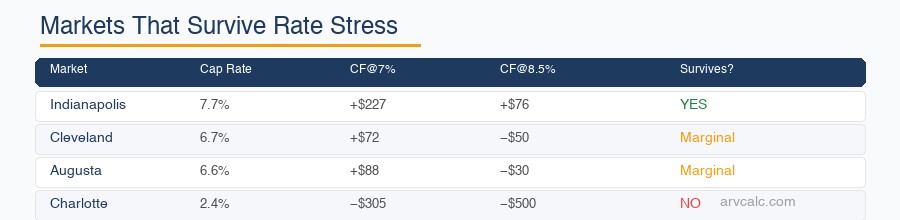
| Market | Cap Rate | CF at 7% | CF at 8.5% | Survives? |
|---|---|---|---|---|
| Cleveland, OH | 6.7% | +$72 | −$50 | Marginal |
| Indianapolis | 7.7% | +$227 | +$76 | Yes |
| Augusta, GA | 6.6% | +$88 | −$30 | Marginal |
| Greensboro, NC | 5.6% | −$65 | −$210 | No |
| Charlotte, NC | 2.4% | −$305 | −$500 | No |
Indianapolis is the standout — positive cash flow even at 8.5%. The key is its 7.7% cap rate, which provides a meaningful spread above any realistic mortgage rate. Cleveland and Augusta are marginal: they work at current rates but flip negative with one rate hike. Charlotte and Greensboro fail at every rate scenario — these are pure appreciation plays that require deep reserves to carry negative cash flow for years.
The lesson: markets under $170K with cap rates above 6.5% give you the best chance of surviving rate volatility. For state-specific analysis with local tax rates, insurance costs, and vacancy data: Ohio calculators, Georgia calculators, North Carolina calculators.
5 Mistakes When Running Rate Scenarios
1. Testing Only One Rate Scenario
Running your deal at 7.0% and calling it done is not a stress test. You need minimum three scenarios: current rate, +0.5%, and +1.0%. The Indianapolis duplex shows +$227 at 7%, +$178 at 7.5%, and +$128 at 8%. Each step down reveals how much cushion you actually have. A deal that looks great at one rate might be a disaster at another.
2. Ignoring Variable Expenses at Higher Rates
When rates rise, other costs often rise too. Insurance premiums correlate with interest rates (higher replacement costs). Property taxes lag but catch up. A proper analysis adjusts not just the mortgage payment but also insurance (+5%), taxes (+3%), and vacancy (+1%). On our Indianapolis example, adding these adjustments reduces cash flow by an additional $40–$60/month on top of the rate increase impact.
3. Forgetting the Refinance Exit
BRRRR investors and flippers depend on exit financing. If you buy with hard money at 12% planning to refinance at 7%, but rates jump to 8.5%, your refinance proceeds drop significantly. On a $190K ARV at 75% LTV, the difference between 7% and 8.5% DSCR rate means qualifying for $15K less in loan proceeds. Always model your refinance exit at current rate + 1%. Use the LTV calculator and BRRRR calculator together.
4. Using National Averages Instead of Local Data
National median home prices and average rents mean nothing for your specific deal. Cleveland operates completely differently from Charlotte. A 7% cap rate market absorbs rate increases. A 2.4% cap rate market does not. Use local data: actual listed rent for comparable units, actual property tax from the county assessor, actual insurance quotes from local agents. State-specific calculators for Ohio, Georgia, and North Carolina use verified local data.
5. Not Accounting for Rate Lock Costs
A rate lock protects you from increases between application and closing — typically 30–60 days. But locks cost 0.25–0.50% of the loan amount upfront ($300–$750 on a $150K loan). Extended locks (90+ days) cost more. Factor this into your closing costs when running numbers. If you are closing within 45 days, a standard lock is usually included free. Beyond that, you are paying for protection — and that cost comes directly from your Day 1 returns. Compare scenarios in the closing costs calculator.
Frequently Asked Questions
Should I wait for a rate cut before buying?
No — if the deal passes your analysis at current rates + 1%, buy now. Waiting for rate cuts means competing with every other investor who also waited. Prices historically rise 3–5% when rates drop because demand surges. The best time to buy is when deals work at today’s rates AND you have a refinance upside if rates drop later. Consider this: investors who bought in 2022 at 6.5% and refinanced in early 2024 at 5.8% captured both price appreciation and rate improvement. The same opportunity exists today for deals that survive at 8%+.
How much does a 0.5% rate increase affect cash flow?
What rate should I stress test at?
Should I lock my rate before September 16?
Which markets are most rate-sensitive?
Related Calculators
- Cash Flow Calculator — Stress-test monthly numbers
- DSCR Calculator — Check loan qualification at higher rates
- Cap Rate Calculator — Evaluate spread over mortgage rate
- ROI Calculator — Total return at different rate scenarios
- Hard Money Calculator — Bridge cost at higher rates
- Fix and Flip Calculator — Flip profit stress test
- Mortgage Calculator — Compare payment scenarios
- LTV Calculator — Refinance proceeds
- All 30+ Calculators
Leave a Reply