Last updated: October 21, 2026 · Originally published: July 25, 2026 · By Alex Petrov
Maria spotted a three-bedroom ranch in a Houston suburb listed at $190,000. The roof sagged, the kitchen hadn’t been touched since 1994, and the carpet was beyond saving. Her contractor quoted $62,000 to bring it to market standard. Before she made an offer, she needed one number: what will this house be worth once the work is done? That number is the after repair value — and without a reliable after repair value calculator, she had no basis for her offer price, her rehab budget, or her profit forecast.
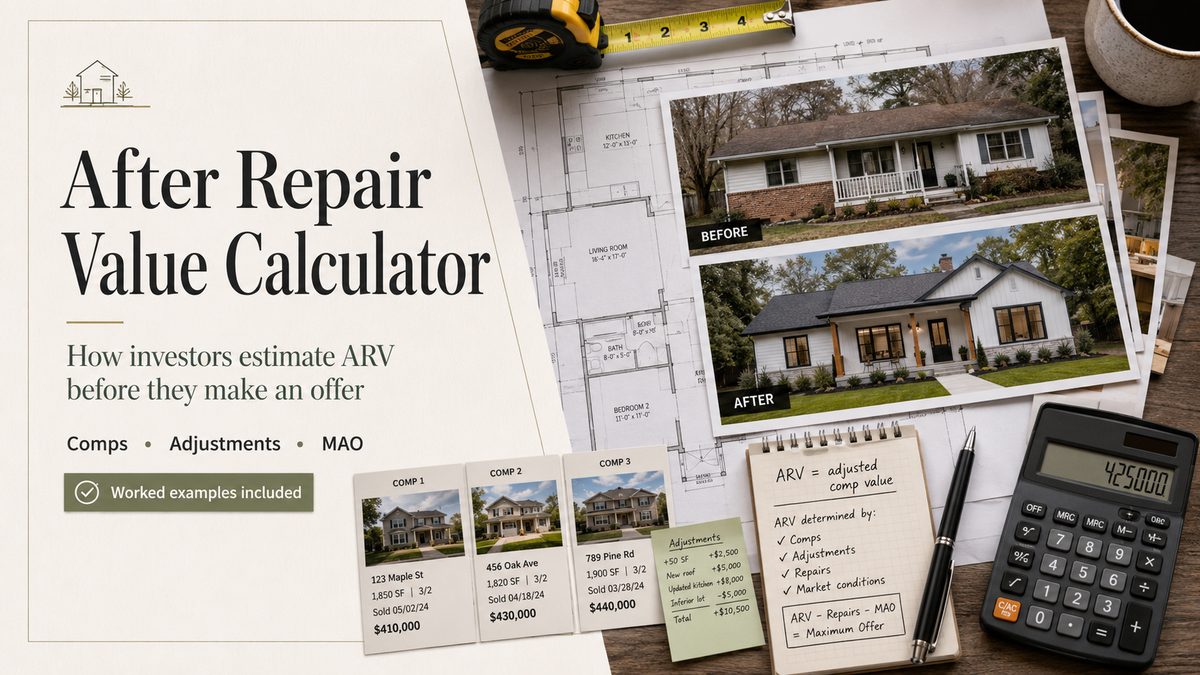
This after repair value calculator guide walks through every method professionals use to estimate ARV with an after repair value calculator, including two worked examples, a breakdown of the most common calculation mistakes, and links to free tools — including our after repair value calculator — you can use today.
What’s in This Guide
How the After Repair Value Calculator Works — and Why ARV’s the Most Important Number in a Flip
After repair value (ARV) is the projected market value of a distressed property after planned renovations are complete. It is not the list price, not the as-is value, and not a guess — it is a data-backed estimate derived from recent comparable sales in the same neighborhood.
ARV drives every other calculation in a fix-and-flip deal:
- Maximum allowable offer (MAO) — how much you can pay for the property
- Rehab budget ceiling — how much renovation is financially justified
- Profit projection — what remains after purchase, holding costs, and closing fees
- Lender qualification — hard money lenders typically advance 65–75% of ARV
Overstating ARV by even 8–10% on a mid-size flip can turn a $40,000 projected profit into a loss. This is why serious investors use a purpose-built ARV calculator rather than a back-of-envelope guess.
ARV = Market value of the subject property after renovations are complete, estimated by analyzing comparable recently sold properties in the same area with similar characteristics.
There are three accepted methods for calculating ARV: the comparable sales approach, the price-per-square-foot method, and the cost approach. Professional appraisers overwhelmingly rely on the comparable sales method — the Uniform Standards of Professional Appraisal Practice (USPAP) treats it as the primary method for residential property. The other two serve as cross-checks.
Method 1: Comparable Sales (CMA) — The Gold Standard
A comparative market analysis (CMA) finds 3–5 properties that have sold recently, are physically similar to your subject property after renovation, and are located in the same micro-market. Each comp’s sale price is then adjusted upward or downward based on differences from the subject, and the adjusted values are reconciled into a single ARV estimate.
Step 1 — Select Comparable Properties
The tighter your comp criteria, the more accurate your ARV. Use these filters as a starting point:
| Criterion | Preferred Range | Acceptable Range |
|---|---|---|
| Sale date | Within 3 months | Within 6 months |
| Distance from subject | Within 0.5 miles | Within 1 mile (same neighborhood) |
| Gross living area (GLA) | Within ±10% | Within ±20% |
| Bedrooms | Same count | ±1 bedroom |
| Bathrooms | Same count | ±0.5 bath |
| Property type | Identical (SFR, duplex, etc.) | Same type required |
| Condition at sale | Renovated / move-in ready | Updated within 5 years |
If you can’t find 3 comps within preferred range, widen the radius before widening the time window — a recent sale a mile away is usually more accurate than a six-month-old sale across the street in a moving market.
Step 2 — Make Dollar Adjustments
No two properties are identical. Each material difference between a comp and your subject property requires a dollar adjustment. The direction of the adjustment follows one rule: if the comp is superior to the subject, adjust the comp downward; if the comp is inferior, adjust it upward.
Common adjustment items and approximate values (these vary by market — always calibrate against local data):
| Feature | Typical Adjustment | Notes |
|---|---|---|
| Gross living area | $40–$120/sqft | Use local $/sqft from paired sales |
| Bedroom (±1) | $5,000–$15,000 | Less impactful if sqft already adjusted |
| Full bathroom (±1) | $8,000–$20,000 | Higher in larger markets |
| Garage (±1 car) | $8,000–$20,000 | Varies by climate/market |
| Pool | $10,000–$40,000 | Lower ROI in colder climates |
| Lot size (per 1,000 sqft) | $2,000–$10,000 | Minimal in dense urban areas |
| Condition (updated vs. dated) | $10,000–$30,000+ | Critical for flip comps |
| Time adjustment (per month) | 0–1.5% of sale price | Apply if market has moved |
Step 3 — Reconcile to a Single ARV
Once you have adjusted values for 3–5 comps, do not simply average them. Give more weight to comps that required fewer adjustments and are most similar to your subject. A common reconciliation approach:
(comps needing fewest adjustments = highest weight)
This method is used by licensed appraisers, lenders, and experienced flippers. For step-by-step guidance, see our full after repair value guide.
Method 2: Price Per Square Foot — Fast Cross-Check
The price-per-square-foot (PPSF) method is faster than a full CMA but less precise. It works best as a sanity check against your comp-adjusted ARV rather than as a primary method.
How to Calculate
- Collect 5–10 recent comparable sales in the neighborhood.
- Divide each sale price by the gross living area to get $/sqft for each comp.
- Discard outliers (highest and lowest), then average the remaining values.
- Multiply the average $/sqft by your subject property’s post-renovation GLA.
Example
| Comp | Sale Price | GLA (sqft) | $/sqft |
|---|---|---|---|
| A | $272,000 | 1,350 | $201.48 |
| B | $289,000 | 1,420 | $203.52 |
| C | $261,000 | 1,300 | $200.77 |
| D | $295,000 | 1,480 | $199.32 |
Average $/sqft = $201.27. Subject GLA after renovation = 1,400 sqft.
This gives a quick range to compare against the CMA result. If the two methods diverge by more than 5–7%, dig deeper before trusting either number. The PPSF method struggles when properties in a neighborhood vary widely in age, lot size, or finish level.
A neighborhood with a mix of 1960s ranches and 2010s two-story builds will show a wide $/sqft range. Using the average without segmenting by decade of construction can produce an ARV that is $30,000–$50,000 off. Always segment your comp pool before averaging.
Method 3: Cost Approach — For Unique Properties
The cost approach estimates value by calculating what it would cost to build an equivalent property from scratch, then subtracting depreciation. It is most relevant for unusual properties with few comps — a custom home on an oversized lot, a historic conversion, or a property in a rural area with sparse sales data.
Three Components
1. Land Value — Estimate using recent vacant lot sales in the same area, or by extracting land value from comparable improved sales (land residual technique).
2. Replacement Cost — The cost to construct an equivalent structure at today’s prices. Per the Appraisal Institute, residential replacement cost in U.S. markets in 2025–2026 ranges from $120/sqft (basic construction) to $280+/sqft (high-end finishes, major metros). Use a cost data service or a contractor estimate rather than national averages.
3. Depreciation — Includes physical deterioration (wear and tear), functional obsolescence (outdated layout, low ceilings), and external obsolescence (proximity to a noisy highway). For a fully renovated flip, physical depreciation is minimal, but functional and external factors may still apply.
Most residential flippers use it only as a tie-breaker when comps are scarce. If you’re flipping a property in a dense urban neighborhood with 20+ comparable sales in the past six months, skip the cost approach and focus on the CMA.
How to Find Comps: 5 Sources Ranked by Reliability
Your ARV is only as good as the comps behind it. Here are the five primary data sources, ranked from most to least reliable for residential fix-and-flip analysis.
1. MLS (Multiple Listing Service)
The MLS is the gold standard. It contains actual recorded sale prices, accurate square footage from listing agents, and detailed feature data. Access requires a real estate agent’s license or a subscription through a broker. If you’re doing more than one or two deals per year, having MLS access — directly or through a buyer’s agent relationship — is non-negotiable.
NAR research consistently shows that MLS-sourced data has a higher degree of accuracy than aggregator platforms because listing agents are incentivized to enter correct data for appraisal purposes.
2. Redfin
Redfin’s public data center pulls directly from MLS feeds in most markets, making it one of the most accurate free alternatives. Its “Recently Sold” filter lets you narrow by bedrooms, bathrooms, square footage, and sale date. Redfin also shows days on market and price drops, which help you identify whether a comp sold at ask or took a concession.
3. Zillow
Zillow Research is widely accessible and useful for getting a quick picture, but it lags MLS data by a few days to weeks and occasionally shows public record price rather than net sale price. Use it to identify candidates, then verify with MLS or Redfin.
4. County Assessor / Public Records
Every recorded sale in the United States becomes a public record filed with the county assessor or recorder. These records are free and unfiltered — including sales that never hit the MLS (estate sales, off-market transfers). The downside: details like square footage and condition may be outdated or missing. Pair public records with photo verification on Google Street View or a drive-by inspection.
5. PropStream, BatchData, and Similar Platforms
Paid data platforms aggregate MLS, public records, and assessor data in one place. They’re useful for investors who pull comp data frequently and want filtering, export, and skip-tracing in the same tool. Monthly costs run $100–$300 depending on access level.
Free. No signup required. Results in under 60 seconds.
Worked Example 1: Houston SFR — ARV = $285,000
Subject property: 1,400 sqft single-family ranch, built 1987. Planned renovation: full kitchen remodel, two bathroom updates, LVP flooring throughout, exterior paint, HVAC replacement. Post-renovation condition: fully updated, move-in ready.
Step 1 — Identify Comps
Three recently sold properties in the same zip code, all within 0.6 miles, all sold within 90 days in updated condition:
| Comp | Sale Price | GLA | Beds/Baths | Garage | Pool | Sold |
|---|---|---|---|---|---|---|
| Comp 1 | $278,000 | 1,380 sqft | 3 / 2 | 2-car | No | 62 days ago |
| Comp 2 | $295,000 | 1,460 sqft | 3 / 2 | 2-car | Yes | 41 days ago |
| Comp 3 | $271,500 | 1,350 sqft | 3 / 2 | 1-car | No | 28 days ago |
Subject property: 1,400 sqft, 3BR/2BA, 2-car garage, no pool.
Step 2 — Adjustments
Local $/sqft derived from paired sales: $85/sqft for GLA differences. Garage adjustment: $12,000 per car space. Pool: $18,000.
| Item | Comp 1 Adj. | Comp 2 Adj. | Comp 3 Adj. |
|---|---|---|---|
| Sale price | $278,000 | $295,000 | $271,500 |
| GLA vs. 1,400 sqft | +$1,700 (1,380→1,400: +20 sqft × $85) |
−$5,100 (1,460→1,400: −60 sqft × $85) |
+$4,250 (1,350→1,400: +50 sqft × $85) |
| Garage (subject = 2-car) | $0 | $0 | +$12,000 (comp has 1-car) |
| Pool (subject = no pool) | $0 | −$18,000 (comp has pool) |
$0 |
| Adjusted Value | $279,700 | $271,900 | $287,750 |
Step 3 — Reconcile
Comp 1 required only one small adjustment — it’s the closest match and gets the highest weight (40%). Comp 3 also closely matches but needed a larger GLA and garage adjustment (35%). Comp 2 required two significant adjustments and gets the lowest weight (25%).
= $111,880 + $100,713 + $67,975
= $280,568 → rounded to $281,000
Cross-check with PPSF: Average $/sqft from three comps = $201.29. × 1,400 sqft = $281,800. Both methods converge near $281,000–$282,000.
A professional would round conservatively to reflect market uncertainty:
Conservative rounding applied; actual offers should use $280K for MAO calculation.
Worked Example 2: Tampa Duplex — ARV = $380,000
Subject property: Duplex, each unit 2BR/1BA, total 1,900 sqft GLA (950 sqft per unit). Built 1978. Planned renovation: new electrical panel, updated kitchens in both units, bathroom updates, new roof, exterior paint. Post-renovation: fully updated duplex, both units vacant at sale.
For income-producing properties, appraisers cross-check the sales comparison approach against the income approach (cap rate analysis). For a small duplex in an owner-occupant market, the sales comparison approach typically drives value. For larger multi-family, income approach dominates. See our fix-and-flip calculator for income-property deal analysis.
Comp Selection
Finding duplex comps is harder than SFR comps — there are simply fewer sales. The search radius was widened to 1.2 miles and the time window extended to 5 months to find three suitable comps.
| Comp | Sale Price | Total GLA | Units | Condition at Sale | Days Ago |
|---|---|---|---|---|---|
| Comp A | $365,000 | 1,860 sqft | 2 × 2BR/1BA | Updated | 38 |
| Comp B | $395,000 | 2,050 sqft | 2 × 2BR/1BA | Updated + new roof | 91 |
| Comp C | $352,000 | 1,820 sqft | 2 × 2BR/1BA | Updated | 142 |
Adjustments
Local duplex $/sqft from paired sales: $95/sqft. Time adjustment for 142-day-old sale in a market that appreciated approximately 0.5%/month: +$5,280 (2.5 months × 0.5% × $352,000 ÷ 2 = partial adjustment; applied $5,000 for simplicity).
| Item | Comp A | Comp B | Comp C |
|---|---|---|---|
| Sale price | $365,000 | $395,000 | $352,000 |
| GLA vs. 1,900 sqft | +$3,800 (+40 sqft) |
−$14,250 (−150 sqft) |
+$7,600 (+80 sqft) |
| Time adjustment | $0 | $0 | +$5,000 |
| Adjusted Value | $368,800 | $380,750 | $364,600 |
Reconciliation
= $147,520 + $133,263 + $91,150
= $371,933 → rounded to $372,000
The investor applied a modest upward adjustment because the subject duplex would include a brand-new roof — a feature that Comp B commanded a premium for. After reviewing Comp B’s DOM and final sale data, an additional $8,000 was added.
Use $372,000 for conservative MAO calculation; $380,000 as upside scenario.
MAO Calculation: Turning ARV Into an Offer Price
Once you have a reliable ARV, the next step is calculating the maximum allowable offer (MAO) — the highest price you can pay for the property and still make your target profit. The most widely used formula is the 70% rule.
The 70% factor leaves room for:
- Profit (typically 10–15% of ARV)
- Selling costs — agent commissions (5–6%), closing costs (1–2%)
- Holding costs — loan interest, taxes, insurance, utilities
- Contingency — unexpected rehab items, cost overruns
Houston Example — MAO Calculation
Rehab = $62,000
MAO = ($285,000 × 0.70) − $62,000
= $199,500 − $62,000
= $137,500
If Maria can acquire the Houston ranch for $137,500 or less, she is within the 70% rule parameters. Above that threshold, the deal becomes marginal — a rise in rehab costs or a softening of the market could eliminate her profit entirely.
In highly competitive metro markets (DFW, Tampa, Phoenix), experienced investors sometimes use 75% because competition has compressed margins. In slower or rural markets, 65% is more appropriate. Our 70% rule calculator lets you test different percentages and scenarios.
For a full walk-through of how MAO fits into the overall deal analysis, see our guides on the 70% rule in real estate flipping and the maximum allowable offer calculator.
Rehab cost estimation deserves its own analysis — overestimating kills deals, underestimating kills profits. Our cost to rehab a house guide and rehab cost estimator guide both cover line-item budgeting in depth.
5 ARV Mistakes That Cost Investors Real Money
The difference between a profitable flip and a loss is often not the deal itself — it’s the ARV estimate. Here are the five most costly mistakes, in order of how frequently they occur.
Mistake 1: Cherry-Picking Comps
Selecting only the highest-priced recent sales to justify a predetermined ARV is the most common and most dangerous mistake. It usually happens when an investor has already fallen in love with a property and is reverse-engineering the numbers to make the deal work.
The fix: gather all comparable sales in your criteria window, eliminate outliers based on objective criteria (distressed sales, estate sales at below-market prices, non-arm’s-length transactions), and work with what’s left — even if the resulting ARV is lower than you hoped.
Mistake 2: Ignoring Time Adjustments
A sale from six months ago in a market that has moved 5% since then is not a valid comp without adjustment. In a rising market, failing to apply a time adjustment understates your ARV. In a declining market — arguably the more dangerous scenario — it overstates it.
According to Zillow’s Home Value Index methodology, metro-level home value changes can accelerate or reverse within a single quarter. Always check whether the market has moved since your oldest comp sold.
Mistake 3: Using the Wrong Square Footage
Gross living area (GLA) in an appraisal includes only above-grade finished space. A finished basement does not count as GLA under USPAP guidelines, even if it has bedrooms and full bathrooms. Using total square footage (including basement) instead of above-grade GLA inflates your ARV by the basement $/sqft — often $30,000–$60,000 on a mid-size home.
Always confirm whether your comps’ square footage figures are above-grade GLA or total finished area before running calculations.
Mistake 4: Ignoring Market Direction
An ARV estimate is not a static number — it reflects conditions at a specific point in time. If you’re projecting a 4-month rehab timeline and the market is softening, your actual selling price may be 3–5% below your ARV estimate. Build this into your underwriting by using a slightly lower ARV (95% of estimate) or by shortening the projected hold period.
Redfin’s market data center publishes weekly median sale price, days on market, and sale-to-list ratio data by metro — all useful leading indicators of market direction.
Mistake 5: Over-Improving for the Neighborhood
Installing a $25,000 kitchen in a neighborhood where fully renovated homes sell for $180,000 will not produce a $205,000 sale price. The market caps the value regardless of what you spend. This is the principle of contribution in appraisal — an improvement adds value only to the extent the market recognizes it.
Before finalizing your renovation scope, confirm that the planned finish level matches what buyers in that price range expect. A full guide to scoping renovations for maximum ROI is in our fix-and-flip guide and our house flipping profit calculator guide.
If your ARV estimate is significantly higher than all three of your comps — even before adjustments — stop. You are likely in mistake territory. A valid ARV should fall within the range established by your adjusted comps, not above the top of that range.
ARV in the BRRRR Strategy
The BRRRR method (Buy, Rehab, Rent, Refinance, Repeat) relies on ARV just as heavily as a standard flip — arguably more so, because the refinance amount is directly tied to the appraised after-repair value. If a lender will refinance at 75% LTV and your ARV is $285,000, you can pull out $213,750 in the refi. If the actual appraised value comes in at $260,000, you pull out $195,000 — a $18,750 gap that could prevent you from recycling capital into the next deal.
Our BRRRR calculator models the full cycle including the refinance step, so you can see exactly how ARV sensitivity affects your cash-out and overall return.
Using an After Repair Value Calculator: What to Look For
A quality after repair value calculator should do more than multiply comps by square footage. The most useful tools:
- Accept multiple comps with individual adjustments (not just averages)
- Calculate weighted reconciled ARV automatically
- Link ARV directly to MAO and profit calculation
- Allow scenario testing (low/base/high ARV) to stress-test the deal
- Export or save results for lender presentations
Our free ARV calculator handles all of the above. It also connects to the fix-and-flip calculator so you can run the full deal analysis — acquisition, rehab, holding costs, selling costs, and projected profit — in one flow.
For investors working on BRRRR or rental conversions, the same ARV estimate feeds into our BRRRR calculator, which models refinance proceeds and long-term cash flow simultaneously.
Enter your comps and get a reconciled ARV in under 2 minutes.
Frequently Asked Questions
There’s no universal “good” ARV — what matters is the relationship between ARV, purchase price, and rehab cost. Under the 70% rule, your total investment (purchase + rehab) should not exceed 70% of ARV. A deal where you pay $130,000, spend $55,000 on rehab, and sell for $280,000 ARV is solid — your $185,000 total investment is 66% of ARV, leaving room for selling costs and a healthy profit. An ARV of $1M is irrelevant if the all-in cost is $980,000.
A well-researched ARV using 3–5 tight comps is typically accurate within ±5–7%. The actual appraised value (which determines lender financing) may differ from your estimate depending on which comps the appraiser selects and how they weight adjustments. To manage this risk, conservative investors underwrite at 95% of their estimated ARV. In fast-moving markets, the actual sale price often exceeds the ARV estimate if you price correctly and market conditions improve during the hold period.
The minimum for a defensible ARV estimate is three comps. USPAP-compliant appraisals typically use three to five. More comps reduce reliance on any single data point and give you a clearer picture of the market range. If you can only find two comps within acceptable criteria, widen the radius incrementally (0.25 miles at a time) before widening the time window. Fewer than three comps means your ARV carries significantly more uncertainty — build in a larger contingency accordingly.
No — not reliably. The Zestimate is an automated valuation model (AVM) based on publicly available data. It does not account for the specific renovation scope planned, it often lags real market conditions by weeks, and its median error rate nationally is around 2–4% (higher in thin markets). For a property that’s currently distressed, the Zestimate reflects the as-is condition, not the post-renovation value. Use Zillow to identify comp candidates, then build your ARV manually using adjusted comparable sales.
No. ARV is the projected market value of the property after renovations are complete — it does not include rehab costs as a line item. Renovation costs are a separate variable in the deal analysis. The formula is: Profit = ARV − Purchase Price − Rehab Costs − Holding Costs − Selling Costs. ARV is the ceiling; everything below it is a cost subtracted on the way to profit.
ARV is your estimate of what the property will be worth after renovation — calculated before the work is done. Appraised value is a licensed appraiser’s official opinion of market value, typically conducted after renovation for a refinance or at sale for a lender. A well-researched ARV estimate should be close to the eventual appraised value, but differences occur because appraisers may select different comps or weigh adjustments differently. Hard money lenders often conduct their own ARV appraisal (called an “as-completed” appraisal) before funding a renovation loan.
In BRRRR (Buy, Rehab, Rent, Refinance, Repeat), ARV determines your cash-out refinance amount. If your lender refinances at 75% LTV and your ARV is $300,000, you can pull out up to $225,000. If your total investment was $200,000 (purchase + rehab), you’ve recycled all your capital and still own the property. ARV accuracy is critical here — an overestimate means the appraiser comes in lower at refi, leaving you short on capital to fund the next deal. Use our BRRRR calculator to model this scenario.
Related Calculators and Guides
ARV is one input in a larger deal analysis. These tools handle the rest of the calculation stack:
In-Depth Guides
- The Complete After Repair Value Guide — deeper to comp selection and appraisal methodology
- Fix and Flip Guide for Beginners and Experienced Investors — end-to-end flipping strategy
- The 70% Rule in Real Estate Flipping — when to use it, when to adjust it
- How Much Does It Cost to Rehab a House? — line-item rehab budgeting by trade
- House Flipping Profit Calculator Guide — understanding your true net return
- Rehab Cost Estimator Guide — scope of work templates and cost benchmarks
- Maximum Allowable Offer Calculator Guide — MAO methodology explained
Bottom Line
An accurate after repair value calculator is the foundation of every profitable fix-and-flip. Without it, every other number in your deal analysis — your offer price, your rehab budget ceiling, your projected profit — is built on unstable ground.
The process is straightforward when you follow the steps: find 3–5 comparable sales of renovated properties in the same micro-market, adjust each comp for meaningful differences, reconcile the adjusted values with appropriate weighting, and cross-check with the price-per-square-foot method. When both methods point to the same range, you have a defensible ARV.
From there, the 70% rule converts your ARV into a maximum allowable offer — giving you a hard number to anchor your negotiation and protect your margin even when costs run over or the market softens.
Use the free tools here to run the numbers on your next deal before you make an offer.
Free · No account needed · Results in under 2 minutes
{
“@context”: “https://schema.org”,
“@type”: “FAQPage”,
“mainEntity”: [
{
“@type”: “Question”,
“name”: “What is a good ARV for a fix-and-flip deal?”,
“acceptedAnswer”: {
“@type”: “Answer”,
“text”: “There’s no universal “good” ARV u2014 what matters is the relationship between ARV, purchase price, and rehab cost. Under the 70% rule, your total investment (purchase + rehab) should not exceed 70% of ARV. A deal where you pay $130,000, spend $55,000 on rehab, and sell for $280,000 ARV is solid u2014 your $185,000 total investment is 66% of ARV, leaving room for selling costs and a healthy profit. An ARV of $1M is irrelevant if the all-in cost is $980,000.”
}
},
{
“@type”: “Question”,
“name”: “How accurate is an ARV estimate?”,
“acceptedAnswer”: {
“@type”: “Answer”,
“text”: “A well-researched ARV using 3u20135 tight comps is typically accurate within u00b15u20137%. The actual appraised value (which determines lender financing) may differ from your estimate depending on which comps the appraiser selects and how they weight adjustments. To manage this risk, conservative investors underwrite at 95% of their estimated ARV. In fast-moving markets, the actual sale price often exceeds the ARV estimate if you price correctly and market conditions improve during the hold period.”
}
},
{
“@type”: “Question”,
“name”: “How many comps do I need to calculate ARV?”,
“acceptedAnswer”: {
“@type”: “Answer”,
“text”: “The minimum for a defensible ARV estimate is three comps. USPAP-compliant appraisals typically use three to five. More comps reduce reliance on any single data point and give you a clearer picture of the market range. If you can only find two comps within acceptable criteria, widen the radius incrementally (0.25 miles at a time) before widening the time window. Fewer than three comps means your ARV carries significantly more uncertainty u2014 build in a larger contingency accordingly.”
}
},
{
“@type”: “Question”,
“name”: “Can I use Zillow’s Zestimate as my ARV?”,
“acceptedAnswer”: {
“@type”: “Answer”,
“text”: “No u2014 not reliably. The Zestimate is an automated valuation model (AVM) based on publicly available data. It does not account for the specific renovation scope planned, it often lags real market conditions by weeks, and its median error rate nationally is around 2u20134% (higher in thin markets). For a property that’s currently distressed, the Zestimate reflects the as-is condition, not the post-renovation value. Use Zillow to identify comp candidates, then build your ARV manually using adjusted comparable sales.”
}
},
{
“@type”: “Question”,
“name”: “Does ARV include the cost of renovations?”,
“acceptedAnswer”: {
“@type”: “Answer”,
“text”: “No. ARV is the projected market value of the property after renovations are complete u2014 it does not include rehab costs as a line item. Renovation costs are a separate variable in the deal analysis. The formula is: Profit = ARV u2212 Purchase Price u2212 Rehab Costs u2212 Holding Costs u2212 Selling Costs. ARV is the ceiling; everything below it is a cost subtracted on the way to profit.”
}
},
{
“@type”: “Question”,
“name”: “What’s the difference between ARV and appraised value?”,
“acceptedAnswer”: {
“@type”: “Answer”,
“text”: “ARV is your estimate of what the property will be worth after renovation u2014 calculated before the work is done. Appraised value is a licensed appraiser’s official opinion of market value, typically conducted after renovation for a refinance or at sale for a lender. A well-researched ARV estimate should be close to the eventual appraised value, but differences occur because appraisers may select different comps or weigh adjustments differently. Hard money lenders often conduct their own ARV appraisal (called an “as-completed” appraisal) before funding a renovation loan.”
}
},
{
“@type”: “Question”,
“name”: “How does ARV apply to the BRRRR strategy?”,
“acceptedAnswer”: {
“@type”: “Answer”,
“text”: “In BRRRR (Buy, Rehab, Rent, Refinance, Repeat), ARV determines your cash-out refinance amount. If your lender refinances at 75% LTV and your ARV is $300,000, you can pull out up to $225,000. If your total investment was $200,000 (purchase + rehab), you’ve recycled all your capital and still own the property. ARV accuracy is critical here u2014 an overestimate means the appraiser comes in lower at refi, leaving you short on capital to fund the next deal. Use our BRRRR calculator to model this scenario.”
}
}
]
}
Frequently Asked Questions
How do I use the ARV calculator?
Enter your comparable sales data (3-5 recent sales of renovated properties nearby), the calculator averages them with adjustments for square footage and condition differences. Enter your purchase price and rehab budget to see the 70% rule max offer and projected profit.
Is the ARV calculator accurate?
The calculator is only as accurate as the comparable sales you input. Use recent sales (within 6 months), within 0.5-1 mile, of similar size and condition. The more relevant your comps, the more accurate your ARV estimate. Always add a 3-5% safety margin to account for market uncertainty.
What is ARV in real estate?
After Repair Value (ARV) is the estimated market value of a property after all renovations are complete. It is the key number for fix-and-flip investors and BRRRR strategy — your profit depends on the gap between your total cost (purchase + rehab) and the ARV.
How many comps do I need for ARV?
Use 3-5 comparable sales minimum. More comps give a more reliable estimate. All comps should be within 0.5-1 mile, sold within the last 6 months, similar in size (within 20% of square footage), and in renovated condition similar to your planned rehab level.
Can I use the ARV calculator for BRRRR?
Yes. Enter your ARV to calculate the refinance amount (typically 75% of ARV for DSCR loans). Compare the refinance proceeds against your total investment (purchase + rehab) to see how much capital you recover. A good BRRRR deal recovers 90-100% of invested capital.
Leave a Reply