Last updated: September 24, 2026 · Originally published: September 9, 2026 · By Alex Petrov
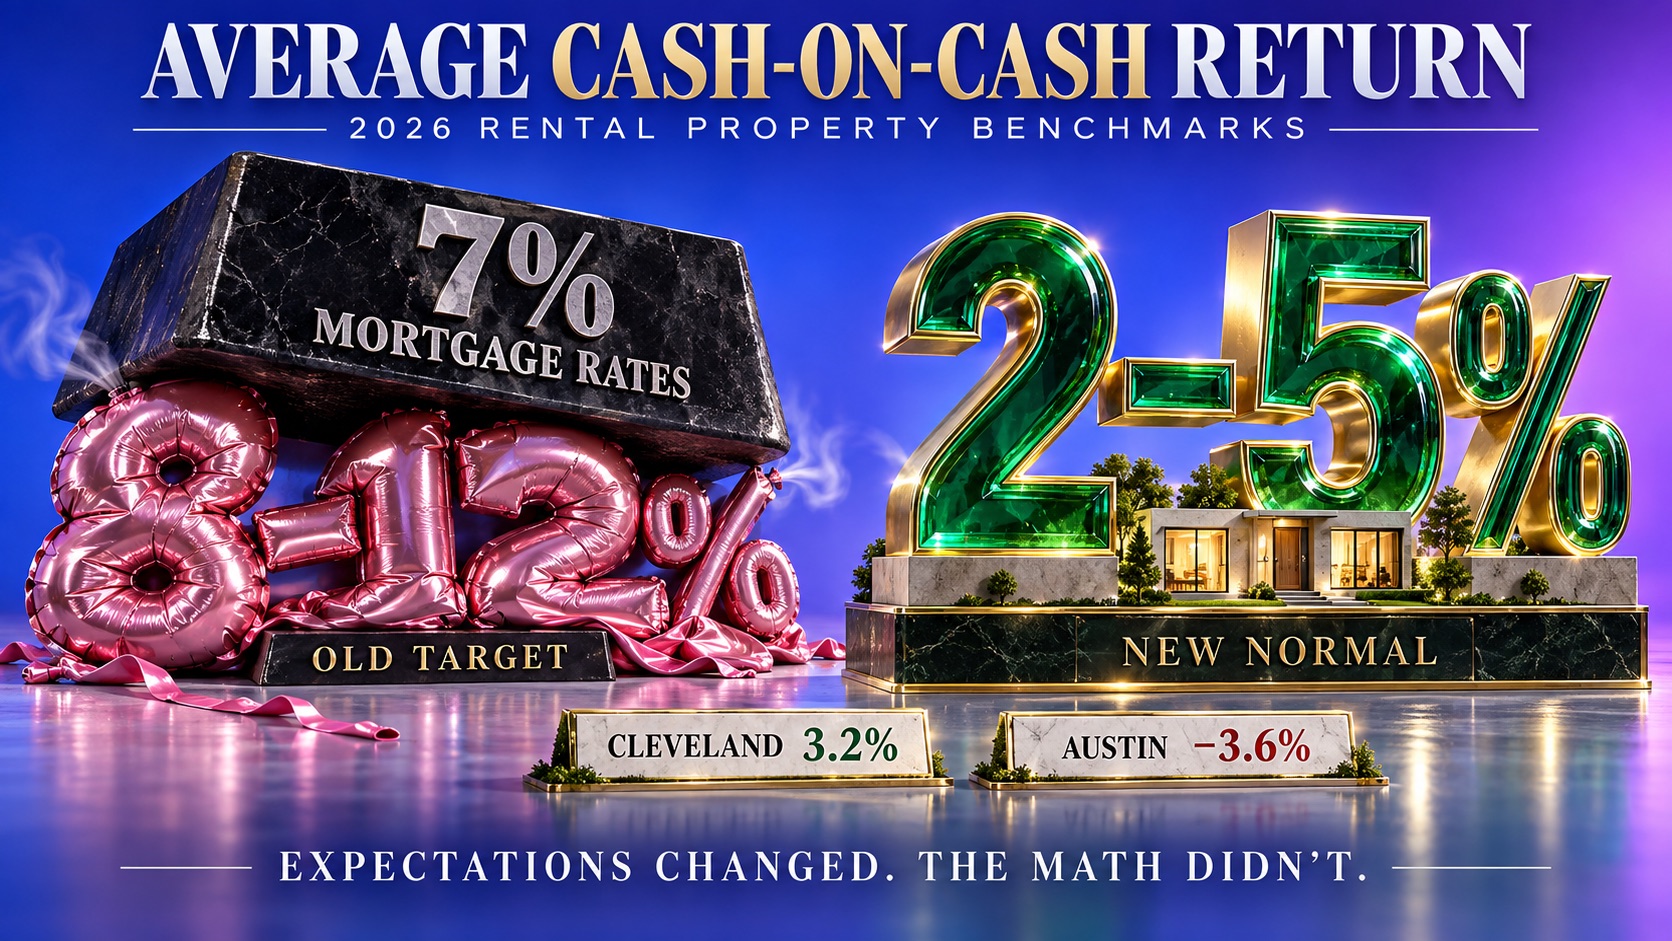
The average cash-on-cash return for rental property in 2026 is 2–5% for buy-and-hold investors using conventional financing at 6.5–7.5% mortgage rates. That is far below the 8–12% that most real estate books and courses promise — because those numbers were written when rates were 3–4%. At current rates, a $200K property with $1,400/month rent and 25% down produces approximately 3.2% cash-on-cash return after all expenses. Here is what “average” actually means by market, property type, and strategy — with benchmarks to tell you if your deal is above or below average.
What Is Cash-on-Cash Return?
Cash-on-Cash = Annual Pre-Tax Cash Flow ÷ Total Cash Invested × 100
If you invest $50,000 cash (down payment + closing costs) and receive $2,000/year in net cash flow after all expenses and mortgage, your cash-on-cash return is 4.0%. This measures the return on your actual cash — not the property’s total return (which includes appreciation, principal paydown, and tax benefits).
Cash-on-cash is the metric that answers: “What am I earning on the money I put in?” It is the most conservative return metric because it ignores all the “paper” returns. Calculate yours in the cash-on-cash calculator.
Average Cash-on-Cash Return by Market (2026)
| Market Type | Avg Cash-on-Cash | Example Cities | Why |
|---|---|---|---|
| Midwest Cash Flow | 3–6% | Cleveland, Indianapolis, Memphis, Fort Wayne | Low prices, decent rents, moderate expenses |
| Southeast Balanced | 1–4% | Augusta, Greensboro, Chattanooga, Clarksville | Moderate prices, steady demand |
| Sun Belt Appreciation | -2% to 1% | Charlotte, Houston, Nashville, Phoenix | High prices, strong appreciation but negative CF |
| Coastal/Gateway | -5% to -1% | Austin, Tampa, Denver, San Diego | Very high prices, rents can’t cover mortgage |
Key insight: The “average” cash-on-cash return in 2026 is much lower than historical norms because mortgage rates doubled from 3.5% (2021) to 7.0% (2026) while rents only grew 15–20%. The mortgage payment ate the entire cash flow improvement. Per FRED data, 30-year fixed rates entered September 2026 at 6.66%.
Average Cash-on-Cash by Property Type
| Property Type | Avg Cash-on-Cash (2026) | Why |
|---|---|---|
| Duplex/Triplex | 4–7% | Multiple rent streams, shared expenses |
| SFR (Midwest) | 2–5% | Single income stream, standard expenses |
| Fourplex | 5–9% | Best unit economics, still residential financing |
| SFR (Sun Belt) | -3% to 1% | High prices crush CoC despite no income tax |
| Condo | -1% to 3% | HOA fees eat cash flow |
The pattern is clear: multifamily (2–4 units) produces 2–3% higher cash-on-cash than SFR at the same price point because rent scales faster than expenses. Two units sharing one tax bill, one insurance policy, and one management contract generate more cash flow per dollar invested. Compare in the multifamily calculator.
Worked Example: What 3.2% Cash-on-Cash Looks Like
Property: Cleveland SFR, $180K, $1,400/mo rent

Cash Invested:
 Down Payment (25%): $45,000
 Closing Costs (3%): $5,400
 Total Cash In: $50,400

Annual Cash Flow:
 Gross Rent: $16,800
 Vacancy (6%): −$1,008
 Property Tax: −$2,448
 Insurance: −$2,100
 Management (9%): −$1,421
 Maintenance (8%): −$1,264
 CapEx (5%): −$790
 NOI: $7,769
 Mortgage P&I: −$6,156
 Annual Cash Flow: $1,613

Cash-on-Cash: $1,613 / $50,400 = 3.2%
3.2% is above the national average for 2026. Most markets produce 1–3%. This Cleveland deal works because the rent-to-price ratio (0.78%) is strong enough to cover expenses AND mortgage at 7%.
Now the same math in Austin ($420K, $2,200 rent):
Cash Invested: $105,000 + $12,600 = $117,600
Annual Cash Flow: -$4,200 (negative)
Cash-on-Cash: -$4,200 / $117,600 = -3.6%
Austin produces negative 3.6% cash-on-cash. You lose $350/month. The total return may be positive (appreciation + equity), but the cash return on your $117K is negative. Run your deal in the cash-on-cash calculator.
What Is a “Good” Cash-on-Cash Return in 2026?
| Rating | Cash-on-Cash | What It Means |
|---|---|---|
| Excellent | 8%+ | Rare at 2026 rates. Requires below-market buy or multifamily. |
| Good | 5–8% | Strong. Typically duplex/triplex in Midwest markets. |
| Average | 2–5% | Typical SFR in cash flow markets at market price. |
| Below Average | 0–2% | Breakeven. Property builds equity but produces no cash income. |
| Poor | Negative | You subsidize monthly. Only works if appreciation compensates. |
The 8–12% targets from pre-2022 are outdated at current rates. Adjusting expectations: 5%+ is excellent in 2026, 3%+ is good, positive is acceptable. Per NAR, the median existing home price reached $440,600 in June 2026 — making high CoC returns nearly impossible without below-market acquisition or multifamily.
How to Improve Your Cash-on-Cash Return
1. Increase Down Payment
Counter-intuitive: a LARGER down payment LOWERS your cash-on-cash return because you have more cash invested. But it INCREASES your monthly cash flow. For pure CoC optimization, use the minimum down payment (20%) — more leverage = higher CoC if the deal cash flows.
2. Target Multifamily
Duplexes produce 2–3% higher CoC than SFR. A $180K duplex with $1,800/month rent vs a $180K SFR with $1,200/month rent: same cash invested, $600/month more income = 7–8% CoC vs 2–3%.
3. Self-Manage
Eliminating 9% management fee on $1,400/month rent saves $1,512/year. On $50K invested: +3.0% CoC improvement. Only worthwhile if you are local and have fewer than 5 units.
4. Buy Below Market
Every dollar below market is a dollar less cash invested. A $180K property purchased at $160K ($20K discount) reduces cash invested by $5K down payment. If cash flow stays the same: CoC jumps from 3.2% to 3.6%. Use the ARV calculator to verify value.
5. Negotiate Interest Rate
0.25% lower rate on a $135K loan saves $20/month ($240/year). On $50K cash invested: +0.5% CoC. Shop 3+ lenders. Buy down the rate with points if the math works over your hold period.
Cash-on-Cash vs Other Return Metrics
| Metric | What It Measures | Includes Financing? | Typical 2026 Range |
|---|---|---|---|
| Cash-on-Cash | Return on cash invested | Yes | -3% to 7% |
| Cap Rate | Unlevered property yield | No | 3% to 8% |
| Total ROI | All returns over hold period | Yes | 40% to 100% (5yr) |
| IRR | Annualized total return | Yes | 8% to 15% |
Cash-on-cash is the most conservative. A property with -2% CoC may still produce 12% IRR over 10 years because appreciation and principal paydown dwarf the negative cash flow. Both metrics matter — CoC for monthly sustainability, total ROI for wealth building. Compare in the ROI calculator and IRR calculator.
How Mortgage Rates Affect Cash-on-Cash Return
Mortgage rates are the single biggest driver of cash-on-cash return. The same Cleveland deal ($180K, $1,400/month, 25% down) at different rates:
| Rate | Monthly P&I | Annual CF | Cash-on-Cash |
|---|---|---|---|
| 4.0% (2021) | $645 | $7,693 | 15.3% |
| 5.0% | $725 | $6,733 | 13.4% |
| 6.0% | $809 | $5,731 | 11.4% |
| 7.0% (2026) | $899 | $4,649 | 9.2% |
| 7.5% | $945 | $4,093 | 8.1% |
| 8.0% | $992 | $3,528 | 7.0% |
Every 0.5% rate increase reduces cash-on-cash by ~1.1 percentage points. The same property that produced 15.3% CoC at 4% rates (2021) produces 9.2% at 7% rates. Per Zillow Research, median rents grew only 18% from 2021 to 2026, while mortgage costs grew 39%.
If the Fed cuts rates, every 0.5% decrease adds ~1.1% to your CoC. A property producing 3.2% CoC today would produce 4.3% at 6.5%. “Marry the property, date the rate.” Stress test at different rates in the cash flow calculator.
Average Cash-on-Cash by State
| State | Avg CoC (SFR) | Key Factor |
|---|---|---|
| Tennessee | 3-6% | 0% income tax + 0.56% property tax |
| Indiana | 2-5% | Low prices, 0.85% tax |
| Ohio | 2-4% | Low prices, 1.36% tax drags CoC |
| Georgia | 1-3% | Atlanta prices raise average |
| North Carolina | 0-2% | Rising insurance $3,000 |
| Texas | -1% to 2% | 1.60% tax + $3,300 insurance |
| Florida | -3% to 0% | $4,500 insurance destroys CoC |
Tennessee and Indiana produce the highest average cash-on-cash returns. Per US Census ACS data, states with effective property tax below 1.0% consistently produce 1-2% higher CoC. For state analysis: Tennessee, Indiana, Ohio, Texas, Florida calculators.
5 Cash-on-Cash Return Mistakes
1. Comparing to Pre-2022 Benchmarks
“My CoC is only 3%, that’s terrible.” No — 3% is above average for 2026. At 3.5% rates (2021), 8% CoC was normal. At 7% rates, 3% is the new normal. Adjust your expectations to the current rate environment.
2. Ignoring Vacancy and CapEx
Calculating CoC with 0% vacancy and 0% CapEx inflates your return by 3–5 percentage points. Always include 5–8% vacancy and 3–5% CapEx. The “real” CoC is always lower than the “spreadsheet” CoC.
3. Using Gross Rent Instead of Net Cash Flow
CoC = cash flow ÷ cash invested. NOT rent ÷ cash invested. Gross rent minus ALL expenses minus mortgage = cash flow. Using rent alone overstates CoC by 2–3×.
4. Forgetting Closing Costs in Cash Invested
Cash invested includes down payment AND closing costs AND any initial rehab. A $45K down payment + $5.4K closing = $50.4K total cash invested, not $45K. This alone reduces CoC by 0.3–0.5%.
5. Dismissing Negative CoC Deals
Negative CoC does not mean bad deal. A Nashville property at -2% CoC still builds $20K+ equity per year through appreciation and paydown. The question is: can you afford the monthly subsidy? If yes, negative CoC with strong total ROI is a valid wealth-building strategy.
Frequently Asked Questions
What is a good cash-on-cash return for rental property in 2026?
In 2026 with mortgage rates at 6.5–7.5%, a good cash-on-cash return is 5%+ (excellent), 3–5% (good), 1–3% (average). The pre-2022 benchmark of 8–12% is outdated — rates have doubled since then. Most SFR at market price produce 2–4% CoC. Multifamily (duplex/triplex) can reach 5–8%. Use the cash-on-cash calculator to check your deal.
What is the average cash-on-cash return for rental property?
Why is my cash-on-cash return so low?
Is 3% cash-on-cash return worth it?
What is the difference between cash-on-cash return and cap rate?
Related Calculators and Guides
- Cash-on-Cash Calculator — Calculate your CoC return
- Rental Property Calculator — Full investment analysis
- Cap Rate Calculator — Unlevered return comparison
- ROI Calculator — Total return over hold period
- IRR Calculator — Annualized total return
- Cash Flow Calculator — Monthly cash flow analysis
- Multifamily Calculator — Multi-unit analysis
- All 30+ Calculators
Related guides:
Leave a Reply