Real Estate InvestingAug 1, 202613 min read3,246 words
{
“@context”: “https://schema.org”,
“@type”: “FAQPage”,
“mainEntity”: [
{
“@type”: “Question”,
“name”: “What is an ARV calculator by address?”,
“acceptedAnswer”: {
“@type”: “Answer”,
“text”: “An ARV calculator by address lets you enter a specific property address and pull comparable sales nearby to estimate what the property will be worth after repairs. You enter the address, find 3–5 comps sold within 0.5 miles in the last 6 months, adjust for differences in size, beds, baths, and condition, then average the adjusted values to get your after repair value.”
}
},
{
“@type”: “Question”,
“name”: “How accurate is an ARV calculator by address?”,
“acceptedAnswer”: {
“@type”: “Answer”,
“text”: “Accuracy depends on comp quality. With 3–5 recent, nearby, similar comps you can get within 5–10% of actual market value. Using stale sales (over 6 months), comps more than 1 mile away, or skipping adjustments can push your estimate 15–25% off — which can turn a profitable flip into a loss.”
}
},
{
“@type”: “Question”,
“name”: “Can I use Zillow’s Zestimate as my ARV?”,
“acceptedAnswer”: {
“@type”: “Answer”,
“text”: “No. The Zestimate reflects the property’s current estimated market value in its current condition. ARV is the value after all repairs and upgrades are complete. For a distressed property, the Zestimate may be 20–40% lower than true ARV. Always run your own comp analysis.”
}
},
{
“@type”: “Question”,
“name”: “How many comps do I need to calculate ARV by address?”,
“acceptedAnswer”: {
“@type”: “Answer”,
“text”: “Use a minimum of 3 comps, ideally 5. All should be within 0.5 miles of the subject property, sold in the last 6 months (3 months in fast markets), and similar in size (within 20%), beds, baths, and condition. The more similar the comps, the less adjustment you need and the more reliable the ARV.”
}
},
{
“@type”: “Question”,
“name”: “What is the best free tool to find comps by address?”,
“acceptedAnswer”: {
“@type”: “Answer”,
“text”: “Redfin is widely considered the best free option — it shows sold prices, days on market, and price per square foot with address-level detail. Zillow is also free but shows fewer historical details. For the most accurate data, MLS access through a licensed real estate agent or your county assessor’s website is preferred.”
}
},
{
“@type”: “Question”,
“name”: “How do I adjust comps when calculating ARV by address?”,
“acceptedAnswer”: {
“@type”: “Answer”,
“text”: “Start with your subject property’s features and compare each comp. Add value if the comp is inferior to your subject (e.g., comp has no garage but yours will), subtract if the comp is superior. Common adjustments: square footage (+/- $40–$60/sqft), bedrooms (+/- $8,000–$12,000 each), garage (+/- $10,000–$20,000), pool (+/- $10,000–$15,000), lot size, and condition.”
}
},
{
“@type”: “Question”,
“name”: “What is the 70% rule and how does it use ARV?”,
“acceptedAnswer”: {
“@type”: “Answer”,
“text”: “The 70% rule says you should pay no more than 70% of ARV minus repair costs for a fix-and-flip property. For example, if ARV is $285,000 and repairs are $60,000, your max offer is ($285,000 × 0.70) − $60,000 = $139,500. Use our 70% rule calculator to run these numbers automatically.”
}
}
]
}
Quick Answer: How to Use an ARV Calculator by Address
Enter the property address → pull 3–5 comparable sales within 0.5 miles sold in the last 6 months → adjust each comp for differences in size, beds, baths, garage, and condition → average the adjusted values. That average is your ARV. Run the numbers free with our ARV calculator.
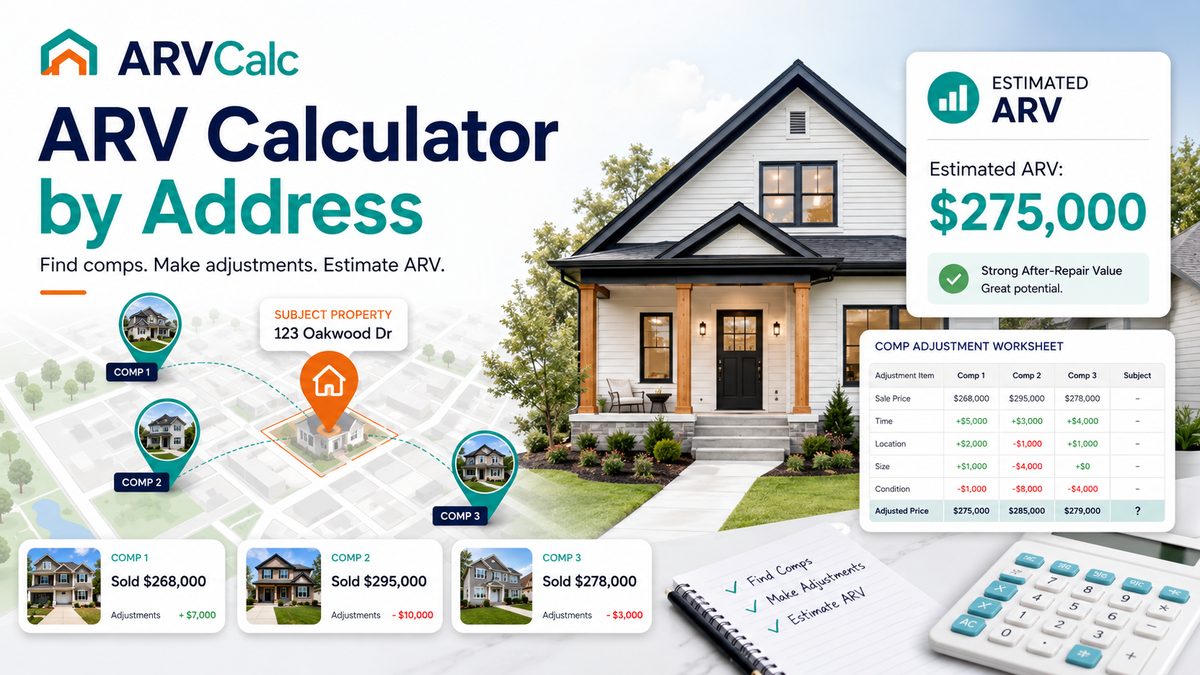
When Sarah found the distressed bungalow at 123 Oak St — peeling paint, dated kitchen, cracked driveway — she knew the first question wasn’t “what will repairs cost?” It was “what will it be worth when I’m done?” That’s exactly what an arv calculator by address is built to answer. You start with a specific address, pull sold comps from the same street and surrounding blocks, adjust for the differences between those sold homes and your finished product, and land on a defensible after repair value you can take to a lender or use to structure your offer.
Below you will find the full process: where to find comps by address, how to make adjustments, two fully worked examples with real math, and the most common mistakes that cause investors to overpay. If you want to skip straight to the numbers, use our ARV calculator — but read the worked examples first so you know your inputs are right.
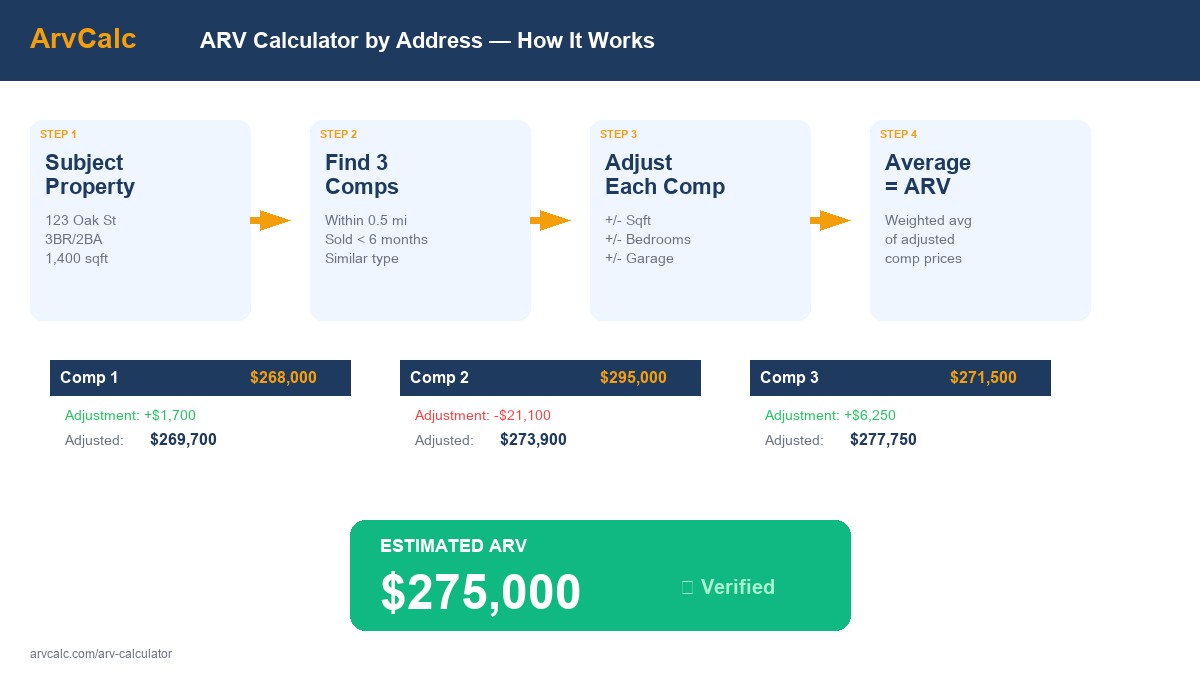
How the ARV Calculator by Address works: find comps, adjust, average = ARV
The address is your anchor. Every other step flows from it — which comps qualify, which don’t, and how much you adjust. Here is the step-by-step process:
Step 1: Enter the Subject Property Address
Open our ARV calculator and enter the full street address including city, state, and ZIP. The address pins your search radius. In a dense urban neighborhood you might pull comps within 0.25 miles. In a rural or suburban area, stretch to 0.5–1 mile — but be aware that the farther you go, the less reliable the comparison.
Note the subject property’s key stats before you search for comps:
Square footage (above-grade living area only)
Bedrooms and bathrooms
Garage (attached, detached, or none)
Lot size
Year built
Planned post-rehab condition and finishes
Step 2: Find Comparable Sales by Address
Search for homes that have sold — not listed, not pending — within 0.5 miles of your subject address in the last 6 months. Tighten to 3 months in a fast-moving market. Your comps should match on:
Property type (single-family, not a condo or townhome)
Square footage within 15–20% of your subject
Same number of bedrooms or ± 1
Same general condition tier (fully renovated comps for a fully renovated subject)
Step 3: Adjust Each Comp for Differences
No two houses are identical. For each difference between a comp and your finished subject, you apply a dollar adjustment. If the comp has a feature your property will lack (say, a pool), you subtract value. If your property will have something the comp didn’t (say, an extra bathroom), you add value. See the full adjustment table in the section below.
Step 4: Average the Adjusted Values
Once you’ve adjusted each comp’s sale price, average all adjusted values. That average is your ARV. If one comp lands significantly above or below the others, investigate why before including it — it may represent a distressed sale or a special-circumstance transaction that skews your estimate.
Our ARV calculator handles all the adjustment math automatically. Enter your comps, input the differences, and get your ARV in seconds.
Where to Find Comps by Address
Your ARV is only as good as your comps. Here are the five sources investors use, from free to professional-grade:
Zillow (Free, Limited)
Zillow shows recent sold prices and you can search by address or draw a map boundary. The sold history is useful for a quick sanity check, but Zillow doesn’t always show the full MLS data, and its address-level search can miss sales that didn’t have a public listing. Good for a first look, not for final underwriting.
Redfin (Free, Better Data)
Redfin pulls directly from MLS in most markets and shows sold price, days on market, price per square foot, and photo history for each sold property. You can filter by sold date, square footage, and beds/baths — making it much more useful than Zillow for pulling address-specific comps. For most investors doing initial deal analysis, Redfin is the go-to free tool.
MLS (Via Agent — Most Reliable for Listed Properties)
A licensed real estate agent can pull a Comparative Market Analysis (CMA) directly from MLS with full data: exact sale price, seller concessions, days on market, and property condition at sale. If you’re buying regularly, building a relationship with an investor-friendly agent gives you on-demand access to the cleanest comp data available.
County Assessor / Public Records (Most Accurate for Off-Market)
Every sale in the US is recorded in public records. Your county assessor’s website shows the recorded sale price, date, and often the property characteristics. This is particularly valuable for finding off-market sales that don’t appear on Zillow or Redfin. Search “[your county] property appraiser search” or check Realtor.com which aggregates some county records. Examples: Miami-Dade Property Appraiser, Harris County Appraisal District, Duval County Property Appraiser.
PropStream (Paid — Investor-Grade)
PropStream and similar platforms (DealMachine, BatchLeads) aggregate MLS, county records, and distressed property data in one place. At roughly $99–$149/month, these tools let you search comps by address with filters for condition, sale type (arm’s-length only), and property characteristics. Worth it if you’re doing more than 2–3 deals per year.
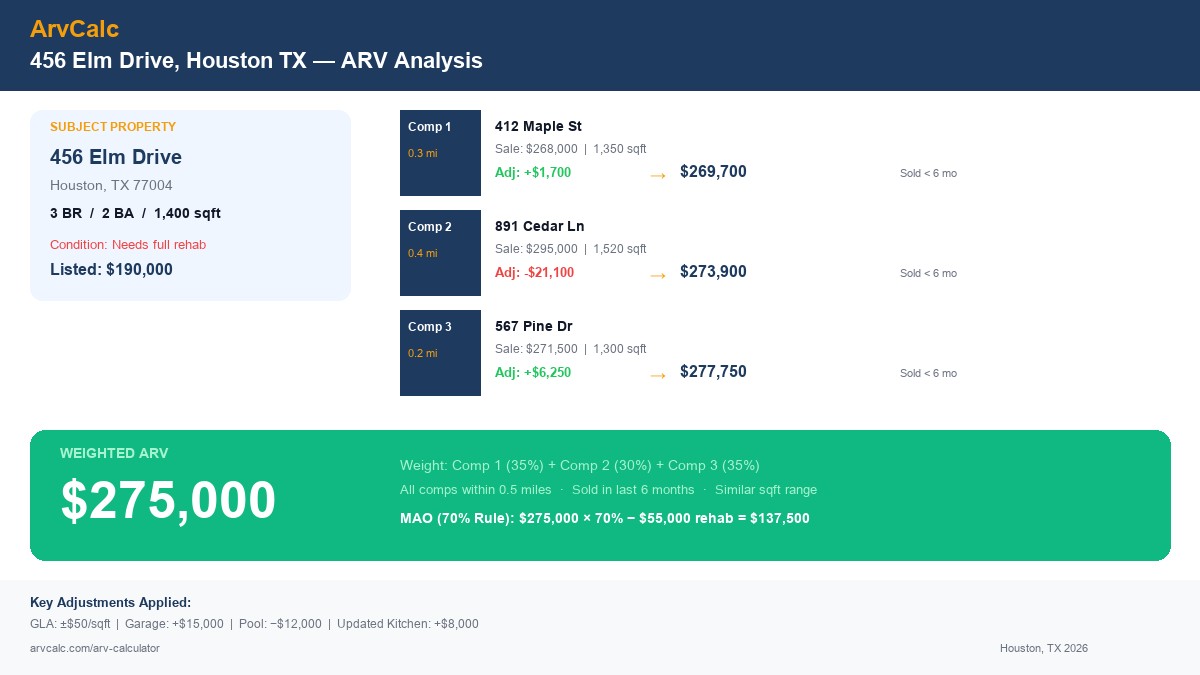
Houston ARV analysis: 3 comps adjusted to 75,000 estimated value
Worked Example: ARV Calculator by Address — 456 Elm Drive, Houston TX
Let’s run a real example from start to finish. The subject property is 456 Elm Drive, Houston, TX — a 3-bedroom, 2-bathroom, 1,400 square foot single-family home built in 1978. The purchase price is $155,000. Estimated rehab cost is $65,000. After rehab, the property will have updated kitchen, new flooring, painted exterior, and a new HVAC — essentially move-in ready condition.
Subject Property Profile
Address: 456 Elm Drive, Houston TX
Beds/Baths: 3/2
Above-grade sqft: 1,400
Garage: None
Pool: No
Post-rehab condition: Fully updated
Comp 1: 412 Elm Drive (sold 6 weeks ago, $268,000)
3 bed / 2 bath / 1,380 sqft / No garage / Updated condition
Average of adjusted values: ($269,000 + $273,000 + $277,000) ÷ 3 = $273,000
Rounding conservatively: ARV = $270,000 – $280,000, center estimate $275,000
With the 70% rule, max offer = ($275,000 × 0.70) − $65,000 = $192,500 − $65,000 = $127,500. The $155,000 purchase price is above the 70% rule threshold — worth negotiating down or revisiting repair costs. Use our 70% rule calculator to model different scenarios.
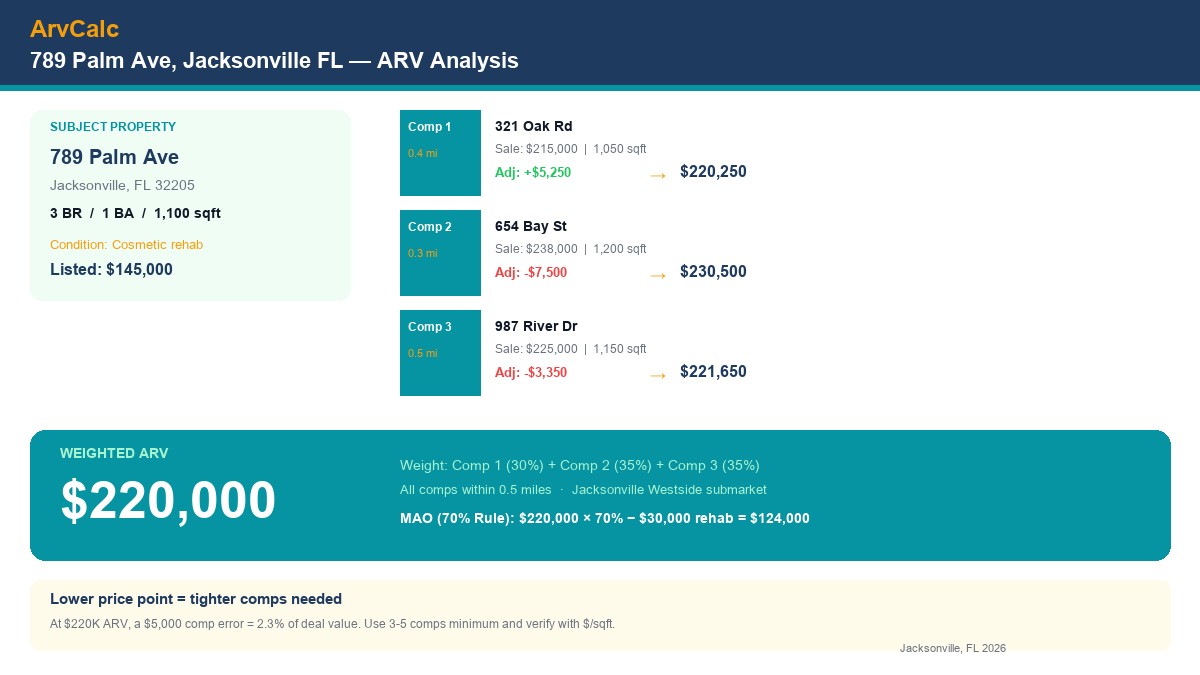
Jacksonville ARV analysis: 3 comps adjusted to $220,000 estimated value
Worked Example: ARV Calculator by Address — 789 Palm Ave, Jacksonville FL
A different market, different price points, same methodology. The subject property is 789 Palm Ave, Jacksonville, FL — a 3-bedroom, 2-bathroom, 1,250 square foot home built in 1985. After rehab: new kitchen, updated bathrooms, new roof. The Jacksonville market is more affordable than Houston, with price-per-sqft running $150–$175 for renovated entry-level single-family homes.
Rounded: ARV = $225,000 – $235,000, center estimate $230,000
At a $230,000 ARV with $45,000 in estimated repairs, the 70% rule gives: ($230,000 × 0.70) − $45,000 = $161,000 − $45,000 = $116,000 max offer. Check our fix and flip calculator to model holding costs, financing, and net profit at different purchase prices.
How to Adjust Comps by Address: Full Adjustment Table
Adjustments are the most debated part of ARV analysis. The ranges below reflect typical single-family residential markets in the US. In high-cost markets (coastal California, NYC suburbs), multiply these figures by 2–3x. In low-cost markets (rural Midwest, parts of the South), adjust downward.
Feature
Comp Superior to Subject
Comp Inferior to Subject
Typical Range
Square footage
Subtract from comp price
Add to comp price
$40–$60 per sqft
Bedroom (each)
−$8,000–$12,000
+$8,000–$12,000
$10,000 typical
Full bathroom (each)
−$8,000–$15,000
+$8,000–$15,000
$10,000–$12,000 typical
Attached garage (1-car)
−$10,000–$20,000
+$10,000–$20,000
$15,000 typical
Pool (in-ground)
−$10,000–$15,000
+$10,000–$15,000
Market-dependent
Condition (full rehab vs. dated)
−$15,000–$30,000
+$15,000–$30,000
Highly variable
Lot size (per 1,000 sqft)
−$1,000–$5,000
+$1,000–$5,000
$2,000–$3,000 typical
Age (per decade older)
−$3,000–$8,000
+$3,000–$8,000
Less relevant if updated
Adjustment rule of thumb: If your total adjustment on any single comp exceeds 10–15% of the sale price, that comp is too different from your subject to be reliable. Either find a closer match or weight that comp less in your average.
Getting the ARV wrong is the most expensive mistake a house flipper can make. Here are the five errors that show up again and again:
Mistake 1: Using Comps That Are Too Far Away
A house one mile away can be in a completely different school district, flood zone, or price tier. A 3/2 that sold for $310,000 in the neighboring subdivision doesn’t tell you much about your $240,000 neighborhood if they’re separated by a major highway or rezoning boundary. Always prioritize comps within 0.25–0.5 miles and the same subdivision when possible.
Mistake 2: Using Stale Sales
A sale from 18 months ago is almost useless in a market that’s moved at all. Interest rate shifts, inventory changes, and seasonal patterns all affect prices. Stick to 6 months maximum — 3 months in active markets. If you can’t find recent comps, that’s a signal the market for that property type is thin, which itself affects liquidity risk.
Mistake 3: Crossing Neighborhood Boundaries
Two streets with the same ZIP code can have dramatically different values based on school boundaries, proximity to commercial corridors, or historical neighborhood associations. Learn to draw your search boundary based on where buyers mentally shop, not just radial distance. Your local county assessor records can show you where price breaks happen street by street.
Mistake 4: Skipping Adjustments
Averaging raw sale prices without adjusting for differences is the most common shortcut — and the most dangerous. If all your comps have 2-car garages and your property won’t, you’re overestimating ARV by $15,000–$25,000. Every difference matters. The adjustment table above is your checklist.
Mistake 5: Using Zestimate as ARV
This one deserves its own section — see below. Short version: Zestimate ≠ ARV. Not even close for distressed properties.
Zestimate vs Real ARV: Why They’re Not the Same Number
Zillow’s Zestimate is one of the most misunderstood numbers in real estate investing. According to Zillow’s own data, the median error is ~2.4% for on-market homes but much higher for distressed properties. Here’s the core issue: the Zestimate estimates what a property is worth today, in its current condition. ARV estimates what a property will be worth after it has been fully repaired and updated. For a move-in-ready home, the two numbers might be close. For a distressed property, they can be 20–40% apart.
Why Zestimate Understates ARV for Distressed Properties
Zillow’s algorithm factors in the property’s condition to the extent it can (typically from listing descriptions, photo analysis, and self-reported condition fields). A house with water damage, missing HVAC, and a condemned kitchen will get a low Zestimate — appropriately — because it’s worth less in that state. But your ARV should reflect the fully renovated version. The Zestimate doesn’t know what your renovation plan is.
Also, Zillow’s median error rate nationally is around 2–3% for on-market homes but jumps to 6–8% for off-market properties. For a $250,000 home, that’s a $15,000–$20,000 error band — before accounting for the condition gap on a distressed property.
What to Use Instead
Pull sold comps manually from Redfin, MLS, or your county’s public records. Filter for fully renovated, recently sold homes near the subject address. Those are your ARV benchmarks — not what Zillow says the distressed version is worth today.
The Zestimate is useful for one thing: a quick sanity check on whether you’re in the right ballpark before you spend time pulling comps. If the Zestimate is $180,000 and you’re modeling an ARV of $340,000, something is wrong with either the Zestimate or your comps. But if you’re building a real investment decision, run real comps through our ARV calculator.
Zillow vs. Redfin vs. County Records: Quick Comparison
Source
Cost
Data Quality
Best For
Zillow / Zestimate
Free
Moderate
Quick sanity check only
Redfin
Free
Good (MLS-sourced)
Initial comp pull
Realtor.com
Free
Good
Cross-referencing comps
County Assessor Records
Free
Best (official)
Off-market & final check
MLS (via agent)
Free (with agent)
Best (full data)
Serious deal underwriting
ARV Calculator by Address vs General ARV Guide
This page focuses on address-specific ARV estimation — pulling comps near a specific property and adjusting them. Use this when you have a deal under contract or a target property.
Frequently Asked Questions: ARV Calculator by Address
What is an ARV calculator by address?
An ARV calculator by address lets you enter a specific property address and pull comparable sales nearby to estimate what the property will be worth after repairs. You enter the address, find 3–5 comps sold within 0.5 miles in the last 6 months, adjust for differences in size, beds, baths, and condition, then average the adjusted values.
How accurate is ARV estimation by address?
With 3–5 recent, nearby, similar comps, you can get within 5–10% of actual market value. Using stale comps (over 6 months old), comps more than 1 mile away, or skipping adjustments can push your estimate 15–25% off — which on a $250,000 ARV means a $37,500 error that turns profit into loss.
Can I use Zillow’s Zestimate as my ARV?
No. The Zestimate reflects current estimated value in current condition. ARV is the value after all repairs and upgrades. For a distressed property, the Zestimate may be 20–40% below true ARV. Always run a full comp analysis rather than relying on any automated valuation model.
How many comps do I need to estimate ARV by address?
Minimum 3, ideally 5. All within 0.5 miles of the subject address, sold in the last 6 months, similar in size (within 20%), beds, baths, and post-rehab condition. The more closely matched the comps, the less adjustment needed and the more reliable the ARV.
What is the best free tool to find comps by address?
Redfin is the best free option — it pulls from MLS and shows sold price, price per square foot, and days on market with address-level detail. Zillow is free but shows less data. For the most accurate results, use county assessor records or MLS access through an agent.
How do I adjust comps when calculating ARV by address?
Compare each comp’s features to your fully renovated subject property. If the comp has something your property won’t have, subtract value. If your property will have something the comp didn’t, add value. Standard adjustments: $40–$60/sqft for size differences, $10,000 per bedroom, $12,000–$15,000 per garage, $10,000–$15,000 for a pool.
How does ARV connect to the 70% rule?
The 70% rule sets your maximum purchase price at 70% of ARV minus estimated repair costs. If ARV = $280,000 and repairs = $60,000, your max offer is ($280,000 × 0.70) − $60,000 = $136,000. Getting ARV right is the foundation — a 10% overestimate of ARV means you might overpay by $19,600 on this example deal.
Related Calculators and Guides
Once you have your ARV from the ARV calculator, these tools help you turn that number into a full deal analysis:
ARV Calculator — Enter your comps, get your after repair value in seconds
The deal that started with Sarah standing in front of 123 Oak St ends with a number she can defend to a lender, a partner, or herself. That number comes from comps pulled by address, adjusted carefully, and averaged honestly. It doesn’t come from Zestimate. It doesn’t come from guessing. It comes from doing the comp work — and our ARV calculator makes that work faster and more accurate than a spreadsheet.
Leave a Reply