Last updated: September 24, 2026 · Originally published: September 2, 2026 · By Alex Petrov
Indiana cap rate data shows Fort Wayne leading at 6.0–7.5%, followed by South Bend at 6.5–8.5%, Indianapolis at 6.5–8.0%, and Evansville at 6.0–7.0%. These are among the highest cap rates in the Midwest — driven by low entry prices ($130K–$185K median), moderate property tax (0.85% effective, capped at 2%), and insurance well below the national average ($1,800/year). Here is what cap rates actually look like across five Indiana metros in 2026, with worked examples and the factors that compress or expand cap rates in each market.
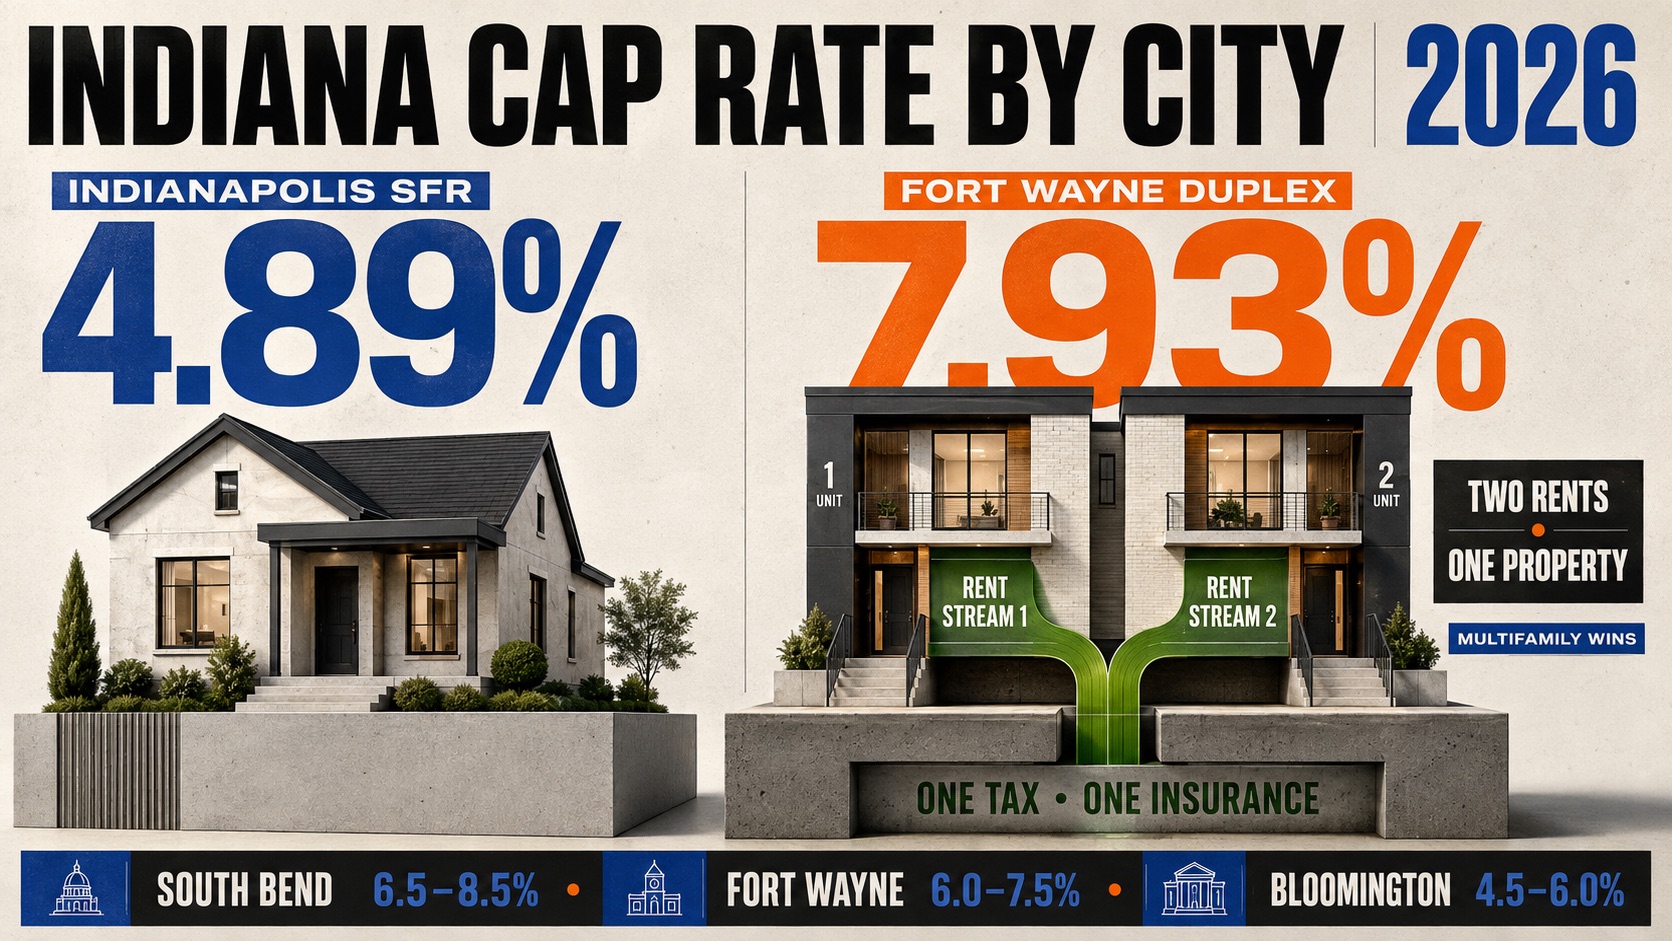
Indiana Cap Rate by City: 2026 Data
| Metro | Median Price | Median Rent (3BR) | Cap Rate Range | Property Tax | Insurance |
|---|---|---|---|---|---|
| Indianapolis | $185,000 | $1,450 | 6.5–8.0% | 1.02% | $1,900 |
| Fort Wayne | $145,000 | $1,100 | 6.0–7.5% | 0.88% | $1,700 |
| Evansville | $140,000 | $1,050 | 6.0–7.0% | 0.82% | $1,600 |
| South Bend | $130,000 | $1,000 | 6.5–8.5% | 0.90% | $1,500 |
| Bloomington | $220,000 | $1,400 | 4.5–6.0% | 0.78% | $1,800 |
Cap rates modeled with 5.5% vacancy, 9% management, 8% maintenance, property-specific tax and insurance. Data from Zillow Research (ZHVI/ZORI), Redfin median sale prices, and county assessor records. Calculate your specific deal in the Indiana cap rate calculator.
What Drives Cap Rates in Indiana
Property Tax: 0.85% Average, Capped at 2%
Indiana constitutionally caps property tax at 2% of assessed value for non-homestead residential. The effective average is 0.85% statewide — significantly lower than Ohio (1.36%), Texas (1.60%), or Illinois (2.23%). Lower tax means higher NOI means higher cap rate. On a $185K Indianapolis property, you pay ~$1,887/year in tax. The same property in Columbus OH would cost ~$2,516/year — $629 more per year directly subtracted from NOI.
County variation matters: Marion County (Indianapolis) 1.02%, Allen County (Fort Wayne) 0.88%, St. Joseph County (South Bend) 0.90%, Monroe County (Bloomington) 0.78%. Per Indiana Department of Revenue, investment properties do not qualify for the homestead deduction ($48K off assessed value).
Insurance: $1,800/Year Average
Indiana landlord insurance averages $1,800/year — 14% below the national average. This directly boosts NOI compared to high-insurance states. Florida investors pay $4,500/year, Texas $3,300. That $1,500–$2,700 difference is pure NOI that Indiana investors keep. Tornado and hail risk in central Indiana can push premiums above $2,500 for some properties. Flood zones along the Wabash, White, and Ohio rivers add $400–$1,200/year.
Vacancy: 4.5–6% in Major Metros
Per FRED data, Indiana rental vacancy averaged 5.5% statewide in 2025. Fort Wayne runs tightest at 4.5%, Indianapolis at 5.5%, South Bend and Evansville at 5.0–5.5%. Bloomington has seasonal variation (6.0% average) tied to Indiana University’s academic calendar. Low vacancy supports higher effective rents, which supports cap rates.
Worked Example: Indianapolis SFR ($185K)
Property: 3BR/2BA SFR, Fountain Square, Indianapolis
Purchase Price: $185,000
Monthly Rent: $1,450

Annual Income:
 Gross Rent: $17,400
 Vacancy (5.5%): −$957
 Effective Gross: $16,443

Annual Expenses:
 Property Tax (1.02%): −$1,887
 Insurance: −$1,900
 Management (9%): −$1,480
 Maintenance (8%): −$1,315
 CapEx (5%): −$822
 Total Expenses: −$7,404

NOI: $9,039
Cap Rate: $9,039 / $185,000 = 4.89%
4.89% cap rate — below the 6.5–8.0% range in our table. Why? The table shows ranges for deals below median price (value-add, off-market). At full market price ($185K) with conservative expenses, the realistic cap rate is 4.5–5.5%. To hit 7%+ cap rate, you need to buy at $130K or find rents above $1,600.
This is the honest reality of cap rates in 2026. The “7% cap rate in Indianapolis” numbers require either below-market acquisition, above-market rents, or aggressive expense assumptions.
Worked Example: Fort Wayne Duplex ($160K)
Property: Duplex, Oxford neighborhood, Fort Wayne
Purchase Price: $160,000
Monthly Rent: $900/unit × 2 = $1,800

Annual Income:
 Gross Rent: $21,600
 Vacancy (4.5%): −$972
 Effective Gross: $20,628

Annual Expenses:
 Property Tax (0.88%): −$1,408
 Insurance: −$2,000
 Management (9%): −$1,856
 Maintenance (8%): −$1,650
 CapEx (5%): −$1,031
 Total Expenses: −$7,945

NOI: $12,683
Cap Rate: $12,683 / $160,000 = 7.93%
7.93% cap rate — Fort Wayne duplexes hit the numbers that Indianapolis SFRs cannot. Two rent streams on one tax bill, one insurance policy, one management contract. The per-unit expenses are lower, and the aggregate rent pushes NOI high enough for strong cap rates. This is why experienced Indiana investors target Fort Wayne multifamily over Indianapolis SFR for pure cash flow plays.
Run both scenarios in the Indiana cap rate calculator. For cash flow analysis with financing, use the Indiana rental property calculator.
The Fort Wayne duplex demonstrates why Indiana cap rate analysis favors multifamily. When you stack two rent streams against one tax bill and one insurance policy, the per-unit cost drops dramatically. A Fort Wayne duplex at $160K generates $12,683 NOI — nearly $3,700 more than an Indianapolis SFR at $185K ($9,039 NOI) despite costing $25K less.
This math scales further with triplexes and fourplexes. A Fort Wayne fourplex at $240K with four units at $850/month generates approximately $27,000 NOI — an 11%+ cap rate that makes the deal attractive even at current financing costs. The cap rate advantage of multifamily is not unique to Indiana, but Indiana’s low entry prices make multifamily accessible to investors who cannot afford $400K+ duplexes in coastal markets.
For investors evaluating Indiana cap rates, the key insight is: do not judge the state by SFR metrics alone. The real Indiana cap rate opportunity is in 2-4 unit properties in Fort Wayne, South Bend, and suburban Indianapolis. These properties consistently deliver 6.5-8.5% cap rates at market prices — without requiring below-market acquisition or aggressive expense assumptions.
Indiana Cap Rate vs Other States
| State | Typical Cap Rate (SFR) | Median Price | Why |
|---|---|---|---|
| Indiana | 4.5–6.5% | $185K | Low tax, low insurance, moderate prices |
| Ohio | 4.0–6.0% | $190K | Higher tax (1.36%) compresses cap rates |
| Georgia | 4.0–5.5% | $280K | Higher prices, moderate expenses |
| Texas | 3.0–4.5% | $290K | High tax (1.6%) + high insurance ($3,300) |
| Florida | 2.5–4.0% | $380K | High prices + extreme insurance ($4,500) |
| North Carolina | 3.5–5.0% | $280K | Rising insurance ($3,000), higher prices |
Indiana produces the highest SFR cap rates among the six states we cover — because entry prices are low and operating expenses are moderate. The only way to beat Indiana cap rates is to find off-market deals in Ohio or invest in small multifamily (where per-unit economics are better in every state). Compare any state in the cap rate calculator. See our cap rate by state guide for the full national comparison.
How to Improve Cap Rate on Indiana Properties
1. Buy Below Market
A $185K property at a 10% discount ($166K) improves cap rate from 4.89% to 5.45%. Foreclosures, estate sales, and tired landlord acquisitions in Indianapolis and Fort Wayne consistently trade 10–20% below market. Use the ARV calculator to verify value.
2. Target Multifamily
Duplexes and triplexes produce 1.5–2.5% higher cap rates than SFR at similar price points. The Fort Wayne duplex example (7.93%) vs Indianapolis SFR (4.89%) shows this clearly. Per-unit expenses drop while aggregate rent climbs.
3. Reduce Insurance
Shop 3–5 quotes from landlord-specific insurers (Steadily, Obie, NREIG). Raising deductible from $1,000 to $2,500 typically saves 10–15%. On a $1,900 policy, that is $190–$285/year added to NOI. See our insurance cost guide.
4. Protest Property Tax
Indiana allows annual assessment protests. A successful protest reducing assessed value by $15,000 saves ~$128/year in tax at the 0.85% effective rate. Over 10 years: $1,280 in cumulative savings.
5. Self-Manage (Carefully)
Eliminating the 9% management fee adds 0.7–1.0% to cap rate. But self-management only makes sense if you are local and have fewer than 5 units. Beyond that, your time is worth more than the management fee. Factor in the property management cost guide.
5 Cap Rate Mistakes in Indiana
1. Using Statewide Average Tax Instead of County Rate
0.85% statewide vs 1.02% Marion County = 0.17% difference. On $200K: $340/year in NOI. That swings cap rate by 0.2 percentage points. Always use county-specific rates.
2. Ignoring the Homestead Deduction Gap
Owner-occupants get a $48,000 deduction from assessed value. Investors do not. A $200K property: owner pays tax on $152K, investor pays on $200K. The investor’s tax bill is 32% higher. Do not use owner-occupied tax comps for investment analysis.
3. Comparing Bloomington Cap Rates to Fort Wayne
Bloomington (4.5–6.0%) and Fort Wayne (6.0–7.5%) serve different strategies. Bloomington is a university appreciation play. Fort Wayne is a cash flow play. Comparing their cap rates without context leads to wrong conclusions.
4. Excluding CapEx Reserves
A $185K property with a 20-year-old roof needs $12,000–$15,000 for replacement within 5–7 years. At 5% of gross rent, you reserve $870/year. Excluding this makes cap rate look 0.4–0.5% better — until the roof fails and you pay out of pocket.
5. Using Asking Rent Instead of Achieved Rent
Zillow asking rents in Indianapolis average 5–8% higher than actual lease rates. A $1,450 asking rent becomes $1,335–$1,380 in practice. Use recently signed leases or ask a local PM for actual achieved rents.
Frequently Asked Questions
What is a good cap rate in Indiana for 2026?
At full market price with conservative expenses, expect 4.5–5.5% cap rate for SFR and 6.5–8% for small multifamily. The “7% cap rate” numbers quoted for Indiana typically require below-market acquisition or aggressive expense assumptions. For pure cash flow, target Fort Wayne and South Bend multifamily. For balanced cash flow + appreciation, target Indianapolis. Use the Indiana cap rate calculator with your specific numbers.
Why are Indiana cap rates higher than Texas or Florida?
Which Indiana city has the highest cap rate?
How does Indiana property tax affect cap rate?
Should I use cap rate or cash-on-cash return for Indiana deals?
Related Calculators and Guides
- Indiana Cap Rate Calculator — Calculate with IN defaults
- Indiana Rental Property Calculator — Full cash flow analysis
- Indiana DSCR Calculator — Loan qualification
- Indiana Closing Costs — Buyer cost estimate
- Indiana BRRRR Calculator — BRRRR cycle analysis
- All Indiana Calculators
- All 30+ Calculators
Other state cap rate guides:
Leave a Reply