
Published: August 12, 2026 · By Alex Petrov
Ohio cap rates run 5–7% across most metros — well above the 4–5% national average for residential investment property. Cleveland leads with 6–8% cap rates on stabilized rentals, while Columbus sits at 4.5–5.5% where appreciation drives returns more than cash flow. Use the Ohio cap rate calculator to analyze any deal with Ohio-specific property tax, insurance, and vacancy defaults pre-loaded.
Ohio Cap Rates by City: 2026 Data
| Metro | Median Price | Median Rent | Typical Cap Rate | Vacancy | Property Tax |
|---|---|---|---|---|---|
| Cleveland–Elyria | $145,000 | $1,350/mo | 6.0–8.0% | 9.0% | 1.89% |
| Dayton–Kettering | $230,000 | $1,200/mo | 5.0–7.0% | 7.0% | 1.85% |
| Cincinnati | $285,000 | $1,400/mo | 5.0–6.0% | 5.5% | 1.77% |
| Columbus | $310,000 | $1,550/mo | 4.5–5.5% | 4.5% | 1.62% |
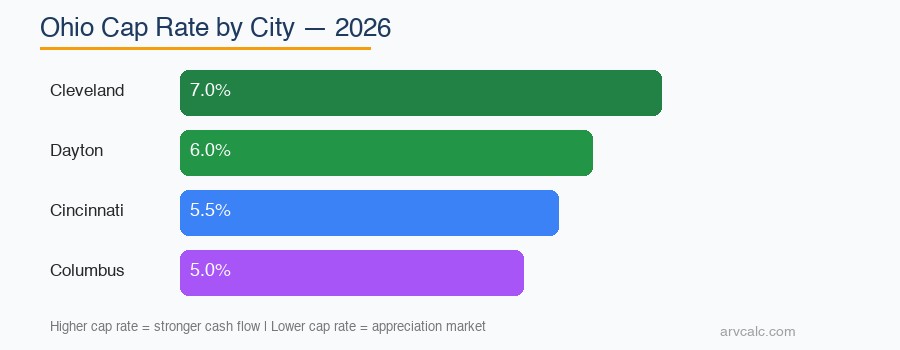
Cap rates are inversely correlated with growth expectations. Columbus has the lowest cap rates because investors are pricing in Intel-driven appreciation and sub-5% vacancy. Cleveland has the highest because the market prices in population decline risk and higher vacancy. Both can be good investments — they just serve different strategies.
What Drives Cap Rates in Ohio
Property tax variation. Ohio’s statewide effective rate is 1.36% per Tax Foundation. Vacancy data from FRED Ohio Economic Data. Housing stats from U.S. Census Bureau. Insurance benchmarks from Ohio Department of Insurance, but Cuyahoga County (Cleveland) runs 1.89% — 39% higher. Higher taxes reduce NOI and compress cap rates. A Cleveland property at 1.89% tax shows a lower cap rate than the same property would at Columbus’s 1.62% rate. Always use county-specific rates in the Ohio cap rate calculator.
Insurance costs. Ohio insurance averages $2,100/year — roughly half what Texas ($3,300) or Florida ($4,500) charge. This lower expense boosts NOI and pushes cap rates higher than equivalent properties in high-insurance states. For detailed insurance analysis, check the Ohio rental property calculator.
Vacancy spreads. Columbus at 4.5% vacancy vs Cleveland at 9.0% creates a meaningful NOI gap. On a $16,200 gross rent, the difference between 4.5% and 9.0% vacancy is $729/year — real money on a $120K property where it represents nearly a full percentage point of cap rate.
Cleveland: Highest Cap Rates in Ohio
Cleveland consistently produces the highest cap rates in Ohio. A $120,000 SFR renting for $1,350/month generates roughly $8,050 NOI after expenses — a 6.7% cap rate. Duplexes and triplexes in neighborhoods like Lakewood, Parma, and Old Brooklyn can push above 7%.
The risks: 9% vacancy, city transfer tax of 1.18%, municipal income tax of 2.5%, and neighborhoods that vary block by block. Cleveland is a market where property management quality makes or breaks returns. Calculate your specific deal in the cap rate calculator before committing.
Cleveland’s healthcare sector (Cleveland Clinic, University Hospitals) provides a stable employment base that supports rental demand in adjacent neighborhoods. Investors targeting the healthcare worker tenant demographic report lower vacancy and fewer evictions.
Columbus: Lowest Cap Rates, Strongest Growth
Columbus cap rates sit at 4.5–5.5% — compressed by strong demand from Intel’s $20 billion chip plant, Ohio State University, and corporate relocations. A $310,000 property renting for $1,550/month produces roughly $13,900 NOI — a 4.5% cap rate.
At current 7% mortgage rates, Columbus properties are cash-flow negative with conventional financing. This is an appreciation play: tight 4.5% vacancy, 5.8% YoY price growth, and a generational economic catalyst (Intel) justify the compressed cap rate for investors with a 5–10 year hold horizon.
Best Columbus strategy: target value-add duplexes near campus (Clintonville, Italian Village) where rent growth outpaces price growth. Run scenarios in the Ohio cap rate calculator — use Mode 2 to find what purchase price produces your target cap rate.
Cincinnati and Dayton: The Middle Ground
Cincinnati offers balanced returns at 5–6% cap rates. The diversified economy (P&G, Kroger, healthcare) provides stability. Northern Kentucky suburbs (Florence, Covington) are technically part of the metro and offer different tax treatment — Kentucky has no municipal income tax. Check cross-state deals through the cap rate calculator.
Dayton runs 5–7% cap rates with the lowest entry point in Ohio ($230K median). Wright-Patterson AFB provides a stable tenant pool of military and defense contractor personnel. Properties sell in 15 days — fastest in Ohio — signaling strong demand. Use the Ohio DSCR calculator to verify loan qualification on Dayton properties.
Ohio Cap Rate vs Other States
| State | Typical SFR Cap Rate | Median Price | Insurance | Income Tax |
|---|---|---|---|---|
| Ohio | 5.0–7.0% | $235,000 | $2,100 | 2.75% |
| Texas | 4.5–6.5% | $335,000 | $3,300 | 0% |
| Florida | 4.0–6.0% | $400,000 | $4,500 | 0% |
| Indiana | 5.5–7.5% | $225,000 | $1,600 | 3.05% |
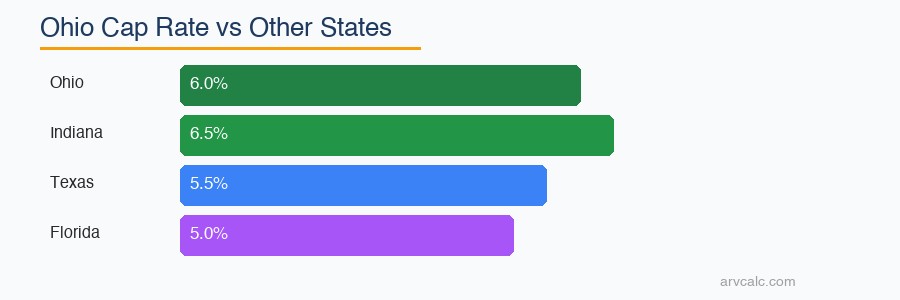
Ohio’s cap rates compete favorably with any Midwest or Sun Belt market. The combination of low insurance, moderate property tax, and affordable prices creates higher NOI per dollar invested. The tradeoff is the 2.75% state income tax plus municipal taxes — but that hit comes after the cap rate calculation (cap rate is pre-tax). For more state comparisons, see the cap rate by state guide.
How to Analyze an Ohio Cap Rate Deal
Step-by-step process using the Ohio cap rate calculator:
- Enter purchase price. Use the contract price or your offer amount.
- Enter gross rent. Monthly rent × number of units. Verify against Zillow, Rentometer, or a local PM.
- Set vacancy. The calculator defaults to 6.5% (Ohio statewide). Override with metro-specific: Columbus 4.5%, Cleveland 9%, Cincinnati 5.5%, Dayton 7%.
- Enter operating expenses. Property tax (use county rate, not statewide), insurance, maintenance (8% of gross), PM (10% of collected rent).
- Read your cap rate. Below 5% = appreciation play. 5–6% = balanced. Above 6% = cash flow market.
For a deeper analysis including financing, use the Ohio rental property calculator which shows NOI, cash flow, CoC, and DSCR together. Calculate NOI separately in the NOI calculator if you want to isolate operating performance from financing decisions.
5 Cap Rate Mistakes in Ohio
1. Using Statewide Tax Rate for Cuyahoga County
Why: Statewide 1.36% vs Cuyahoga 1.89% = $769/year difference on a $145K property. That changes a 7.0% cap rate to 6.5%.
Fix: Look up the county effective rate on the county auditor website before calculating.
2. Ignoring Cleveland’s City Transfer Tax in Acquisition Cost
Why: Cleveland’s 1.18% transfer tax on a $145K purchase = $1,711 extra. Most other Ohio cities have no city transfer tax.
Fix: Factor it into your total acquisition cost. Use the Ohio closing costs calculator.
3. Comparing Columbus Cap Rates to Cleveland
Why: A 5% cap rate in Columbus and a 7% cap rate in Cleveland are not the same risk. Columbus has 4.5% vacancy and Intel growth. Cleveland has 9% vacancy and flat population.
Fix: Compare cap rates within the same metro, not across metros. Use cap rate to compare properties in the same city.
4. Not Accounting for Municipal Income Tax
Why: Cap rate is a pre-income-tax metric, but your actual after-tax return includes 2.75% state + 1.5–2.5% municipal. A 6% cap rate property in Columbus (2.5% city tax) delivers less after-tax cash than the same cap rate in a suburb with 1.5% city tax.
Fix: Calculate after-tax cash flow separately. The cap rate alone does not tell the full story.
5. Using Asking Rent Instead of Market Rent
Why: Sellers and wholesalers inflate rent projections. A Cleveland property listed at $1,500/month rent may actually achieve $1,250 after sitting vacant for 3 weeks.
Fix: Verify rent independently with 3 sources (Zillow, Rentometer, local PM). Use the lower estimate in the Ohio cap rate calculator.
Frequently Asked Questions
What is a good cap rate for Ohio rental property?
In Ohio, cap rates above 6% are considered strong for cash flow. Cleveland regularly produces 6–8% on stabilized SFR. Columbus runs 4.5–5.5% — lower, but justified by growth fundamentals. A “good” cap rate depends on your strategy: cash flow investors target 6%+, appreciation investors accept 4.5–5% with growth upside.
Why are Cleveland cap rates higher than Columbus?
Does Ohio property tax affect cap rate calculations?
How do Ohio cap rates compare to Florida and Texas?
What expenses go into an Ohio cap rate calculation?
Is a 7% cap rate in Cleveland too good to be true?
Should I use cap rate or cash-on-cash return for Ohio deals?
Related Ohio Tools and Guides
- Ohio Cap Rate Calculator — Forward and reverse cap rate with Ohio defaults
- Ohio Rental Property Calculator — Full deal analysis
- Ohio Closing Costs Calculator — Buyer costs breakdown
- Ohio DSCR Calculator — Loan qualification
- Ohio BRRRR Calculator — Buy, rehab, rent, refinance, repeat
- Ohio Calculator Hub — All Ohio tools
- Ohio Rental Property Investment Guide
- What Is a Good Cap Rate for Rental Property?
- Cap Rate by State: Best Markets 2026
- Net Operating Income (NOI) Guide
- All 30+ Calculators
Leave a Reply