
Last updated: September 15, 2026 · Originally published: August 12, 2026 · By Alex Petrov
Ohio rental property investment offers some of the strongest cash-flow numbers in the US right now. Median home prices sit 30–40% below the national average, cap rates run 5–7% in most metros, and the state just posted its highest population growth in 25 years. The Ohio rental property calculator lets you plug in any deal and see NOI, cash flow, and cash-on-cash return with Ohio-specific tax and insurance defaults in under 60 seconds.
Why Ohio for Rental Property in 2026
Three forces are converging to make Ohio one of the best states for rental property investors in 2026.
Affordability. The statewide median sale price is $235,000 — roughly 40% below the national median of $390,000. In Cleveland, you can buy a rent-ready single-family home for $120,000–$145,000. That kind of entry point is nearly impossible to find in Texas, Florida, or any coastal market.
The Intel effect. Intel is building a $20 billion chip fabrication campus in Licking County, just east of Columbus. Construction is underway with production expected by 2027. The project is projected to create 3,000 direct jobs and 7,000+ construction jobs. Housing demand in the Columbus metro is already responding — vacancy dropped to 4.5% and prices rose 5.8% YoY. For investors, this is a generational catalyst in a market that was already growing.
Population growth. Ohio’s population grew 0.34% in 2025 — the highest rate in 25 years, according to the U.S. Census Bureau. Net in-migration is now positive after decades of stagnation. More people means more renters, tighter vacancy, and upward pressure on rents.
Run any Ohio deal through the Ohio rental property calculator to see how these macro trends translate into actual cash flow for a specific property.
Ohio Tax Rules for Real Estate Investors
Ohio’s tax structure has pros and cons for investors. Understanding them before you buy prevents surprises at tax time.
| Tax | Rate | Notes |
|---|---|---|
| Property Tax | 1.36% effective | Varies by county: Cuyahoga ~1.89%, Franklin ~1.62%, Hamilton ~1.77%. Reassessment every 3 years. Tax Foundation |
| State Income Tax | 2.75% flat | Effective January 1, 2026. Income ≤$26,050 exempt. Applies to rental income and capital gains. Ohio Dept of Taxation |
| Municipal Income Tax | 1.5–2.5% | Most Ohio cities levy their own income tax. Cleveland 2.5%, Columbus 2.5%, Cincinnati 1.8%, Dayton 2.25%. Applies to net rental income. |
| Conveyance Fee | 0.1–0.4% | State fee $1 per $1,000 (0.1%). Counties add permissive tax up to $3 per $1,000. Cuyahoga County total: 0.4%. |
| Cleveland City Transfer Tax | 1.18–1.45% | Cleveland imposes a separate city-level transfer tax on top of county/state fees. Major cost for Cleveland investors. |
| Insurance | ~$2,100/yr avg | Near national average. Lower risk vs coastal states. No hurricane or earthquake exposure. |
The municipal income tax is the one most out-of-state investors miss. In Columbus, you pay 2.75% state + 2.5% city = 5.25% combined income tax on net rental income. That is higher than Texas (0%) or Florida (0%) but lower than California (13.3%) or New York (10.9%). Factor it into your underwriting using the Ohio rental property calculator.
Columbus: Fastest-Growing Ohio Metro
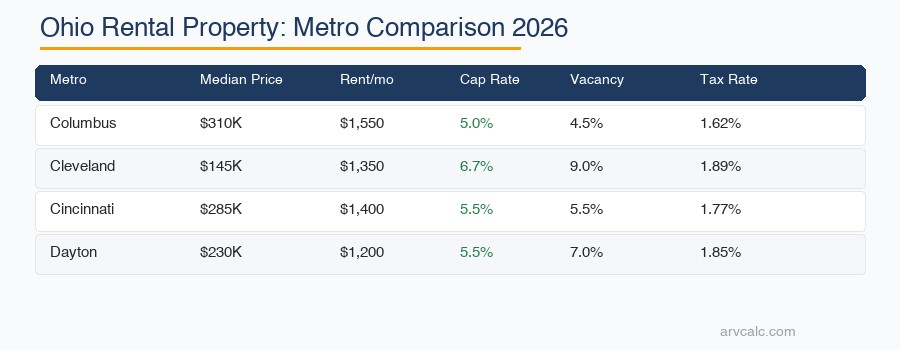
Median price: $310,000 · Median rent: $1,550/mo · Vacancy: 4.5% · Property tax: 1.62%
Columbus is Ohio’s growth engine. The Intel campus, Ohio State University (60,000+ students), and a diversified economy anchored by healthcare, insurance, and government make it the tightest rental market in the state. Vacancy at 4.5% is well below the 6.5% statewide average.
The catch: Columbus pricing has risen to a point where cash flow is thin at current interest rates. A $310K property with 25% down at 7% produces negative monthly cash flow after expenses. Columbus is an appreciation play with tight vacancy — not a cash flow market at today’s rates. Run it through the Ohio cap rate calculator and you will see cap rates in the 4.5–5.5% range.
Best strategy in Columbus: target duplexes or small multifamily in near-campus neighborhoods (Clintonville, Old North, Weinland Park) where rent-to-price ratios are more favorable.
Cleveland: The Cash Flow Capital
Median price: $145,000 · Median rent: $1,350/mo · Vacancy: 9.0% · Property tax: 1.89%
Cleveland is where Ohio investors go for cash flow. A $120,000 single-family home renting for $1,350/month produces a gross rent multiplier of 7.4 — one of the lowest (best) in the country. Cap rates run 6–8% on stabilized properties.
The risks are real: population has been declining for decades (though now stabilizing), vacancy runs 8–10%, and the city imposes a 1.18% transfer tax on sales plus a 2.5% municipal income tax on net rental income. Cuyahoga County property taxes are the highest in Ohio at 1.89%.
Cleveland works best for experienced landlords or investors using professional property management who can handle higher vacancy and tenant turnover. The healthcare sector (Cleveland Clinic, University Hospitals) provides a stable employment base. Use the Ohio DSCR calculator to check whether a Cleveland deal qualifies for DSCR financing.
Cincinnati: Diversified and Stable
Median price: $285,000 · Median rent: $1,400/mo · Vacancy: 5.5% · Property tax: 1.77%
Cincinnati sits at the intersection of Ohio, Kentucky, and Indiana — and the metro includes Northern Kentucky suburbs that offer lower taxes and different landlord-tenant laws. The economy is diversified across consumer goods (Procter & Gamble, Kroger), healthcare, and financial services.
The rent-to-price ratio is moderate — not as favorable as Cleveland, not as stretched as Columbus. Cincinnati investors typically target suburban areas (Mason, West Chester, Liberty Township) where school districts drive demand and vacancy stays low. Cap rates run 5–6% on well-located properties.
Use the Ohio closing costs calculator to estimate buyer costs in Hamilton County. The conveyance fee in Hamilton County is 0.3% (state + county combined).
Dayton: Most Affordable Entry Point
Median price: $230,000 · Median rent: $1,200/mo · Vacancy: 7.0% · Property tax: 1.85%
Dayton offers the lowest entry point among Ohio’s major metros. Wright-Patterson Air Force Base — one of the largest military installations in the US — provides stable employment and a consistent tenant pool. The Dayton area is also a logistics hub with Amazon and other distribution centers driving job growth.
Properties sell fast (15 days on market — fastest in Ohio) and appreciation has been strong at 6.1% YoY from a low base. For BRRRR investors, Dayton’s low purchase prices and quick rehab turnaround make it an attractive market. Run a BRRRR scenario through the Ohio BRRRR calculator.
Ohio vs Texas vs Florida
| Factor | Ohio | Texas | Florida |
|---|---|---|---|
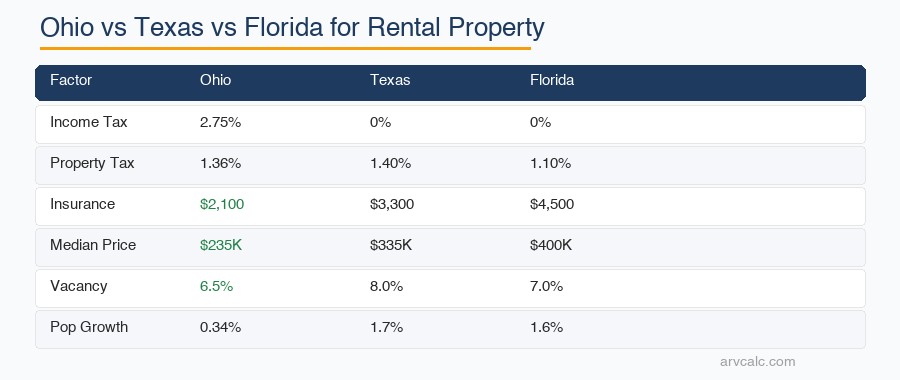
| State Income Tax | 2.75% flat | 0% | 0% |
| Property Tax | 1.36% | 1.40% | 1.10% |
| Insurance Avg | $2,100/yr | $3,300/yr | $4,500/yr |
| Median Price | $235,000 | $335,000 | $400,000 |
| Vacancy Rate | 6.5% | 8.0% | 7.0% |
| Population Growth | 0.34% | 1.7% | 1.6% |
| Transfer Tax | 0.1–0.4% | None | 0.7% (doc stamps) |
| Natural Disasters | Low (tornadoes) | High (hurricanes, hail) | Very High (hurricanes) |
| Best For | Cash flow, affordability | Growth + cash flow | Appreciation, STR |
Ohio wins on entry price and insurance costs. You can buy two Cleveland rentals for the price of one Houston property — and insure them for less. Ohio loses on income tax (2.75% + municipal) and population growth (0.34% vs 1.7% in Texas). For more state comparisons, see the cap rate by state guide.
Worked Example: Cleveland SFR — $120,000
This is a typical Cleveland cash-flow deal. Numbers are realistic for the west side neighborhoods (Lakewood, Parma, Brooklyn).
Property: 3-bed/1-bath SFR in Parma
Purchase price: $120,000
Down payment: 25% ($30,000)
Loan: $90,000 at 7.0%, 30-year fixed
Rent: $1,350/month
Step 1: Monthly Mortgage Payment
Monthly P&I = $599
Annual debt service = $599 × 12 = $7,188
Verify this in the investment property mortgage calculator.
Step 2: Effective Gross Income
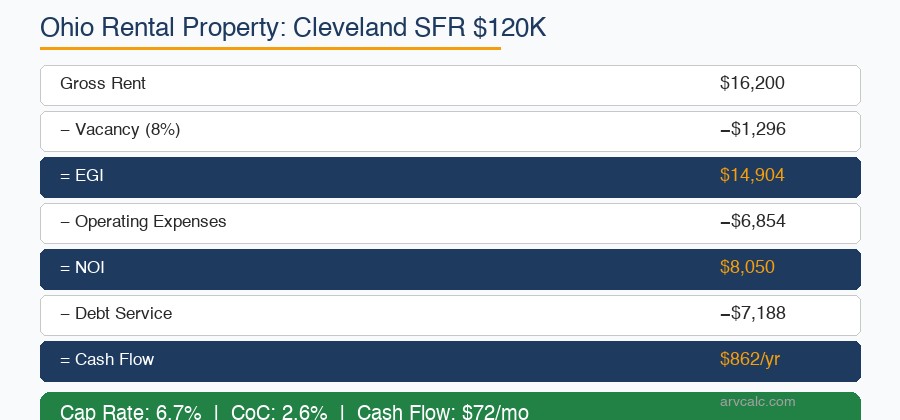
Gross annual rent: $1,350 × 12 = $16,200
Less vacancy (8%): − $1,296
Effective Gross Income (EGI): $14,904
Step 3: Operating Expenses
| Expense | Annual | Basis |
|---|---|---|
| Property Tax | $2,268 | 1.89% effective (Cuyahoga County) |
| Insurance | $1,800 | Landlord policy, SFR |
| Maintenance | $1,296 | 8% of gross rent |
| Property Management | $1,490 | 10% of collected rent |
| Total Operating Expenses | $6,854 |
Step 4: NOI and Cash Flow
NOI = $14,904 − $6,854 = $8,050
Cap Rate = $8,050 ÷ $120,000 = 6.7%

Annual Cash Flow = $8,050 − $7,188 = $862
Monthly Cash Flow = $72
Step 5: Cash-on-Cash Return
Total Cash Invested = $30,000 (down) + $3,600 (closing 3%) = $33,600
Cash-on-Cash Return = $862 ÷ $33,600 = 2.6%
Result: 2.6% cash-on-cash return. The property is cash-flow positive — $72/month after all expenses including professional management. The 6.7% cap rate is solid. But the CoC is thin at current 7% rates. If rates drop to 6% on a refinance, monthly P&I falls to $540 and CoC jumps to 4.7%.
This is a typical Cleveland deal in 2026: positive cash flow, decent cap rate, but modest CoC returns due to high interest rates. The value proposition is buying at $120K — when rates eventually drop, you refinance and the returns improve significantly. Run your own numbers in the Ohio rental property calculator and stress-test with the cash-on-cash calculator.
For a full rental analysis framework, see the guide to analyzing rental property investments.
5 Things Ohio Investors Get Wrong
1. Ignoring Municipal Income Tax
Why it matters: Ohio cities levy their own income tax on top of state tax. In Columbus or Cleveland, that is 2.5% of net rental income. On a property generating $10,000 NOI, that is $250/year you did not budget for — plus the $275 in state income tax.
Fix: Add municipal income tax as a line item in your underwriting. The NOI calculator does not include income taxes (they are below the NOI line), so track them separately in your cash flow projection.
2. Using Statewide Tax Rates for Cuyahoga County
Why it matters: The statewide effective property tax rate is 1.36%. In Cuyahoga County (Cleveland), it is 1.89% — 39% higher. On a $145K property, that is $2,741 vs $1,972. The $769 difference wipes out more than a month of cash flow.
Fix: Always use the county-specific effective rate. Look it up on the county auditor website before making an offer. The Ohio rental property calculator defaults to statewide, so update the tax field with your county rate.
3. Forgetting Cleveland’s City Transfer Tax
Why it matters: Cleveland charges 1.18% on sales up to $400K and 1.45% above $400K — on top of the 0.4% county conveyance fee. On a $145K purchase, that is $1,711 + $580 = $2,291 in transfer costs. Most investors from out of state do not know this exists.
Fix: Budget for it. Use the Ohio closing costs calculator and add the city transfer tax manually if purchasing in Cleveland proper. Properties in surrounding suburbs (Parma, Lakewood, Euclid) may have lower or no city transfer tax.
4. Overestimating Cleveland Rents
Why it matters: Listing agents and wholesalers often quote “market rent” at the high end. A 3-bed in Cleveland proper might list at $1,500, but actually rents for $1,200–$1,350 after sitting vacant for a month. Overestimating rent by $150/month turns a cash-flow-positive deal into a negative one.
Fix: Verify rents on Zillow Rental Manager, Rentometer, and with a local property manager before making an offer. Use the conservative end of the range in your cash flow calculator.
5. Buying Based on Cap Rate Alone
Why it matters: A Cleveland property with a 7% cap rate looks better than a Columbus property at 5%. But cap rate ignores financing, tenant quality, vacancy risk, and appreciation. The Columbus property may have 4.5% vacancy and 5% annual appreciation. The Cleveland property may have 9% vacancy, zero appreciation, and higher turnover costs.
Fix: Use cap rate as a screening tool, not the final decision metric. Run the full analysis — NOI, cash flow, CoC, DSCR — in the Ohio rental property calculator. For context on good cap rates, read the guide to cap rates for rental property.
Frequently Asked Questions About Ohio Rental Property
Is Ohio a good state for rental property investment in 2026?
Ohio is one of the best states for cash-flow-focused rental property investment in 2026. Median prices ($235K statewide) are 40% below national average, insurance costs ($2,100/yr) are half what Florida charges, and vacancy is moderate at 6.5%. The Intel chip plant near Columbus is the biggest economic catalyst the state has seen in decades. The main downside is the 2.75% state income tax plus municipal income taxes (1.5–2.5%) that Texas and Florida do not have. Use the Ohio rental property calculator to see how these factors affect any specific deal.
What is the best city in Ohio for rental property?
Does Ohio have state income tax on rental income?
What are typical property tax rates in Ohio?
Can I use a DSCR loan for Ohio rental property?
What is the average cap rate in Ohio?
Is Cleveland or Columbus better for rental property investment?
Ohio Investment Calculators
All five Ohio calculators use state-specific defaults for property tax (1.36%), insurance ($2,100/yr), and vacancy (6.5%). Select a metro for city-level data.
- Ohio Rental Property Calculator — Full deal analysis with NOI, cash flow, CoC, and DSCR
- Ohio Cap Rate Calculator — Forward and reverse cap rate with Ohio benchmarks
- Ohio Closing Costs Calculator — Buyer costs with conveyance fee and Ohio-specific line items
- Ohio DSCR Calculator — Check DSCR loan qualification with Ohio expenses
- Ohio BRRRR Calculator — Buy, rehab, rent, refinance, repeat analysis
- Ohio Calculator Hub — All Ohio-specific tools in one place
- All 30+ Calculators — Full suite for any US state
Related Guides
- What Is a Good Cap Rate for Rental Property?
- How to Analyze a Rental Property Investment
- Net Operating Income (NOI) Guide
- DSCR Loans: Complete Guide for 2026
- Investment Property Down Payment Guide
- How to Calculate Rental Property Cash Flow
- How to Buy Your First Rental Property
- Cap Rate by State: Best Markets 2026
Leave a Reply