
Last updated: September 24, 2026 · Originally published: August 11, 2026 · By Alex Petrov
A fix and flip calculator runs every number a house flipper needs in under 60 seconds: purchase price, rehab budget, holding costs, selling fees, net profit, and ROI. Skip the spreadsheet — run the calc, know your numbers, make the offer or walk away.
Below you get a full walkthrough: how to use all three calculation modes, two complete worked examples with verified math, the 70% rule explained, a Fix & Flip vs. BRRRR comparison, a breakdown of hidden holding costs, and the five mistakes that kill flip profits.
What Does a Fix and Flip Calculator Do?
A fix and flip calculator translates raw deal data into a profit-and-loss picture before you commit a dollar. Every flip has the same cost structure — you need a tool that handles all of it at once.
Inputs the Calculator Takes
| Input | What to Enter | Where It Comes From |
|---|---|---|
| After Repair Value (ARV) | Projected sale price after renovation | Comparable sales, ARV calculator |
| Purchase Price | What you pay for the property | Negotiated offer |
| Rehab Budget | Total renovation cost | Rehab cost estimator, contractor quotes |
| Financing Type | Cash, hard money, conventional | Lender terms |
| Interest Rate | Annual rate on the loan | Hard money loan calculator |
| Hold Period | Months from purchase to sale close | Rehab timeline + average days on market |
| Selling Costs | Agent commissions, closing costs, staging | Local agent rates, closing costs calculator |
| Buying Costs | Inspection, title, closing fees on purchase | Title company, lender estimate |
Outputs the Calculator Delivers
| Output | Formula |
|---|---|
| Net Profit | ARV − Purchase − Rehab − Holding Costs − Selling Costs |
| Total Cash Invested | Purchase + Rehab + Buying Costs |
| ROI | Net Profit ÷ Total Cash Invested × 100 |
| Annualized ROI | (Net Profit ÷ Total Cash Invested) × (12 ÷ Hold Months) × 100 |
| 70% Rule Check | ARV × 0.70 − Rehab vs. Your Offer |
| Holding Costs Breakdown | Interest + Taxes + Insurance + Utilities per month |
The house flipping profit calculator at ArvCalc goes one step further — it separates hard money interest from property taxes and utilities so you see exactly where the money bleeds out during the hold.
How to Use Our Fix and Flip Calculator — Three Modes
Open the fix and flip calculator. You’ll see three tabs at the top. Each solves a different question.
Mode 1: Standard — Calculate Profit and ROI
Use this when you have a specific property in mind and want to know if the numbers work.
- Enter the ARV. Pull at least three closed comps within 0.5 miles, sold in the past 90 days, similar size and condition. Use the ARV calculator if you need help weighting comps.
- Enter the purchase price. This is your offer, not the list price.
- Enter rehab budget. Line-item quotes beat gut estimates. Use the rehab cost estimator to build your scope of work.
- Enter financing terms. Hard money? Enter the rate and origination points. Cash deal? Set rate to 0 and enter your opportunity cost if you want an honest comparison.
- Enter hold period in months. Be realistic — most flips run 30–60 days longer than planned.
- Enter selling costs. Typical range: 7–9% of ARV. Include agent commissions (5–6%), staging ($1,500–$4,000), and seller-paid closing costs (1–2%).
- Hit Calculate. The tool returns net profit, ROI, and a 70% rule check in real time.
Mode 2: Reverse — Find Maximum Purchase Price
Use this before making an offer. You know what you want to net. The calculator works backward to tell you the most you can pay.
- Enter ARV, rehab budget, hold period, financing terms, selling costs.
- Enter your minimum acceptable profit (e.g., $25,000).
- The calculator outputs the maximum allowable purchase price.
This mode stops you from negotiating against yourself. You walk into negotiations knowing your ceiling — not guessing it.
Mode 3: Reverse — Find Maximum Rehab Budget
Use this when you have a purchase price locked up but rehab bids are coming in high.
- Enter ARV, purchase price, hold period, financing terms, selling costs.
- Enter your minimum profit target.
- The calculator tells you the maximum you can spend on rehab and still hit your number.
This is the fastest way to have an honest conversation with a contractor: “Here is the budget. What can we do within it?”
Worked Example 1: Phoenix Ranch Flip
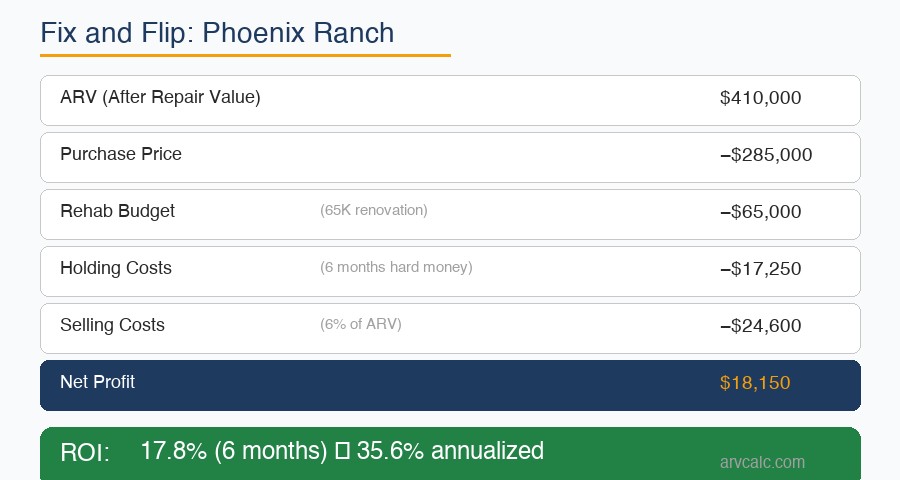
A 3-bed/2-bath ranch in a Phoenix suburb. The property needs a full kitchen update, two bathroom refreshes, new flooring, fresh paint, and landscaping. Here are the deal inputs:
| Input | Amount |
|---|---|
| After Repair Value (ARV) | $410,000 |
| Purchase Price | $285,000 |
| Rehab Budget | $65,000 |
| Hold Period | 6 months |
| Hard Money Rate | 10% annual on purchase price |
| Monthly Property Taxes | $250/month |
| Monthly Insurance | $100/month |
| Monthly Utilities | $150/month |
| Agent Commission (selling) | 6% of ARV |
Step-by-Step Math
Hard money interest:
$285,000 × 10% ÷ 12 months × 6 months = $14,250
Property taxes:
$250 × 6 = $1,500
Insurance:
$100 × 6 = $600
Utilities:
$150 × 6 = $900
Total holding costs:
$14,250 + $1,500 + $600 + $900 = $17,250
Selling costs (6% of $410,000):
$410,000 × 0.06 = $24,600
Net Profit:
$410,000 − $285,000 − $65,000 − $17,250 − $24,600 = $18,150
Total Cash Invested:
$285,000 + $65,000 = $350,000
ROI:
$18,150 ÷ $350,000 × 100 = 5.19%
Annualized ROI:
5.19% × (12 ÷ 6) = 10.37% annualized
70% Rule Check
Max offer per 70% rule = $410,000 × 0.70 − $65,000 = $287,000 − $65,000 = $222,000
The $285,000 purchase price is $63,000 above the 70% rule limit. The deal generates a profit — but a thin one. A softer market, longer hold, or a rehab cost overrun erases it fast. This is the kind of deal where you negotiate harder or walk. Run this scenario yourself in the fix and flip calculator and move the purchase price slider down to see how profit grows with each $5,000 reduction in offer price.
Worked Example 2: Atlanta Townhouse Flip
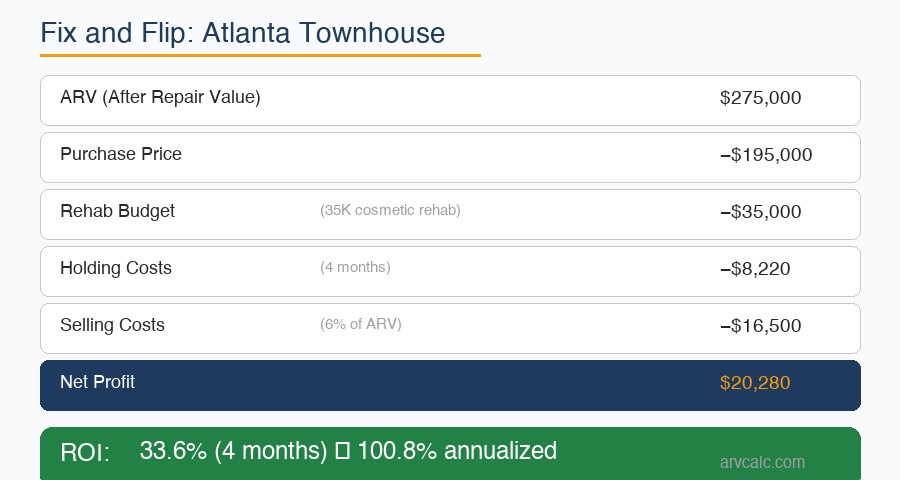
A 2-bed/2.5-bath townhouse in a growing Atlanta suburb. Scope of work: cosmetic — paint, flooring, kitchen cabinet refacing, bathroom fixtures, new light fixtures. Shorter hold means lower carrying costs.
| Input | Amount |
|---|---|
| After Repair Value (ARV) | $275,000 |
| Purchase Price | $195,000 |
| Rehab Budget | $35,000 |
| Hold Period | 4 months |
| Hard Money Rate | 10% annual on purchase price |
| Monthly Property Taxes | $220/month |
| Monthly Insurance | $90/month |
| Monthly Utilities | $120/month |
| Agent Commission (selling) | 6% of ARV |
Step-by-Step Math
Hard money interest:
$195,000 × 10% ÷ 12 × 4 = $6,500
Property taxes:
$220 × 4 = $880
Insurance:
$90 × 4 = $360
Utilities:
$120 × 4 = $480
Total holding costs:
$6,500 + $880 + $360 + $480 = $8,220
Selling costs (6% of $275,000):
$275,000 × 0.06 = $16,500
Net Profit:
$275,000 − $195,000 − $35,000 − $8,220 − $16,500 = $20,280
Total Cash Invested:
$195,000 + $35,000 = $230,000
ROI:
$20,280 ÷ $230,000 × 100 = 8.82%
Annualized ROI:
8.82% × (12 ÷ 4) = 26.46% annualized
70% Rule Check
Max offer per 70% rule = $275,000 × 0.70 − $35,000 = $192,500 − $35,000 = $157,500
Again, the purchase price ($195,000) exceeds the strict 70% rule ceiling ($157,500). The deal still works because the cosmetic scope kept rehab lean and the 4-month hold minimized carrying costs. This illustrates the 70% rule’s role as a conservative filter — not a hard veto. Plug these numbers into the flip profit calculator and compare both deals side-by-side using the real estate ROI calculator.
The 70% Rule — How It Fits
The 70% rule is the fastest pre-screening filter in house flipping. It does not replace a full fix and flip calculator analysis, but it tells you in five seconds whether a deal is worth a deeper look.
The Formula
Max Offer = ARV × 0.70 − Estimated Rehab Cost
Example: ARV = $300,000, Rehab = $40,000
Max Offer = $300,000 × 0.70 − $40,000 = $210,000 − $40,000 = $170,000
The 30% buffer left over is supposed to cover selling costs (~8%), holding costs (~4–6%), and your profit margin (~15–20%). Use the 70% rule calculator to run this instantly, then read the full breakdown in our 70% rule real estate guide.
When the 70% Rule Works
- Quick triage on incoming wholesale leads — run the rule before you even pull comps
- High-volume markets where competition is fierce and thin margins are normal
- Standard residential properties with predictable selling costs
When the 70% Rule Misleads You
- Luxury flips. Selling costs eat a larger percentage; 70% is often too generous.
- Very long holds. 12+ months of carrying costs at 12% interest devour the buffer fast.
- Rural or illiquid markets. Days-on-market can be 6–12 months, compressing effective returns.
- Unique properties. Comp selection becomes difficult; ARV estimates carry higher error.
According to ATTOM Data Solutions, average gross flipping returns in the U.S. were around 27% of purchase price in recent years — which sounds good until you run actual holding costs and see net margins compress to single digits on many deals. The 70% rule protects your margin by building in a conservative cushion from the start.
Fix and Flip vs. BRRRR — Which Strategy Wins?
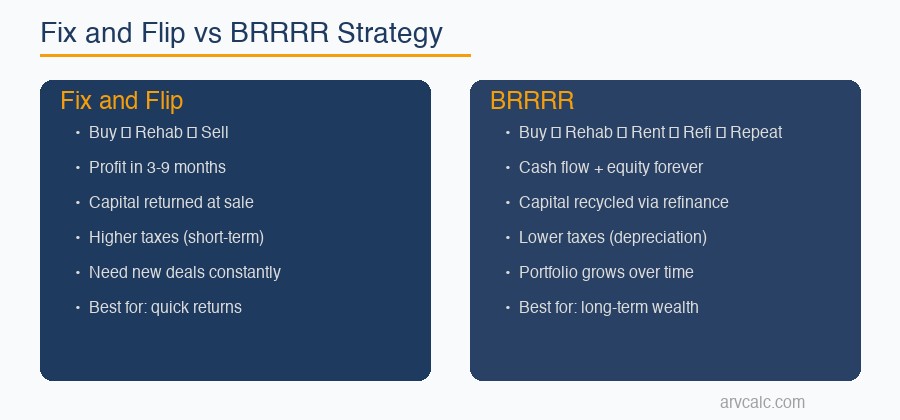
Both strategies start with distressed properties. After that, they diverge sharply. Run the BRRRR calculator alongside the flip calc to compare the same property under both strategies.
| Factor | Fix and Flip | BRRRR |
|---|---|---|
| Goal | Immediate profit at sale | Long-term cash flow + equity |
| Hold Period | 3–12 months | Indefinite (keep the asset) |
| Capital Recovery | Full at sale | Partial via cash-out refinance |
| Tax Treatment | Short-term capital gains (ordinary income if <1 year) | Depreciation, long-term gains if sold later |
| Cash Required | High upfront (purchase + rehab) | High upfront, lower net after refi |
| Ongoing Work | None after sale | Property management ongoing |
| Market Risk | Concentrated — sell into current market | Spread over time |
| Scalability | Limited by capital recycling speed | Scales via equity leverage |
| Best Calculator | Fix and Flip Calculator | BRRRR Calculator |
For investors who want to build a rental portfolio, BRRRR often wins on long-term wealth creation. For those who want quarterly income events and no landlord headaches, flipping wins. The tax difference is significant — flips held under one year are taxed as ordinary income, which can push into the 32–37% bracket for active flippers. See the capital gains tax calculator and our guide on how to avoid capital gains tax on investment property before you decide which path fits your tax situation.
For more on the IRS rules around capital gains holding periods, see the IRS Topic 409 — Capital Gains and Losses.
Holding Costs: The Hidden Profit Killer
Beginners budget for purchase and rehab. Experienced flippers budget for everything in between. Holding costs are silent — they accrue every month whether construction is moving or not.
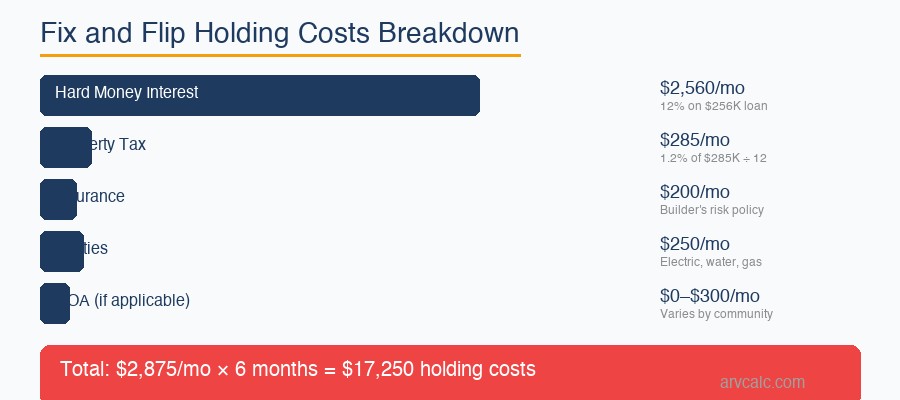
The Five Categories of Holding Costs
1. Hard Money Interest
Hard money loans carry 9–13% annual rates with 1–4 origination points. On a $250,000 loan at 12% held for 8 months, that’s $20,000 in interest alone — before origination fees. Use the hard money loan calculator to model full financing costs and read our hard money loan guide for lender comparison tips.
2. Property Taxes
Property taxes don’t pause during renovation. On a $300,000 purchase in a market with a 1.2% effective tax rate, monthly taxes run $300. Over six months: $1,800. Over twelve months: $3,600. Factor this into your hold period estimate from day one.
3. Insurance
Vacant property insurance (also called builder’s risk or renovation insurance) costs more than standard homeowner policies — often $100–$250/month depending on property value and scope of work. Standard homeowner policies typically void coverage on unoccupied properties beyond 30–60 days. Do not skip this.
4. Utilities
Water, electric, and gas run $100–$300/month depending on climate and what’s being renovated. HVAC testing, running water for tile work, and electricity for power tools all add up. Budget $150/month as a baseline.
5. HOA Fees
Condos and townhouses often carry HOA fees of $200–$600/month. These don’t pause for renovation. In a 6-month hold on a condo with $350/month HOA, that’s $2,100 off the top before you touch a hammer.
Real Numbers: 6-Month Hold on a $300K Purchase
| Cost Category | Monthly | 6-Month Total |
|---|---|---|
| Hard money interest (11%) | $2,750 | $16,500 |
| Property taxes | $300 | $1,800 |
| Vacant property insurance | $150 | $900 |
| Utilities | $175 | $1,050 |
| HOA (if applicable) | $350 | $2,100 |
| Total (with HOA) | $3,725 | $22,350 |
| Total (without HOA) | $3,375 | $20,250 |
That $20,000–$22,000 in carrying costs comes straight out of your profit. If your projected profit is $30,000 and the rehab runs two months over schedule, you’ve lost $6,750–$7,450 in extra carrying costs. Run every scenario in the fix and flip calculator — including a worst-case 2-month extension — before signing the purchase contract.
According to the U.S. Census Bureau’s New Residential Construction data, construction timelines have extended significantly since 2020 due to material and labor supply constraints. That trend affects renovation timelines on flips too.
5 Common Mistakes That Kill Flip Profits
1. Overestimating ARV
Why it matters: Every dollar of ARV error cascades through the entire model. If you overestimate ARV by $20,000, your actual profit shrinks by the same amount. On a deal targeting $25,000 in profit, that’s an 80% error in your actual return.
Fix: Pull a minimum of 5 sold comps within 0.5 miles and 90 days. Adjust for square footage, lot size, age, and condition using a standardized per-square-foot adjustment. If comps are scarce, use the ARV calculator and read our after repair value guide to understand adjustment methodology. When in doubt, use the lowest defensible ARV.
2. Underestimating Rehab Costs
Why it matters: Rehab overruns are the #1 cause of deal failures, according to experienced investors. A $10,000 surprise structural issue on a $40,000 rehab budget is a 25% cost overrun that eliminates most profit scenarios.
Fix: Get three contractor bids. Add a 15–20% contingency buffer on top of the highest bid. Never start construction without a detailed scope of work with line-item pricing. Use the rehab cost estimator to build your scope before meeting contractors. Read the full breakdown in how much does it cost to rehab a house.
3. Ignoring Holding Costs
Why it matters: New investors often subtract only purchase, rehab, and agent commission from ARV. That approach misses $15,000–$25,000 in carrying costs on a typical 6-month flip — turning a projected $30,000 profit into a $5,000–$15,000 gain, or a loss.
Fix: Use the fix and flip calculator with all holding cost fields filled in. Estimate conservatively — assume 1–2 extra months on top of your rehab timeline. Also factor in closing costs on the buy side. See our closing costs on investment property guide and closing costs calculator.
4. Buying in the Wrong Market Conditions
Why it matters: In a declining market, your ARV estimate at purchase becomes a ceiling that drops while you renovate. A 5% price decline on a $400,000 ARV property erases $20,000 from your projected sale price.
Fix: Track months of supply in your target market. Below 3 months is a seller’s market — flips sell fast. Above 6 months is a buyer’s market — price conservatively and shorten scope to exit faster. The NAR existing home sales data gives you national trends; check local MLS data for your specific submarkets.
5. Miscalculating Tax Exposure
Why it matters: A flip held under 12 months is taxed as short-term capital gains — at your ordinary income rate. For an investor in the 32% bracket clearing $50,000 profit on two flips per year, that’s $16,000 to the IRS per deal. This is often the difference between a good business and a mediocre one.
Fix: Run your after-tax ROI using the capital gains tax calculator before you evaluate any deal. If you can extend a hold beyond 12 months by renting temporarily, the long-term capital gains rate (0–20%) may be far more advantageous. Talk to a CPA who specializes in real estate investment. See strategies to reduce capital gains tax on investment property.
Frequently Asked Questions
What is a good profit margin for a house flip?
Most experienced flippers target a minimum net profit of $20,000–$25,000 per deal, or an ROI of at least 10–15% on total cash invested. On an annualized basis, strong deals hit 20–30%+ annualized ROI. Margins below 10% ROI leave no room for cost overruns or a soft market. Run your deal through the fix and flip calculator and compare annualized ROI against alternative investments before committing. According to ATTOM Data, average gross flipping profits have ranged from $60,000–$75,000 in recent years, but gross profit includes no deduction for carrying costs or commissions.
How do you calculate flip profit step by step?
What is the 70% rule in house flipping?
How is fix and flip ROI calculated?
What costs do most beginners forget when flipping houses?
Is it better to flip houses with cash or hard money?
How many houses do professional flippers flip per year?
Related Calculators
Every flip decision connects to a broader set of financial variables. Use these tools in sequence to build a complete picture before committing capital:
- Fix and Flip Calculator — Full profit, ROI, and 70% rule check in one tool
- ARV Calculator — Calculate after repair value from comparable sales
- 70% Rule Calculator — Quick maximum offer screen before pulling comps
- Rehab Cost Estimator — Line-item renovation cost breakdown by room and trade
- Hard Money Loan Calculator — Total financing cost including points and interest
- House Flipping Profit Calculator — Detailed flip P&L with itemized cost tracking
- Closing Costs Calculator — Buyer and seller closing costs by state
- Capital Gains Tax Calculator — Short-term vs. long-term tax exposure on flip profits
- BRRRR Calculator — Compare flip vs. buy-rehab-rent-refinance-repeat on the same deal
- Real Estate ROI Calculator — Annualized ROI comparison across deal types
- All Real Estate Calculators — Full calculator hub for investors
For deeper reading on the strategies behind these numbers, see our guides: how to flip a house (beginner guide), how much does it cost to rehab a house, how to calculate after repair value, and how to use the house flipping profit calculator.
According to NAR’s existing home sales research, inventory constraints continue to support strong resale prices in many markets through 2026 — but local conditions vary significantly. Run every deal in the fix and flip calculator with current local comp data, not national averages.
Leave a Reply