Last updated: October 21, 2026 · Originally published: July 24, 2026 · By Alex Petrov
Florida Cap Rate by City: Real Data + Where Deals Work (2026)
A duplex in Orlando hits the market at $380,000. The listing says rents are “$2,100 per unit per month” — so $4,200 gross. After spending fifteen minutes on a spreadsheet, the buyer thinks the numbers work. Three weeks after closing, the insurance renewal lands in the mailbox: $14,400 a year. The deal that looked like a 6% florida cap rate is now running at 4.1% — below the buyer’s cost of capital.
That story plays out constantly across the state. Florida gets compared to the Midwest on price, but it carries Midwest-plus insurance, and coastal markets carry premiums that can outpace property taxes. Before you model any Florida rental you need real market cap rates, accurate expense defaults, and an honest look at what compresses cap rates in Florida even in the state’s strongest cash-flow cities.
This guide covers florida cap rates city by city, builds two full worked examples with realistic Florida expense assumptions, and flags the most common errors investors make before they buy.
What Makes Florida Cap Rates Different From Other States
Cap rate — net operating income divided by purchase price — is the same formula everywhere. What changes in Florida is the expense stack. Three costs hit harder here than in most other markets:
- Homeowners and wind insurance: Average landlord premiums in South Florida and along both coasts have climbed 40-80% since 2021 following several major hurricane seasons and insurer market exits. Inland markets are meaningfully cheaper, but still above national averages.
- Flood insurance: FEMA flood maps place large portions of Miami-Dade, Pinellas, Lee, and Collier counties in Special Flood Hazard Areas. An NFIP policy on a modest SFR can run $2,000–$6,000 per year. Private flood is available in some zip codes but underwriting tightened significantly after 2023.
- Property tax: Florida has no state income tax — which matters for your personal return — but property taxes at the county level typically run 1.0–1.8% of assessed value for non-homesteaded investment properties. The homestead exemption that resident owners get does not apply to rentals.
On the income side, Florida benefits from strong population growth, high tourism-driven short-term rental demand in coastal markets, and a landlord-friendly legal environment with no statewide rent control. Those fundamentals keep vacancy low and support rents, but they also attract capital that bids prices up, compressing yields. Florida Realtors’ research data shows median single-family prices in the state rising faster than national medians in five of the past six years.
One more Florida-specific cost: documentary stamp taxes (doc stamps) on the deed run $0.70 per $100 of consideration, or $0.35 per $100 on the mortgage note. On a $380,000 acquisition with 75% LTV, that is $2,660 on the deed plus $997 on the note — real closing-cost money that most out-of-state buyers underestimate.
Use the Florida cap rate calculator to run these numbers against any specific property before you make an offer.
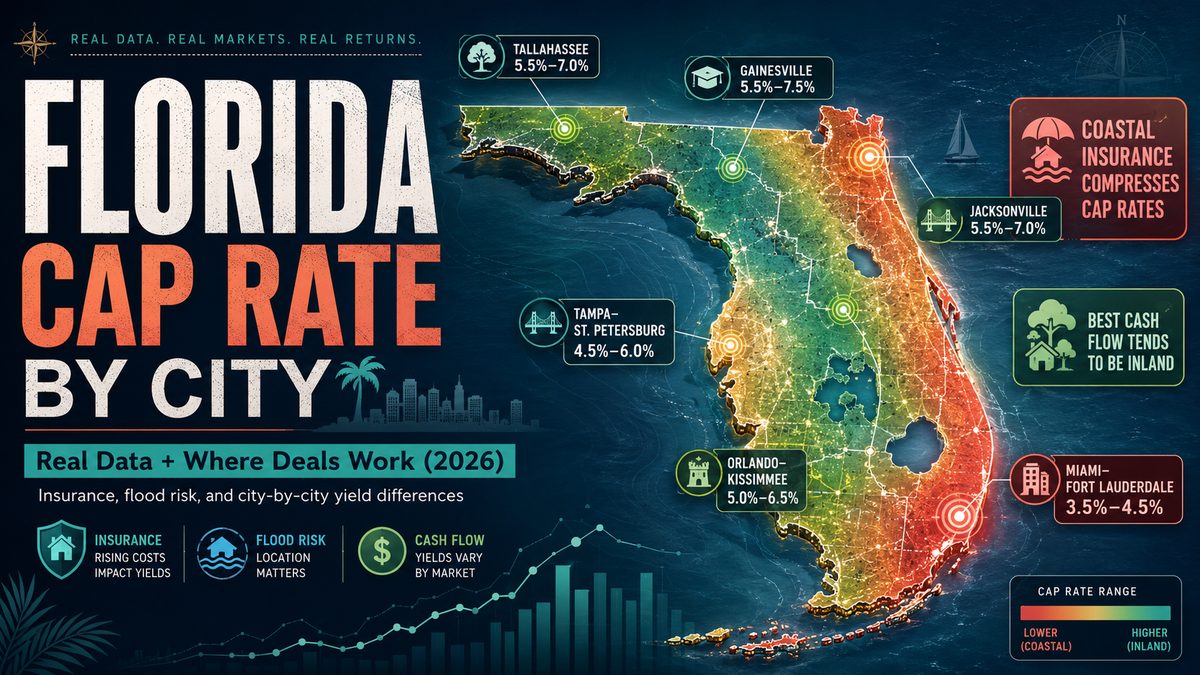
Florida Cap Rate by City: 2026 Market Benchmarks
The table below reflects stabilized, market-rate residential and small multifamily properties transacted in the 12 months ending Q2 2026. Florida rental cap rates vary significantly by location, insurance exposure, and asset type. Ranges are wider in markets with more asset-type variance. Short-term rental premium markets (Miami Beach, Kissimmee, Panama City Beach) are excluded — those operate on different yield logic.
| Metro | Typical Cap Rate Range | Median SFR Price | Avg. Insurance Cost | Coastal / Flood Risk | Investor Outlook |
|---|---|---|---|---|---|
| Miami–Fort Lauderdale | 3.5% – 4.5% | ~$620,000 | $6,000 – $14,000+ | High | Appreciation play; cash flow thin |
| Tampa–St. Petersburg | 4.5% – 6.0% | ~$410,000 | $3,500 – $7,500 | Moderate–High | Strong rent growth, manageable yields |
| Orlando–Kissimmee | 5.0% – 6.5% | ~$370,000 | $2,200 – $4,500 | Low–Moderate | Best long-term rental fundamentals |
| Jacksonville | 5.5% – 7.0% | ~$295,000 | $1,800 – $3,500 | Low–Moderate | Best cash flow in major FL markets |
| Cape Coral–Fort Myers | 4.0% – 5.5% | ~$380,000 | $5,000 – $12,000 | Very High | Compressed post-Ian; insurance watch |
| Sarasota–Bradenton | 4.0% – 5.5% | ~$450,000 | $4,000 – $9,000 | High | Strong demand, tight inventory |
| Gainesville | 5.5% – 7.5% | ~$245,000 | $1,500 – $2,800 | Low | University market, stable occupancy |
| Tallahassee | 5.5% – 7.0% | ~$235,000 | $1,400 – $2,500 | Low | Government/university anchor tenants |
Sources: Zillow Research median home values Q2 2026; insurance estimates from Florida Office of Insurance Regulation market reports; cap rate ranges from broker surveys and closed transaction data.
Coastal vs. Inland: The Single Biggest Variable
The coastal-to-inland spread is not subtle. A property in Pinellas County (St. Pete beach side) might carry $8,000 in combined hazard and flood insurance on a $350,000 triplex. The same triplex layout in Plant City — 30 miles east, no flood zone, lower wind zone — might run $2,400. That $5,600 annual difference compresses cap rate by roughly 1.6 percentage points before you touch any other variable. Investors chasing yield should look inland first: eastern Orange County, the I-4 corridor, Duval County suburbs, and the Panhandle inland markets all offer materially lower insurance costs.
Why Florida Cap Rates Are Compressed (And Will Stay That Way)
Florida saw net in-migration of roughly 365,000 people in 2025 according to Federal Reserve Economic Data (FRED) population estimates. That demand curve — combined with permitting bottlenecks in coastal counties and the desirability premium of year-round warm weather — keeps a floor under property prices even when interest rates are Improved.
Three forces specifically compress Florida property cap rates:
- Price appreciation outpacing rent growth. From 2019 to 2025, Florida median home prices increased roughly 85% while rents grew approximately 45-55% depending on market. That gap — prices rising faster than income — mechanically compresses cap rates because NOI did not keep pace with the denominator (purchase price).
- Out-of-state and international capital chasing Florida assets. Northeast and Midwest investors perceive Florida as cheap relative to their home markets. Buyers from New York or New Jersey see a $400,000 Tampa property as affordable; their yield expectations are different from a local buyer who needs cash flow from day one. This capital competition bids prices past local cash-flow thresholds.
- No state income tax arbitrage. Florida’s zero state income tax makes it attractive to high-income relocators who rent while they look. Those tenants can afford higher rents, which helps landlords — but that same tax advantage also inflates prices as owner-occupant buyers bid aggressively, pushing investor returns down.
The bottom line: do not expect Florida cap rates to normalize back to Midwest levels. The compression is structural. Run your analysis on the cap rate calculator using real current asking prices, not what you think the market “should” look like. For a deeper look at how Florida compares to general investment benchmarks, see what is a good cap rate for a rental property.
Worked Example 1: Orlando Duplex — $380,000 Purchase
This is the scenario from the introduction, run with honest Florida-specific numbers. An investor buys a duplex in east Orlando (zip 32825 — inland, moderate flood risk) for $380,000. Each unit rents at $2,100 per month.
Gross Income
| Gross scheduled rent (2 units × $2,100 × 12) | $50,400 |
| Vacancy allowance (6% — Orlando long-term market) | –$3,024 |
| Effective Gross Income | $47,376 |
Operating Expenses
| Property taxes (1.35% of $380,000, non-homesteaded) | $5,130 |
| Homeowners/landlord insurance (inland Orlando) | $3,200 |
| Flood insurance (low-risk zone, optional but carried) | $900 |
| Property management (8% of EGI) | $3,790 |
| Repairs & maintenance ($100/unit/month) | $2,400 |
| Capital expenditure reserve ($75/unit/month) | $1,800 |
| Landscaping / pest control / trash | $960 |
| Accounting / legal / misc. | $600 |
| Total Operating Expenses | $18,780 |
| Expense ratio (% of EGI) | 39.6% |
Net Operating Income & Cap Rate
| Effective Gross Income | $47,376 |
| Total Operating Expenses | –$18,780 |
| Net Operating Income (NOI) | $28,596 |
| Purchase Price | $380,000 |
| Cap Rate | 7.52% |
Wait — that is higher than the 5.0-6.5% range in the table above. Why? Two reasons: (1) $2,100 per unit is at the upper end of the current east Orlando market, and (2) this property was priced as a value-add deal with below-market expenses. Run the same model at $1,900/unit — a more conservative underwrite — and NOI drops to roughly $24,000, putting cap rate at 6.3%. That is still inside the Orlando range, but it illustrates how sensitive results are to rent assumptions. Use the Florida rental property calculator to stress-test multiple rent scenarios before committing.
Also note: this model does not include mortgage service. Cap rate is a property-level metric. If you finance with a DSCR loan at 7.25%, your debt coverage ratio becomes the binding constraint — check that with the Florida DSCR calculator.
Worked Example 2: Jacksonville SFR — $260,000 Purchase
Jacksonville is Florida’s strongest cash-flow market for conventional long-term rentals. Lower prices, lower insurance costs (inland areas especially), and solid blue-collar tenant demand create conditions where deals can still pencil positive cash flow even with 2026 financing rates.
Property: 3BR/2BA SFR in Southside Jacksonville. Purchase price $260,000. Market rent $1,450/month.
Gross Income
| Gross scheduled rent ($1,450 × 12) | $17,400 |
| Vacancy allowance (5% — Jacksonville SFR) | –$870 |
| Effective Gross Income | $16,530 |
Operating Expenses
| Property taxes (1.25% of $260,000 — Duval County) | $3,250 |
| Homeowners/landlord insurance (inland Jax) | $2,100 |
| Property management (8% of EGI) | $1,322 |
| Repairs & maintenance ($80/mo) | $960 |
| Capital expenditure reserve ($60/mo) | $720 |
| Landscaping / pest / misc. | $480 |
| Total Operating Expenses | $8,832 |
Net Operating Income & Cap Rate
| Effective Gross Income | $16,530 |
| Total Operating Expenses | –$8,832 |
| Net Operating Income (NOI) | $7,698 |
| Purchase Price | $260,000 |
| Cap Rate | 2.96% |
At 2.96%, this deal is below Jacksonville’s typical range and would not clear most investors’ hurdle rates. What went wrong? $1,450/month on a $260,000 SFR is simply not enough rent to generate strong cap rates — the rent-to-price ratio (0.56%) falls below the common 0.8-1.0% benchmark. This property might make sense as a long-term appreciation hold or for a buyer who can buy closer to $210,000, but it does not work as a pure cash-flow acquisition at ask price.
The math improves significantly if you find a Jacksonville property renting at $1,650–$1,800 for the same $260,000 — common in Arlington or the Westside — pushing NOI to $9,500-$11,000 and cap rate to 3.7-4.2%. Still not spectacular, but inside the market range and potentially cash-flow positive depending on financing structure.
For context on how these two metrics interact, see the cap rate vs. GRM comparison — gross rent multiplier can be a faster pre-screen before you build a full expense model.
The Insurance Problem: When It Crushes Your Cap Rate
Florida’s property insurance market is not a footnote — it is a deal-level variable that can make or break a cap rate by 1.5-3.0 percentage points. Here is the math on a coastal Pinellas County property vs. an inland Duval County property, same price, same rent:
| Scenario | Property | Annual Insurance | Impact on NOI | Cap Rate Effect |
|---|---|---|---|---|
| Inland (Duval Co.) | $300K SFR | $2,100 | Baseline | Baseline |
| Coastal (Pinellas Co.) | $300K SFR | $8,400 | –$6,300/yr | –2.1% |
| High-Risk Flood Zone (Miami-Dade) | $300K SFR | $13,500 (hazard + flood) | –$11,400/yr | –3.8% |
Before closing on any Florida investment property, take these steps:
- Run the address through the FEMA Flood Map Service Center to confirm flood zone designation before making an offer.
- Get an insurance quote — not an estimate, an actual quote — from at least two carriers before going under contract, not after.
- Check whether Citizens Property Insurance (Florida’s insurer of last resort) covers the property, and if a private carrier has declined it previously. Citizens policies sometimes come with depopulation risk. The Florida Office of Insurance Regulation publishes insurer financial health data and market reports you can use to vet carriers before binding coverage.
- Ask the seller for current insurance declarations pages as part of due diligence. What they are paying is your starting point, not your ceiling — policies renew upward.
For short-term rental investors, the insurance question is even more complex. STR-specific landlord policies run higher, and some carriers have stopped writing them entirely in certain coastal counties. Read the full breakdown in Airbnb cap rate analysis for Florida markets.
5 Cap Rate Mistakes That Cost Florida Investors Money
1. Using Listing Agent Rent Projections Without Verification
Florida listing agents — especially in tourist-adjacent markets — routinely present “potential rental income” figures that include short-term rental income at peak season occupancy. A property in Kissimmee might show $6,000/month in projected STR income on the listing sheet. As a long-term rental, that same unit might generate $1,800. These are completely different assets with different cap rates, different expense structures, and different regulatory exposure. Always define which rental strategy you are underwriting before you look at a single number.
2. Ignoring the Non-Homesteaded Tax Assessment
When an owner-occupant sells a property, it is reassessed at the sale price for property tax purposes. Florida’s Save Our Homes cap — which limits assessment increases to 3% per year — only applies to homesteaded properties. When you buy an investment property, you lose whatever benefit the previous owner was enjoying. A house the seller was paying $3,500/year in taxes on might reassess to a $5,800 bill in your first year. Get the current millage rate for the county, multiply by the expected assessed value (typically close to purchase price for recent sales), and use that number — not the seller’s current tax bill.
3. Underestimating Vacancy in Newer Markets
Tampa and Orlando have seen significant new apartment supply added in 2024-2025, particularly in the Class A segment. While single-family and small multifamily vacancy remains low in established neighborhoods, new product in suburban growth corridors (Wesley Chapel, Horizon West, Nocatee) has created pockets of Improved vacancy as the new supply gets absorbed. Use 7-8% vacancy in these submarkets, not 5%.
4. Forgetting About HOA Fees on Investment Condos and Townhomes
Condo and townhome HOAs in Florida have dramatically increased dues following the 2022 Florida Senate Bill 4-D, which requires condominium buildings to fund reserves for structural components. HOA fees on older condo buildings in South Florida have risen 40-200% in some cases. Run an HOA document review as part of due diligence — an extra $400/month in HOA dues eliminates roughly 1.3 cap rate points on a $350,000 asset.
5. Treating Cap Rate as the Complete Picture on Leveraged Deals
A 5.5% cap rate sounds decent until you finance at 7.25%. You have a negative leverage spread — meaning your financing costs more than your cap rate, making every dollar of debt destructive to cash-on-cash returns. In 2026’s rate environment, Florida deals that were strong at 4% financing look very different. Always model the leveraged return separately from the unlevered cap rate. The Florida DSCR calculator and the Florida rental property calculator both show debt service impact clearly.
Florida Cap Rate: Long-Term vs. Short-Term Rentals
Florida is one of the top five Airbnb markets in the US by total revenue. In tourist corridors — the Orlando/Kissimmee vacation belt, the Gulf Coast beaches, and the Keys — STR income can run 2-3x long-term rental income, which theoretically implies much higher cap rates. In practice, STR operations carry higher expense ratios (management fees of 20-30%, higher furnishing and maintenance costs, seasonal vacancy, and regulatory risk) that compress the actual cap rate difference.
Several municipalities have tightened STR regulations since 2023. Some Orange County municipalities require STR permits. Miami Beach has attempted (and partially succeeded) in restricting STRs in residential zones. The regulatory risk is real and should be priced in as a risk premium, not ignored. If you are modeling a Florida STR purchase, see the full Airbnb cap rate methodology before you run numbers.
For investors who want stable income without the operational overhead of STRs, the Florida rental property investment guide covers market selection, tenant profile, and lease structure in detail.
Where to Find Positive Cash Flow in Florida (2026)
Given compressed coastal yields and Improved insurance costs, where does the Florida cap rate math still hold up?
- Northeast Jacksonville (Duval County inland): Zip codes like 32218, 32221, 32234 offer price points under $280,000 for SFRs renting at $1,500-$1,700. Low insurance, solid employment base (Amazon fulfillment, Fidelity, banking sector). Cap rates consistently hitting 5.5-7% on off-market deals.
- East Orlando / Azalea Park / Union Park: Workforce housing demand is strong, prices are below the metro median, and flood risk is low. Duplex and triplex product here trades at 5.5-6.5% when sellers are motivated.
- Gainesville: University of Florida provides permanent tenant demand. Student-adjacent housing near campus delivers 6-7.5% cap rates. Management-intensive but vacancy is structurally low.
- Ocala / Marion County: Florida’s fastest-growing smaller metro by percentage, driven by horse country appeal and I-75 corridor logistics growth. Prices under $250,000 common. Cap rates 6-8% for buy-and-hold investors willing to work outside major metros.
- Lakeland (Polk County): Midpoint of the I-4 corridor between Tampa and Orlando. Logistics and healthcare employment base. Significantly cheaper than either endpoint with improving rent fundamentals.
How No State Income Tax Affects Your Florida Returns
Florida’s zero state income tax is frequently cited as a reason to invest here. For investors who also live in Florida, the benefit is real — rental income, capital gains (at the state level), and pass-through income from LLCs are all free of state tax. That can mean $5,000-$20,000 in annual savings for a landlord with a meaningful portfolio, compared to investing from New York (8.82% top rate) or California (13.3%).
However, the state income tax advantage does not appear in the cap rate calculation. Cap rate is a property metric, not an investor metric. The tax savings accrue to the owner’s personal return, which means they affect after-tax cash-on-cash yield and internal rate of return — but they do not change the NOI or the cap rate used to value the asset. Don’t let the tax story push you into a cap rate that doesn’t work on its own merits. See the full cap rate benchmarks guide for target ranges by market type.
The Tax Foundation’s Florida profile provides a full breakdown of state and local tax burden for investors and business owners.
Frequently Asked Questions: Florida Cap Rate
A “good” florida cap rate depends heavily on the market and strategy. In Miami, 3.5-4.5% is typical — deals that trade at 5%+ are uncommon and usually have a story (deferred maintenance, below-market rents). In Jacksonville, 5.5-7% is achievable and considered solid for a cash-flow play. As a general rule, any Florida cap rate that clears your all-in financing cost by 50+ basis points with realistic expenses is defensible. In 2026 with DSCR loan rates around 7-7.5%, that means you need 7.5-8%+ to be strongly cash-flow positive — rare in Florida. Most investors here are accepting negative leverage in exchange for appreciation potential and tax benefits.
Miami prices have been bid up by international capital, domestic relocators from high-cost Northeast and West Coast cities, and luxury demand that has no equivalent in Jacksonville. Prices per square foot are 2-3x higher in Miami than Jacksonville, while rents are only 1.4-1.7x higher. That ratio compression mathematically produces lower cap rates. Also, Miami insurance costs are significantly higher due to coastal exposure and flood risk, which further reduces NOI. Jacksonville’s lower price points, inland location (for most investment-grade neighborhoods), and lower insurance load produce materially higher yields.
No. Cap rate is calculated from property-level cash flows: NOI divided by price. State income tax is an investor-level expense — it affects your personal return on income, but it does not flow through the NOI calculation. The tax advantage is real and improves after-tax cash-on-cash return and IRR for investors who are Florida residents, but it does not change the cap rate itself.
Budget ranges vary dramatically by location. Inland markets (Gainesville, Tallahassee, interior Duval County): $1,400-$2,800/year for a typical SFR. I-4 Corridor (Orlando, Lakeland): $2,200-$4,500. Tampa Bay coastal: $3,500-$7,500+. South Florida coastal: $6,000-$14,000+ when flood insurance is included. These are ranges — actual quotes can fall outside them based on roof age, construction type, and individual underwriting. Always get a real quote before closing; use estimated ranges only for preliminary screening.
Cap rate is an unlevered metric: it ignores financing and measures property-level yield (NOI ÷ price). Cash-on-cash return measures actual cash returned on your invested equity after debt service. In Florida’s current environment, a property with a 5.5% cap rate financed at 7.25% DSCR loan will likely have a negative or near-zero cash-on-cash return in year one, because the debt service exceeds the NOI. Cap rate is useful for comparing properties and markets; cash-on-cash is what tells you whether the deal actually puts money in your pocket.
It depends on the market and operator. Florida STRs in the right locations (Orlando vacation belt, Gulf beach towns) can generate gross revenue 2-3x long-term rent — but after STR management fees (20-30%), higher insurance, furnishing, and heavier maintenance, the net advantage narrows. Regulatory risk is the biggest wildcard. Several Florida municipalities have restricted or are actively considering restrictions on STRs, which can eliminate income overnight. Investors willing to operate or hire active management and who can absorb regulatory uncertainty can do well. Passive investors looking for stable cap rates are generally better served by long-term rentals.
The formula is the same as any property: (Annual NOI ÷ Purchase Price) × 100. For Florida multifamily specifically, make sure your expense model includes non-homesteaded property tax (typically 1.1-1.6% of assessed value depending on county), landlord insurance and flood insurance appropriate to the flood zone, property management (7-10% for smaller properties), and realistic reserves for HVAC, roof, and plumbing — Florida’s humidity accelerates wear on those systems. Use the Florida cap rate calculator which pre-loads Florida-specific expense defaults so you do not have to build the model from scratch.
Bottom Line on Florida Cap Rates
Florida is not a cap rate market — it is an appreciation market with selective pockets of real cash flow. Miami and coastal properties trade on the expectation of continued price appreciation, population growth, and scarcity; you are accepting compressed yields in exchange for that tailwind. Jacksonville, Gainesville, inland Orlando, and Ocala are where the numbers can actually work on a cash-flow basis in 2026, provided you model insurance correctly and do not overpay relative to rents.
The biggest mistakes investors make in Florida come down to expense modeling: underestimating insurance, missing the non-homesteaded property tax reset, and ignoring HOA structural reserve increases on condos. These errors are especially costly because the cap rate for Florida rentals is already compressed — thin margins leave no room for surprise expenses. Get those variables right and you will know within ten minutes whether a deal is worth pursuing. Get them wrong and you will find out at renewal time — when the deal is already yours.
Start with the Florida cap rate calculator for quick screening, then move to the Florida rental property calculator when you are ready to build a full model on a specific property.
.blog-post {
max-width: 800px;
margin: 0 auto;
font-family: -apple-system, BlinkMacSystemFont, ‘Segoe UI’, Roboto, sans-serif;
font-size: 1.0625rem;
line-height: 1.75;
color: #1a1a2e;
}
.post-header { margin-bottom: 2rem; }
.post-meta { color: #666; font-size: 0.875rem; }
h1 { font-size: 2rem; line-height: 1.2; margin-bottom: 0.5rem; }
h2 { font-size: 1.5rem; margin-top: 2.5rem; margin-bottom: 1rem; border-bottom: 2px solid #e8f0fe; padding-bottom: 0.35rem; }
h3 { font-size: 1.15rem; margin-top: 1.75rem; margin-bottom: 0.5rem; }
a { color: #1a73e8; text-decoration: none; }
a:hover { text-decoration: underline; }
ul, ol { padding-left: 1.5rem; margin-bottom: 1rem; }
li { margin-bottom: 0.4rem; }
/* Tables */
.table-responsive { overflow-x: auto; margin: 1.5rem 0; }
.data-table,
.calc-table {
width: 100%;
border-collapse: collapse;
font-size: 0.9375rem;
}
.data-table caption {
caption-side: top;
font-size: 0.8125rem;
color: #555;
margin-bottom: 0.5rem;
text-align: left;
}
.data-table th,
.data-table td,
.calc-table td {
border: 1px solid #dde3f0;
padding: 0.6rem 0.85rem;
text-align: left;
vertical-align: top;
}
.data-table thead th {
background: #1a73e8;
color: #fff;
font-weight: 600;
}
.data-table tbody tr:nth-child(even) { background: #f5f8ff; }
.calc-table { margin: 0.75rem 0 1.25rem; }
.calc-table td.num { text-align: right; white-space: nowrap; font-variant-numeric: tabular-nums; }
.calc-table .result-row td { background: #e8f5e9; font-weight: 700; font-size: 1.05rem; }
.calc-table .expense-ratio td { color: #555; font-size: 0.875rem; }
/* FAQ accordion */
.faq-section { margin-top: 2.5rem; }
.faq-item { border: 1px solid #dde3f0; border-radius: 6px; margin-bottom: 0.75rem; overflow: hidden; }
.faq-question {
width: 100%;
background: #f5f8ff;
border: none;
padding: 1rem 1.25rem;
text-align: left;
font-size: 1rem;
font-weight: 600;
cursor: pointer;
display: flex;
justify-content: space-between;
align-items: center;
color: #1a1a2e;
}
.faq-question::after {
content: ‘+’;
font-size: 1.4rem;
color: #1a73e8;
flex-shrink: 0;
margin-left: 1rem;
}
.faq-question[aria-expanded=”true”] { background: #e8f0fe; }
.faq-question[aria-expanded=”true”]::after { content: ‘−’; }
.faq-answer {
display: none;
padding: 0 1.25rem 1rem;
}
.faq-question[aria-expanded=”true”] + .faq-answer { display: block; }
/* Related calculators */
.related-calculators { background: #f5f8ff; border-radius: 10px; padding: 1.75rem; margin-top: 2.5rem; }
.calc-grid { display: grid; grid-template-columns: repeat(auto-fill, minmax(280px, 1fr)); gap: 1rem; margin-top: 1rem; }
.calc-card { background: #fff; border: 1px solid #dde3f0; border-radius: 8px; padding: 1.1rem 1.25rem; }
.calc-card h3 { margin: 0 0 0.4rem; font-size: 1rem; }
.calc-card p { margin: 0; font-size: 0.875rem; color: #444; }
.post-conclusion { background: #fffde7; border-left: 4px solid #f9a825; padding: 1.25rem 1.5rem; border-radius: 0 8px 8px 0; margin-top: 2rem; }
@media (max-width: 600px) {
h1 { font-size: 1.5rem; }
h2 { font-size: 1.25rem; }
.calc-grid { grid-template-columns: 1fr; }
}
document.querySelectorAll(‘.faq-question’).forEach(function(btn) {
btn.addEventListener(‘click’, function() {
var expanded = this.getAttribute(‘aria-expanded’) === ‘true’;
this.setAttribute(‘aria-expanded’, expanded ? ‘false’ : ‘true’);
});
});
Frequently Asked Questions
What is a good cap rate in this state?
Cap rates vary by city and neighborhood within each state. Metropolitan areas typically show 4-6% cap rates for Class A properties and 7-10% for Class B/C properties. Rural areas and secondary markets often have higher cap rates (8-12%) but may come with higher vacancy and less appreciation.
Are these numbers current?
Data is based on the most recent available market reports, Census Bureau statistics, and MLS data. Real estate markets change — always verify current numbers with local agents, property managers, and recent comparable sales before making investment decisions.
Should I invest in this state?
The best state for investment depends on your strategy (cash flow vs appreciation), budget, risk tolerance, and whether you plan to self-manage or hire property management. Compare multiple markets using our calculators and research landlord-tenant laws, property taxes, and insurance costs for each state.
How do property taxes compare?
Property tax rates vary significantly — from 0.28% (Hawaii) to 2.47% (New Jersey). Even within a state, rates differ by county. Always check the specific county tax rate and factor it into your investment analysis. Higher taxes reduce NOI and cap rate.
Do I need a local property manager?
For out-of-state investing, a property manager is essential. Budget 8-12% of collected rent for management fees plus leasing fees. Interview at least three local PMs before choosing one. Ask about their vacancy rates, maintenance markup, and portfolio size.
Leave a Reply