Last updated: September 24, 2026 · Originally published: August 18, 2026 · By Alex Petrov
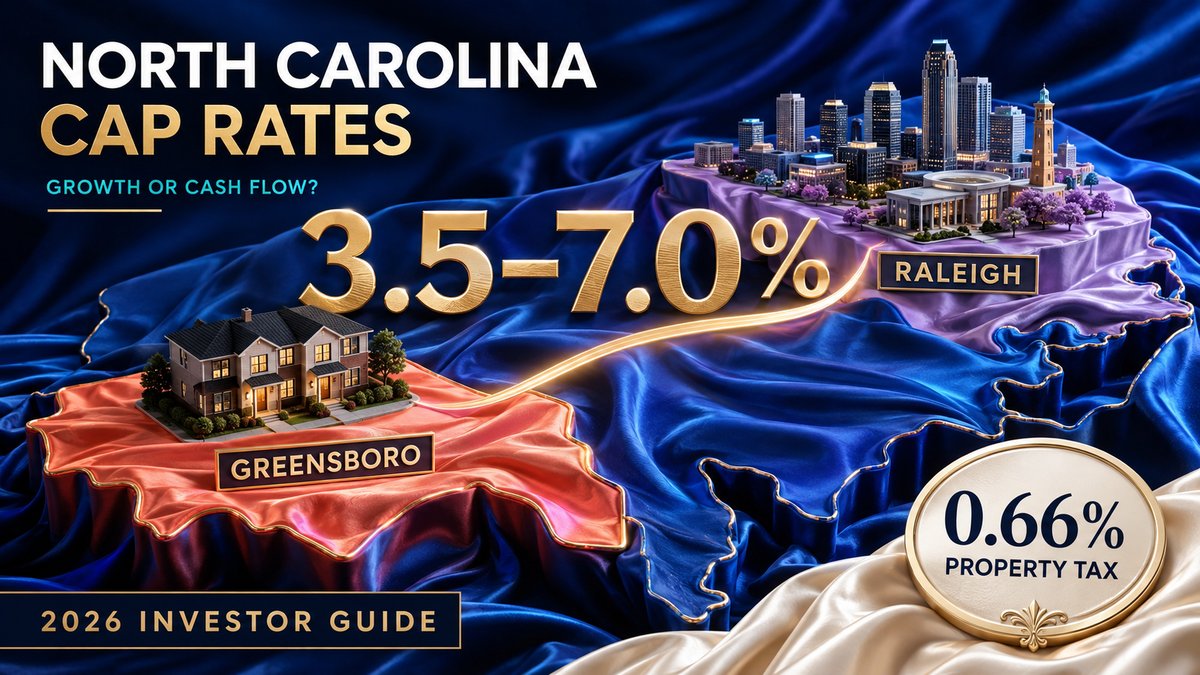
North Carolina cap rates range from 3.5–4.5% in Raleigh to 5.5–7% in Greensboro — shaped by NC’s ultra-low 0.66% property tax that boosts NOI above most competing states. The tradeoff: insurance costs spiked to $3,000/yr after consecutive rate hikes, compressing cap rates from 2023 levels. Use the NC cap rate calculator to analyze any deal with state-specific defaults.
North Carolina Cap Rates by City: 2026 Data
| Metro | Median Price | Median Rent | Typical Cap Rate | Vacancy | Property Tax |
|---|---|---|---|---|---|
| Greensboro–High Point | $245,000 | $1,300/mo | 5.5–7.0% | 6.5% | 0.95% |
| Asheville | $395,000 | $1,650/mo | 4.5–5.5% | 5.0% | 0.65% |
| Charlotte | $420,000 | $1,750/mo | 3.5–4.5% | 4.5% | 0.83% |
| Raleigh–Cary | $460,000 | $1,800/mo | 3.0–4.0% | 4.0% | 0.72% |
Greensboro leads on cap rate because of lower purchase prices and the Toyota battery plant corridor driving rental demand. Raleigh has the lowest cap rates — compressed by Research Triangle tech growth and sub-4% vacancy. Both are rational pricing: higher cap rate = more risk (slower growth, higher vacancy), lower cap rate = premium for stability and appreciation.
What Drives Cap Rates in North Carolina
Property tax advantage. NC’s 0.66% effective rate per Tax Foundation is the lowest among the 5 states we cover. On a $300K property, NC tax is $1,980 — vs $4,200 in Texas. That $2,220 difference goes straight to NOI, adding roughly 0.7% to cap rate vs an identical Texas property.
Insurance headwind. NC insurance rose to $3,000/yr after 7.5% hikes in 2025 and 2026. Coastal counties run $4,000–$6,000. This $1,000–$3,000 increase since 2023 has compressed cap rates by 0.3–1.0% depending on the market. Data from NC Department of Insurance.
Tech-driven compression in the Triangle. Raleigh-Durham cap rates are 3–4% — among the lowest in the Southeast. Apple, Google, Epic Games campus openings absorb housing supply faster than builders can deliver. Investors accept low cap rates because they are pricing in 5%+ annual appreciation. Verify with FRED NC economic data.
Greensboro: Highest Cap Rates in NC
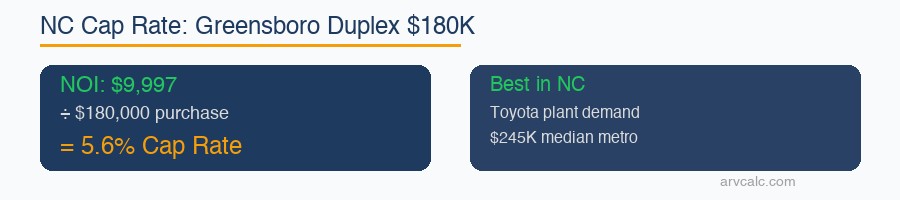
A $180K duplex renting for $1,500/month produces roughly $10,000 NOI and a 5.6% cap rate — best in NC. Toyota’s battery plant in Randolph County and growing logistics sector (Amazon, FedEx) provide demand. Properties sell in 25 days.
The risk: Greensboro has the highest vacancy in NC (6.5%) and weakest appreciation (3.8% YoY vs Charlotte’s 4.5%). Cap rates are higher because the market prices in these risks. For investors who can manage vacancy, Greensboro delivers the strongest income yield. Calculate your deal in the NC cap rate calculator.
Charlotte: Banking Growth, Compressed Caps
Charlotte cap rates sit at 3.5–4.5%. A $420K SFR at $1,750/month rent produces roughly $10,000 NOI — a 2.4% cap rate that reflects appreciation pricing. Bank of America, Wells Fargo, and the new light rail expansion drive demand. Vacancy at 4.5% is tight.
Charlotte works for total-return investors: negative cash flow offset by 4.5% annual appreciation and principal paydown. Calculate total ROI in the ROI calculator.
Raleigh: Lowest Cap Rates, Strongest Fundamentals
Raleigh cap rates at 3–4% are the lowest in NC and among the lowest in the Southeast. The Research Triangle’s tech ecosystem (Apple, Google, Epic Games, plus NC State/Duke/UNC) creates sustained demand. Properties sell in 16 days. Vacancy at 4.0% is the tightest in NC.
At $460K median, Raleigh is a conventional-loan-only market. DSCR ratios fall well below 1.00. Investors buy Raleigh for 10+ year holds with appreciation as the primary return driver. Check DSCR in the NC DSCR calculator.
Asheville: Tourism + Low Tax
Asheville’s 0.65% property tax (Buncombe County) is the lowest among NC metros. Cap rates run 4.5–5.5% — better than Charlotte/Raleigh because of the mountain market’s pricing dynamics. STR potential is significant (year-round tourism). Limited new construction keeps supply tight.
NC Cap Rate vs Other States
| State | Typical SFR Cap Rate | Property Tax | Insurance | Income Tax |
|---|---|---|---|---|
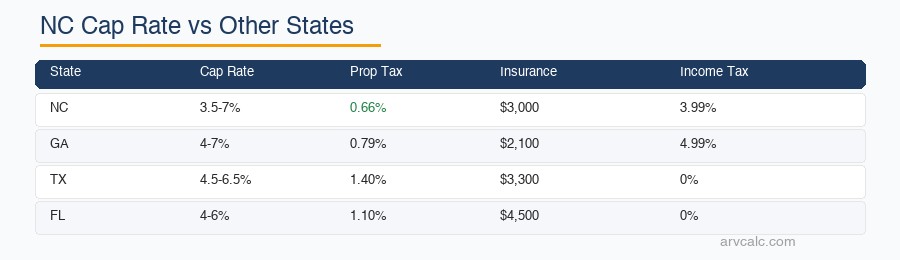
| North Carolina | 3.5–7.0% | 0.66% | $3,000 | 3.99% |
| Georgia | 4.0–7.0% | 0.79% | $2,100 | 4.99% |
| Ohio | 5.0–7.0% | 1.36% | $2,100 | 2.75% |
| Texas | 4.5–6.5% | 1.40% | $3,300 | 0% |
| Florida | 4.0–6.0% | 1.10% | $4,500 | 0% |
NC’s wide cap rate range (3.5–7%) reflects the gulf between Raleigh (tech premium) and Greensboro (value market). The 0.66% property tax is the best of all five states. Insurance ($3,000) has risen to TX-like levels but remains below FL ($4,500). For full state comparison, see cap rate by state guide.
5 NC Cap Rate Mistakes
1. Using Statewide Tax Rate for Durham County
Why: Statewide 0.66% vs Durham 1.04% = 58% higher. On a $400K property: $2,640 vs $4,160 — $1,520/year difference = 0.4% cap rate swing.
Fix: County-specific rate from the county tax assessor. The NC cap rate calculator defaults statewide — override it.
2. Ignoring Post-2025 Insurance Increases
Why: Using $1,800/yr estimates from 2023 when actual 2026 cost is $3,000+. That $1,200 difference is 0.3–0.5% cap rate on a $300K property.
Fix: Budget $3,000 minimum for inland, $4,000+ for coastal. Get real quotes.
3. Comparing Raleigh Cap Rates to Greensboro
Why: 3.5% in Raleigh and 6% in Greensboro are different risk profiles. Raleigh has Apple/Google demand and 4% vacancy. Greensboro has 6.5% vacancy and manufacturing dependence.
Fix: Compare within the same metro. Use cap rate to rank deals in the same city.
4. Not Accounting for 3.99% State Income Tax
Why: Cap rate is pre-income-tax. After 3.99% NC tax, your effective yield drops. A 5% cap rate in NC delivers less after-tax than 5% in TX/FL (0% tax).
Fix: Calculate after-tax cash flow separately in the cash flow calculator.
5. Underestimating Coastal Cap Rate Drag
Why: Wilmington/OBX insurance at $5,000–$6,000/yr + flood insurance $1,500 = $7,500 total. On a $350K coastal property, that is 2.1% of value consumed by insurance alone.
Fix: Coastal deals must work on STR income (2-3x LTR rent) to produce acceptable cap rates.
Frequently Asked Questions
What is a good cap rate in North Carolina?
Greensboro: 5.5–7% (cash flow). Asheville: 4.5–5.5% (tourism + low tax). Charlotte: 3.5–4.5% (appreciation). Raleigh: 3–4% (tech premium). A “good” cap rate depends on your strategy. Use the NC cap rate calculator.
How does NC property tax affect cap rate?
Why did NC cap rates drop in 2025-2026?
Is Greensboro or Charlotte better for cap rate investing?
How do NC cap rates compare to Georgia and Ohio?
Related NC Tools
- NC Cap Rate Calculator
- NC Rental Property Calculator
- NC Closing Costs Calculator
- NC DSCR Calculator
- NC BRRRR Calculator
- NC Calculator Hub
- NC Rental Property Guide
- What Is a Good Cap Rate?
- Cap Rate by State 2026
- All 30+ Calculators
Durham: Research Triangle Value Play
Median price: $330,000 · Rent: $1,500/mo · Vacancy: 4.5% · Tax: 1.04%
Durham sits between Raleigh pricing ($460K) and Greensboro value ($245K). Duke University and the biotech corridor (Research Triangle Park) provide stable employment and tenant demand. Cap rates run 4–5.5% — better than Raleigh, worse than Greensboro. Durham’s 1.04% property tax is the highest among NC metros, which drags NOI. But 4.5% vacancy and 5.2% annual appreciation offset the tax burden for buy-and-hold investors.
How to Calculate NC Cap Rate: Step by Step
The formula is straightforward:
Cap Rate = Net Operating Income (NOI) ÷ Purchase Price × 100Where NOI = Gross Rent − Vacancy − Operating Expenses (tax, insurance, maintenance, PM). Mortgage is NOT included — cap rate measures unlevered property yield.
Quick example: Greensboro duplex, $180K purchase, $1,500/mo rent.
Gross rent: $18,000/yr
Vacancy (6.5%): −$1,170
EGI: $16,830
Expenses: −$6,833
NOI: $9,997

Cap Rate = $9,997 ÷ $180,000 = 5.6%
Run your own numbers in the NC cap rate calculator. For NOI breakdown, use the NOI calculator.
Leave a Reply