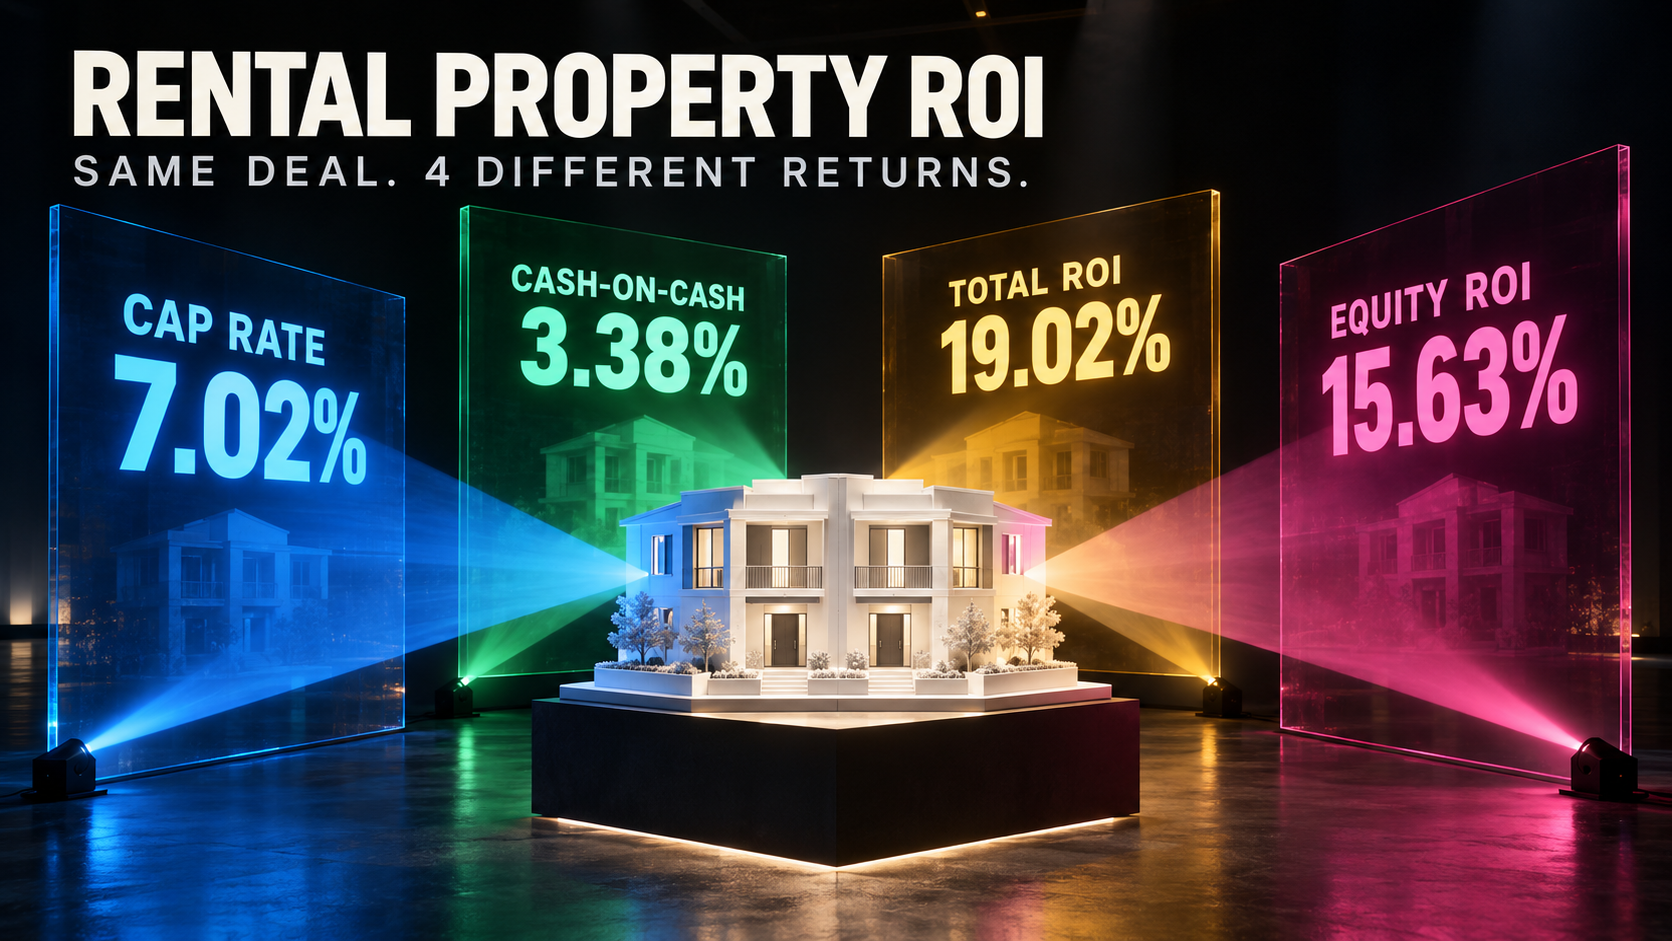
Published: October 6, 2026 · By Alex Petrov
Ask five investors for the ROI on a rental property, and you will get five different answers. Not because they are bad at math, but because “rental property ROI” is not a single number. It depends on which formula you use, which costs you include, and whether you account for appreciation, tax benefits, or just cash flow.
I bought a Memphis duplex last year. The seller’s listing said “11% return.” My broker quoted 7.1%. My lender’s underwriting showed 9.3%. My accountant, factoring in depreciation and value growth, told me 18.6%. All four numbers were correct — they were just measuring different things.
This guide walks through all four ways to calculate ROI on a rental property, using that same Memphis duplex as the running example. By the end, you will know which metric to trust for your specific situation and how to avoid the mistakes that make most ROI projections worthless.
In This Article:
- Why There Are 4 Different ROI Numbers
- The Memphis Duplex: Our Test Case
- Method 1: Cap Rate ROI
- Method 2: Cash-on-Cash ROI
- Method 3: Total ROI (With Appreciation)
- Method 4: Equity ROI
- Side-by-Side Comparison
- Which ROI Metric to Use When
- 5 ROI Calculation Mistakes That Cost Investors Money
- Run Your Own Numbers
- FAQ
Why There Are 4 Different ROI Numbers
Return on investment in real estate is not like a savings account where you earn 4.5% and that is the end of the story. Rental property builds wealth through multiple channels at the same time: monthly cash flow, property appreciation, mortgage paydown by tenants, and tax benefits through depreciation.
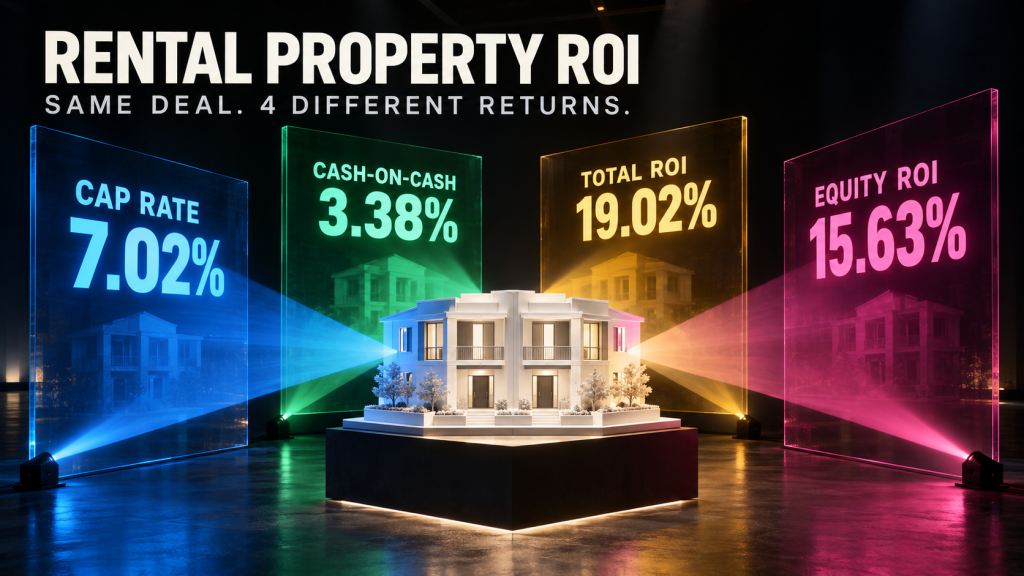
Each ROI formula captures a different slice of that picture:
- Cap rate ignores financing entirely. It treats the property as if you paid all cash and measures pure property-level income yield.
- Cash-on-cash return focuses on your actual out-of-pocket cash and the annual cash flow it generates. Financing matters here.
- Total ROI adds appreciation and equity buildup to the cash flow. It gives the full annual return picture.
- Equity ROI measures return relative to your current equity position, not your original investment. It tells you whether your money is working hard enough right now.
None of these is “wrong.” Each answers a different question. The problem is that most investors latch onto whichever number looks best and ignore the rest. I have seen people buy 3% cash-on-cash deals because the “total ROI” looked like 15% — then get crushed when appreciation stalled and they could not cover the mortgage.
Let me show you how each formula works on the same property, so the differences become obvious.
The Memphis Duplex: Our Test Case
Here are the actual numbers on a side-by-side duplex in Memphis, TN. I am using real market data from the U.S. Census American Housing Survey for rent levels and NAR research for appreciation estimates.
| Item | Amount |
|---|---|
| Purchase Price | $215,000 |
| Down Payment (25%) | $53,750 |
| Closing Costs (2.5%) | $5,375 |
| Minor Repairs at Close | $3,000 |
| Total Cash Invested | $62,125 |
| Loan Amount | $161,250 |
| Interest Rate | 7.1% |
| Loan Term | 30 years |
| Monthly Mortgage (P&I) | $1,083 |
| Monthly Rent (both units) | $2,100 |
| Vacancy Rate | 7% |
| Annual Operating Expenses | $8,340 |
| Annual Appreciation (Memphis avg) | 3.8% |
Operating expenses include property taxes ($2,400), insurance ($1,440), property management at 8% ($1,882), maintenance reserves ($1,800), and miscellaneous ($818). These come straight from the Rental Property Calculator, which breaks down each line item automatically.
Now let me run this same property through each ROI method.
Method 1: Cap Rate ROI — The Property’s Raw Yield
Cap Rate = Net Operating Income / Purchase Price x 100
Cap rate strips everything down to the property itself. No financing, no appreciation, no tax games. Just: how much income does this building produce relative to its price?
Step 1: Calculate gross effective income.
$2,100/month x 12 = $25,200 gross rent. After 7% vacancy: $25,200 x 0.93 = $23,436.
Step 2: Subtract operating expenses.
$23,436 – $8,340 = $15,096 NOI.
Step 3: Divide by purchase price.
$15,096 / $215,000 = 7.02% cap rate.
A 7% cap in Memphis tracks with current market data. According to the National Association of Realtors, small multifamily cap rates in mid-South markets range from 6.5% to 8.2% in 2026.
When cap rate is the right metric: Comparing two properties you could buy, especially when financing terms are identical or you are paying cash. Cap rate removes leverage from the equation and tells you which building generates more income per dollar of price. Our Cap Rate Calculator handles this automatically, including a market-specific benchmark comparison.
The limitation: Cap rate tells you nothing about your actual return as a financed investor. I put $62,125 into this deal, not $215,000. Judging my personal return at 7% ignores the leverage effect entirely.
Method 2: Cash-on-Cash ROI — Your Actual Cash Return
Cash-on-Cash Return = Annual Pre-Tax Cash Flow / Total Cash Invested x 100
This is where most investors should start. Cash-on-cash tells you what your actual dollars are earning in cash flow right now. It includes your mortgage payment, so it reflects the deal as you structured it.
Step 1: Calculate annual cash flow.
NOI from above: $15,096. Annual mortgage payments: $1,083 x 12 = $12,996. Cash flow: $15,096 – $12,996 = $2,100.
Step 2: Divide by total cash invested.
$2,100 / $62,125 = 3.38% cash-on-cash.
Wait — 3.38%? That is less than a savings account. And that is exactly the reality check that cash-on-cash provides in a 7.1% rate environment. The property generates solid NOI, but the mortgage eats most of it.
This is why I keep telling people to run the numbers through our Cash-on-Cash Calculator before making offers. The gap between cap rate and cash-on-cash return widens as interest rates rise. At a 5% mortgage rate, this same property would cash-on-cash at 7.8%. At 7.1%, it drops to 3.38%.
| Mortgage Rate | Monthly Payment | Annual Cash Flow | Cash-on-Cash Return |
|---|---|---|---|
| 5.0% | $866 | $4,704 | 7.57% |
| 6.0% | $967 | $3,492 | 5.62% |
| 7.1% | $1,083 | $2,100 | 3.38% |
| 8.0% | $1,183 | $900 | 1.45% |
When cash-on-cash is the right metric: When you are evaluating whether a deal will put money in your pocket this year. If you need the property to cover its costs and generate income, this is your number. Read our full Cash-on-Cash Return Guide for deeper benchmarking against average returns by market.
The limitation: Cash-on-cash ignores equity buildup, appreciation, and tax benefits. A property with 3% cash-on-cash and 4% appreciation is building wealth faster than a bond paying 5% — but this metric will not show you that.
Method 3: Total ROI — The Full Picture
Total ROI = (Cash Flow + Equity Buildup + Appreciation) / Total Cash Invested x 100
Total ROI adds the wealth-building components that cash-on-cash ignores. This is where rental property starts to outperform other investments — but also where the projections get speculative.
Component 1: Annual cash flow.
$2,100 (from above).
Component 2: Mortgage paydown (equity buildup).
In Year 1 of a 30-year loan at 7.1%, about $1,548 of your $12,996 in annual payments goes to principal. Your tenants are paying down your loan balance, building equity you own. To see the full amortization breakdown, run the numbers in our Rental Property Calculator.
Component 3: Property appreciation.
Memphis has averaged 3.8% annual appreciation over the past 5 years. On a $215,000 property: $215,000 x 0.038 = $8,170 in Year 1 value growth.
Total ROI calculation:
($2,100 + $1,548 + $8,170) / $62,125 = $11,818 / $62,125 = 19.02% total ROI.
Now we are talking. The same deal that looked like a 3.38% cash return is actually building wealth at 19% per year when you count everything. And I haven’t even included the depreciation tax benefit, which would add another 2-3 percentage points for most investors in the 24% tax bracket.
| Return Component | Annual Amount | % of Total Cash Invested |
|---|---|---|
| Cash Flow | $2,100 | 3.38% |
| Mortgage Paydown | $1,548 | 2.49% |
| Appreciation (3.8%) | $8,170 | 13.15% |
| Total ROI | $11,818 | 19.02% |
When total ROI is the right metric: When you are comparing rental property to stocks, bonds, or REITs as an asset class. Total ROI captures the full wealth-building engine of real estate: cash flow, equity, and appreciation working together. For an even deeper analysis that accounts for the time value of money, check our Real Estate IRR Calculator and the IRR guide that explains why timing changes everything.
The limitation: Appreciation is a guess. Memphis grew 3.8% last year, but it could be 1% next year or -2% in a recession. Total ROI projections are only as good as your appreciation assumption, and most investors use numbers that are too optimistic. The Bureau of Labor Statistics CPI data shows that real (inflation-adjusted) home price growth averages closer to 1-2% nationally over long periods.
Method 4: Equity ROI — Is Your Money Still Working?
Equity ROI = Annual Return / Current Equity x 100
This is the metric almost nobody tracks, but it is the one that tells you when to sell, refinance, or 1031-exchange. Equity ROI asks: given how much equity I have in this property TODAY, what return am I earning on that equity?
Think of it this way. You put $62,125 into this duplex. After 5 years, the property is worth $258,400 (at 3.8% annual growth), and your loan balance is $152,100. Your equity is now $106,300.
Year 5 cash flow (with 2% annual rent growth): approximately $4,620.
Year 5 mortgage paydown: approximately $2,180.
Year 5 appreciation: $258,400 x 0.038 = $9,819.
Total Year 5 return: $4,620 + $2,180 + $9,819 = $16,619.
Equity ROI: $16,619 / $106,300 = 15.63% equity ROI.
Compare that to Year 1 total ROI of 19.02%. Your equity ROI dropped because you now have $106,300 tied up instead of $62,125. The property is still profitable, but your equity is working less hard than it was.
At some point — usually around Year 7-10 for properties in mid-growth markets — the equity ROI drops below what you could earn by pulling that equity out through a cash-out refinance and redeploying it into a new deal. That is the signal to either refinance or sell via a 1031 exchange.
When equity ROI is the right metric: When you already own the property and are deciding whether to hold, sell, or refinance. It answers: “Would I put this much cash into this property if I were buying it today?” If the answer is no, it is time to recycle that equity.
The limitation: Equity ROI requires accurate current property valuation, which is harder to pin down than purchase price. A bad comp analysis can make equity ROI look better or worse than reality.
Side-by-Side: Same Deal, 4 Different Numbers
Here is the Memphis duplex analyzed through all four lenses. Same property, same numbers, completely different conclusions depending on which metric you read.
| ROI Method | Result | What It Measures | Financing Included? | Appreciation Included? |
|---|---|---|---|---|
| Cap Rate | 7.02% | Property-level income yield | No | No |
| Cash-on-Cash | 3.38% | Cash return on cash invested | Yes | No |
| Total ROI | 19.02% | All wealth-building channels | Yes | Yes |
| Equity ROI (Year 5) | 15.63% | Return on current equity | Yes | Yes |
Notice the spread: from 3.38% to 19.02% on the same property. A seller quoting “19% returns” is not lying — they are just using total ROI with an appreciation assumption. An investor saying “this deal barely beats a savings account” at 3.38% is also telling the truth — they are looking at cash-on-cash in a high-rate environment.
Neither is wrong. Both are incomplete without context.
Which ROI Metric to Use When
The right metric depends on what decision you are making. Here is the decision framework I use for my own portfolio:
| Your Situation | Best Metric | Why | Calculator to Use |
|---|---|---|---|
| Comparing 2+ properties to buy | Cap Rate | Removes financing variables so you compare buildings, not loan terms | Cap Rate Calculator |
| Need cash flow to cover living expenses | Cash-on-Cash | Shows actual money hitting your bank account this year | Cash-on-Cash Calculator |
| Comparing real estate vs. stocks/bonds | Total ROI | Captures all return channels so the comparison is fair | Rental Property Calculator |
| Deciding whether to sell or refinance | Equity ROI | Tells you if your trapped equity is underperforming | IRR Calculator |
| Evaluating a BRRRR deal | Cash-on-Cash + Equity ROI | CoC pre-refi, Equity ROI post-refi to track capital efficiency | Cash-on-Cash Calculator |
| Pitching a deal to a partner | All four | Shows you understand the full picture and are not cherry-picking | Rental Property Calculator |
My personal rule: I want at least 5% cash-on-cash in Year 1 and 15%+ total ROI using conservative appreciation (2% max in my projections, even if the market has been running higher). If a deal clears both bars, I dig deeper into the NOI with our NOI Calculator and stress-test vacancy with the Vacancy Rate Calculator.
5 ROI Calculation Mistakes That Cost Investors Money
Mistake 1: Using gross rent in ROI formulas
I see this constantly on BiggerPockets forums. Someone divides gross annual rent by purchase price and calls it their “ROI.” That is not ROI — that is the gross rent multiplier flipped upside down. It ignores vacancy, property taxes, insurance, management fees, maintenance, and the mortgage.
A $200,000 property renting for $2,000/month is not a “12% return.” After typical expenses, the actual cash-on-cash might be 4-5% and the NOI-based cap rate 7-8%. Always start from NOI, never gross rent.
Mistake 2: Forgetting closing costs and reserves in “cash invested”
Your total cash invested is not just the down payment. It includes closing costs (2-3% of price), any upfront repairs, and cash reserves your lender required. On our Memphis duplex, the down payment was $53,750, but total cash in was $62,125. That difference drops the cash-on-cash from 3.91% to 3.38%. Underestimate your cash basis and you overestimate your return.
Mistake 3: Using historical appreciation as a guaranteed return
Total ROI projections are only as reliable as your appreciation number. Memphis appreciated 3.8% last year. Some Sunbelt markets hit 8-10% during 2020-2022. Using peak numbers as your projection is like driving by looking in the rearview mirror.
I recommend running three scenarios: 0% appreciation (worst case), 2% (conservative), and the local historical average. If the deal only works at 4%+ appreciation, you are speculating, not investing.
Mistake 4: Comparing cap rate to stock market returns
Cap rate and S&P 500 returns are not apples to apples. Cap rate excludes leverage, appreciation, and tax benefits. The stock market return includes price appreciation and dividends reinvested. If you want to compare real estate to stocks, use total ROI or IRR — not cap rate.
Mistake 5: Ignoring equity ROI as your portfolio grows
The biggest missed opportunity I see is investors sitting on properties with $200,000+ in equity earning 6% equity ROI when they could do a cash-out refinance and redeploy that capital into two more properties at 15%+ total ROI. Track equity ROI annually on every property in your portfolio. When it drops below your target threshold (mine is 12%), start planning a move.
How ROI Changes Over Time
ROI is not static. Every component shifts as the years pass. Here is how our Memphis duplex looks over a 10-year hold, assuming 2% annual rent growth and 3% appreciation (I am using conservative numbers here, not the 3.8% actual).
| Year | Cash-on-Cash | Total ROI | Equity in Property | Equity ROI |
|---|---|---|---|---|
| 1 | 3.38% | 19.02% | $62,125 | 19.02% |
| 3 | 4.61% | 20.11% | $79,400 | 15.74% |
| 5 | 5.92% | 21.40% | $98,200 | 13.54% |
| 7 | 7.30% | 22.83% | $118,800 | 11.94% |
| 10 | 9.48% | 24.92% | $153,600 | 10.08% |
Look at the pattern. Cash-on-cash improves every year as rents grow while the fixed-rate mortgage stays the same. Total ROI climbs too. But equity ROI steadily drops because your equity position gets larger while the returns do not scale proportionally.
This is the hidden math of buy-and-hold investing. The property gets better for cash flow but worse for capital efficiency. Somewhere around Year 7-8, most investors should consider whether a refinance or 1031 exchange would put that accumulated equity to better use.
Cap Rate vs. Cash-on-Cash: The Most Confused Pair
New investors mix these up constantly. Both are annual percentages based on income, but they measure completely different things.
Cap rate uses NOI divided by property price. It tells you what the building earns as if you bought it with cash. Cash-on-cash uses after-debt cash flow divided by your actual cash outlay. It tells you what your personal investment earns after the bank takes its cut.
In a zero-interest-rate world, cap rate and cash-on-cash converge (if you put 100% down, they are the same). In a 7%+ rate world, they diverge sharply. Our duplex has a 7.02% cap rate but only a 3.38% cash-on-cash because the 7.1% mortgage consumes most of the NOI.
The rule of thumb: when your mortgage rate exceeds the cap rate, leverage hurts your cash-on-cash return. When the cap rate exceeds your mortgage rate, leverage amplifies it. At 7.1% mortgage and 7.02% cap rate, this deal is almost exactly at the breakeven point for leverage — which is why the cash-on-cash is so thin.
Run Your Own Numbers
I have walked through the math manually so you understand what is behind each formula. But for your actual deals, do not do this by hand. Input errors are the number one source of bad ROI projections.
Here are the calculators that match each method:
- Cap Rate ROI: Cap Rate Calculator — enter price and income, get instant cap rate with market comparisons
- Cash-on-Cash ROI: Cash-on-Cash Calculator — factors in your specific financing terms
- Total ROI: Rental Property Calculator — full analysis with cash flow, equity buildup, and appreciation projections
- Equity ROI & IRR: Real Estate IRR Calculator — time-weighted returns for hold vs. sell decisions
- NOI validation: NOI Calculator — make sure your income and expense inputs are correct before running any ROI formula
Start with the Rental Property Calculator for a full picture, then drill into individual metrics with the specialized tools.
Frequently Asked Questions
What is a good ROI on a rental property?
It depends on which ROI metric you are measuring. For cash-on-cash return, 5-8% is considered solid in 2026 markets with rates above 7%. For total ROI including appreciation, 12-18% is a reasonable target. Cap rates vary by market — 5-6% in expensive coastal cities, 7-9% in Midwest and Southern markets. There is no single “good” number because each metric answers a different question. Run your specific deal through our Rental Property Calculator to see where it lands.
How do you calculate ROI on a rental property with a mortgage?
Use the cash-on-cash formula: Annual Cash Flow / Total Cash Invested x 100. Start with your gross rent, subtract vacancy and operating expenses to get NOI, then subtract your annual mortgage payments. Divide that remaining cash flow by everything you put in — down payment, closing costs, and any upfront repairs. For a property with $2,100 in annual cash flow on $62,125 invested, the cash-on-cash return is 3.38%. The Cash-on-Cash Calculator handles the full amortization math automatically.
Is cap rate the same as ROI?
No. Cap rate is one type of ROI measurement, but it is not your personal return on investment. Cap rate assumes you paid all cash (no mortgage) and excludes appreciation and tax benefits. It measures the property’s income yield at its price point. Your actual ROI as a leveraged investor depends on your financing — that is what cash-on-cash and total ROI measure. Two investors buying the same property at the same cap rate will have different personal returns if one puts 20% down and the other puts 30% down.
What is the difference between ROI and IRR on rental property?
ROI gives you a simple annual percentage — your return for a single year or averaged over a hold period. IRR (internal rate of return) factors in the timing of every cash flow: when you invested, when you received income, and when you sold. A property that loses money for 2 years then profits for 8 years has a very different IRR than one that profits evenly all 10 years, even if the total ROI averages the same. Use ROI for quick deal screening and IRR for hold-period optimization. See our IRR guide for a full comparison.
Should I include property appreciation when calculating rental ROI?
Include it in total ROI for long-term wealth analysis, but never rely on it for cash flow decisions. Appreciation is speculative — you only realize it when you sell or refinance. I always run two projections: one with 0% appreciation (can I survive on cash flow alone?) and one with conservative 2-3% growth (what is my total wealth-building rate?). If a deal requires appreciation to make financial sense, you are speculating on price growth rather than investing in income. Cash flow is guaranteed monthly; appreciation is not.
The Bottom Line
Rental property ROI is not one number. It is four numbers that each tell you something different about the same deal. Our Memphis duplex showed 7.02% cap rate, 3.38% cash-on-cash, 19.02% total ROI, and declining equity ROI over time. Every single figure was accurate. None told the full story by itself.
The investors who make money in real estate are the ones who understand all four metrics and know which one to apply to their specific decision. Buying? Lead with cap rate. Budgeting cash flow? Trust cash-on-cash. Comparing to stocks? Use total ROI. Reviewing your portfolio? Track equity ROI.
Run your next deal through all four methods using our Rental Property Calculator. If you are not sure which metric matters most for your situation, start with cash-on-cash — it is the hardest number to argue with because it measures real dollars in your bank account, not projections about the future.
Leave a Reply