Last updated: September 24, 2026 · Originally published: August 15, 2026 · By Alex Petrov
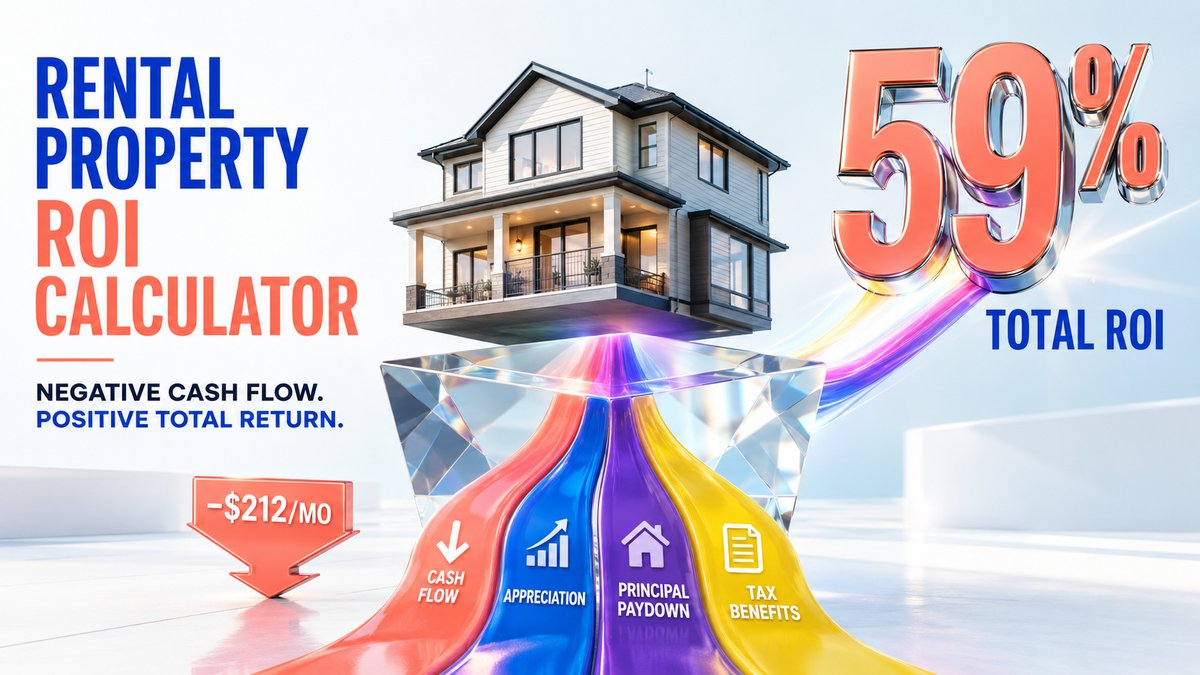
The rental property ROI calculator shows you the total return on a rental investment — not just cash flow, but appreciation, principal paydown, and tax benefits combined. A property with negative monthly cash flow can still deliver 59% ROI over 5 years when you account for equity growth. This calculator reveals whether a deal builds wealth or drains it.
Why Cash Flow Alone Is Misleading
Most investors screen deals on monthly cash flow. A property that loses $200/month gets rejected. But that same property might appreciate $28,000 over 5 years and pay down $8,400 in mortgage principal — returning 59% on your invested capital. Cash flow is one piece of a four-part return:
- Cash flow — net rent after all expenses and mortgage
- Appreciation — property value increase over the hold period
- Principal paydown — equity built as tenants pay down your mortgage
- Tax benefits — depreciation deductions that reduce taxable income
The rental property ROI calculator combines all four into a single total return number. Use it alongside the cash-on-cash calculator (which measures cash flow only) and the cap rate calculator (which measures property-level income yield).
How to Use the Rental Property ROI Calculator
Mode 1: Standard — Calculate Total ROI
Step 1 — Purchase details. Enter purchase price, down payment percentage, interest rate, and loan term. The calculator computes your monthly mortgage payment and total cash invested (down payment + closing costs).
Step 2 — Income. Monthly rent, other income, vacancy rate. The calculator computes Effective Gross Income.
Step 3 — Expenses. Property tax, insurance, maintenance, property management, CapEx reserves. The calculator computes NOI and annual cash flow.
Step 4 — Appreciation assumptions. Annual appreciation rate (typically 2–4% for most markets), hold period in years (5, 10, or 20). The calculator projects future property value and equity from price growth.
Step 5 — Read results. The ROI calculator shows: total cash flow over the hold, total appreciation, total principal paydown, total return in dollars, ROI percentage, and annualized ROI. It also shows year-by-year breakdown so you can see when the deal turns profitable.
Mode 2: Reverse — Find Required Appreciation
You know the cash flow is thin. What appreciation rate makes this deal worth holding? Enter all inputs and your target total ROI. The calculator tells you the minimum annual appreciation needed. If it says 5% but the market grows at 3%, the deal does not meet your target.
Mode 3: Reverse — Find Maximum Purchase Price
You have a target total ROI and know the market’s appreciation rate. What is the most you should pay? This mode combines cash flow and equity growth to find your ceiling price — more useful than cash-flow-only analysis for appreciation markets like Austin or Atlanta.
Worked Example 1: Memphis SFR — 5-Year Hold
Property: 3-bed/2-bath SFR in Memphis suburbs
Purchase: $180,000 · Down: 20% ($36,000) · Rate: 7.0%, 30yr
Rent: $1,400/month · Appreciation: 3%/year · Hold: 5 years
Annual Cash Flow
Gross rent: $1,400 × 12 = $16,800
Vacancy (7%): −$1,176
EGI: $15,624

Expenses:
 Property tax (1.2%): $2,160
 Insurance: $1,600
 Maintenance (8%): $1,344
 PM (10%): $1,562
Total expenses: $6,666

NOI: $8,958
Debt service: $958/mo × 12 = $11,497
Annual cash flow: −$2,539
Cash flow: −$2,539/year (−$212/month). Most investors stop here and walk away. But let’s look at the full picture.
5-Year Total Return
| Return Component | 5-Year Total | Notes |
|---|---|---|
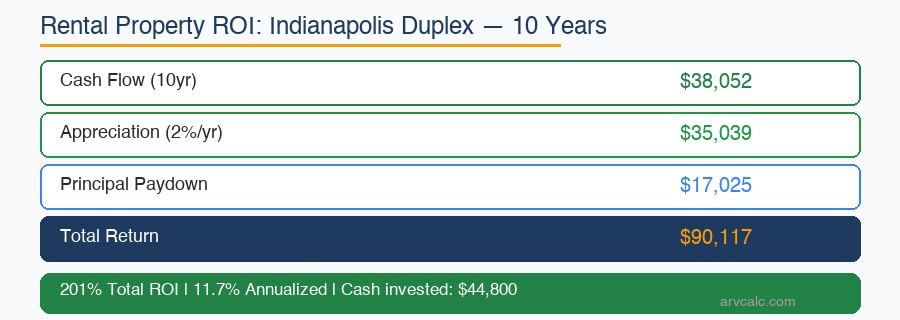
| Cash Flow | −$12,694 | Negative — you subsidize $212/mo for 5 years |
| Appreciation (3%/yr) | +$28,669 | $180K → $209K after 5 years |
| Principal Paydown | +$8,451 | Tenants paid down your mortgage |
| Total Return | $24,426 | |
| Total Cash Invested | $41,400 | $36K down + $5.4K closing |
| Total ROI | 59% | 9.7% annualized |
Result: 59% total ROI (9.7% annualized) despite negative cash flow. The $212/month cash drain totals $12,694 over 5 years — but appreciation and paydown generate $37,120 in equity. Net: you invested $41,400 and earned $24,426 in total return. That beats most stock market returns.
This is why the rental property ROI calculator matters. The cash-on-cash calculator would show −6.1% and reject this deal. The ROI calculator reveals it is actually a strong investment if appreciation holds at 3%.
The risk: if appreciation is 0% instead of 3%, total return drops to −$4,243 (−10% ROI). Always run the calculator at multiple appreciation rates. For Memphis market data, see the cap rate by state guide.
Worked Example 2: Indianapolis Duplex — 10-Year Hold
Property: Duplex in Indianapolis east side
Purchase: $160,000 · Down: 25% ($40,000) · Rate: 7.0%, 30yr
Rent: $900/unit × 2 = $1,800/month · Appreciation: 2%/year · Hold: 10 years
Annual Cash Flow
Gross rent: $21,600
Vacancy (6%): −$1,296
EGI: $20,304

Expenses: tax $1,760 + ins $1,400 + maint $1,728 + PM $2,030 = $6,918
NOI: $13,386
Debt service: $798/mo × 12 = $9,581

Annual cash flow: $3,805 ($317/month)
10-Year Total Return
| Return Component | 10-Year Total |
|---|---|
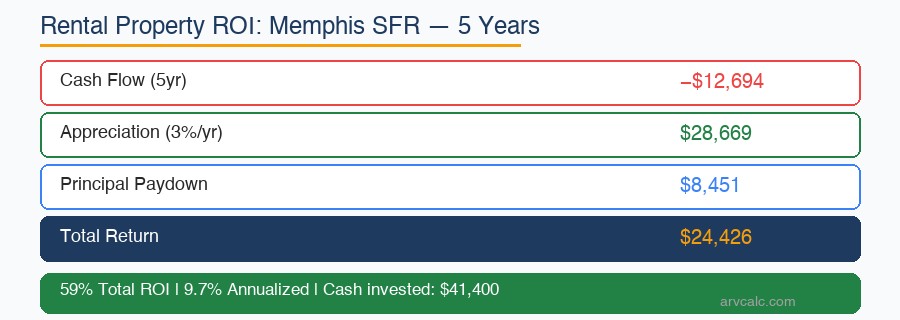
| Cash Flow | +$38,052 |
| Appreciation (2%/yr) | +$35,039 |
| Principal Paydown | +$17,025 |
| Total Return | $90,117 |
| Total Cash Invested | $44,800 |
| Total ROI | 201% (11.7% annualized) |
Result: 201% total ROI (11.7% annualized). All three return components are positive. Cash flow alone returns $38K — nearly your entire down payment — while appreciation and paydown add another $52K. After 10 years, you have $90K in total return on $44,800 invested, plus a property worth $195K with $137K remaining mortgage = $58K equity.
This is the power of a cash-flow-positive deal with long hold. Compare both examples in the rental property ROI calculator. For cash flow analysis, use the property cash flow calculator.
What Counts as a Good Total ROI
| Annualized ROI | Rating | Context |
|---|---|---|
| >15% | Excellent | Value-add or high-growth market with positive cash flow |
| 10–15% | Good | Solid buy-and-hold with moderate appreciation |
| 7–10% | Average | Comparable to stock market long-term average |
| 4–7% | Below Average | Thin returns — consider whether the effort is worth it |
| <4% | Poor | Underperforming a bond portfolio with zero effort |
The S&P 500 has historically returned ~10% annually. Real estate ROI above 10% beats the stock market while also providing tax benefits (depreciation) and leverage. Below 7%, you should question whether active property management justifies the return vs passive index investing. Calculate your deal in the rental property ROI calculator.
ROI vs Cash-on-Cash vs Cap Rate vs IRR
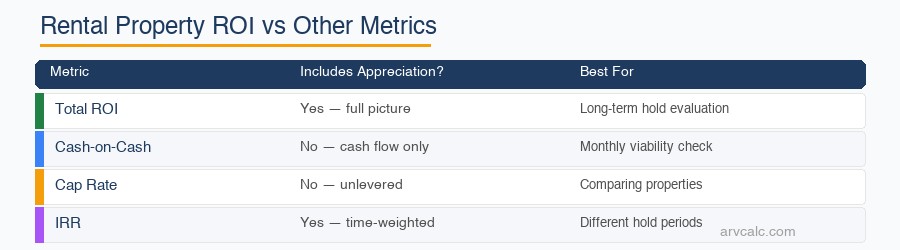
| Metric | What It Measures | Includes Appreciation? | Best For |
|---|---|---|---|
| Total ROI | All return components combined | Yes | Long-term hold evaluation |
| Cash-on-Cash | Annual cash yield on cash invested | No | Comparing leveraged cash flow deals |
| Cap Rate | Property income yield (unlevered) | No | Comparing properties across markets |
| IRR | Time-weighted total return | Yes | Comparing deals with different hold periods |
Use total ROI to evaluate whether a deal is worth holding long-term. Use cash-on-cash (calculator) for monthly cash flow viability. Use cap rate (calculator) to compare properties. Use IRR (calculator) to compare deals with different timelines. For a complete analysis framework, read how to analyze rental property.
The Appreciation Risk
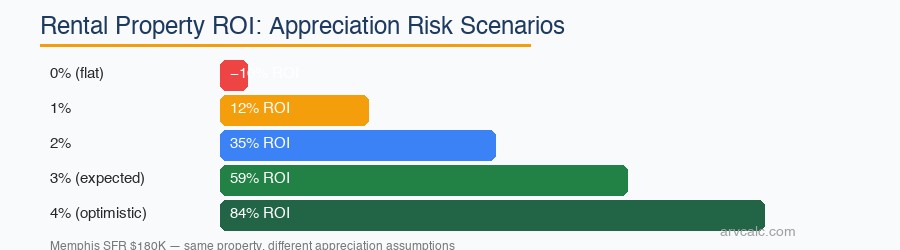
Total ROI is highly sensitive to appreciation assumptions. The Memphis example shows:
| Appreciation Rate | 5-Year Appreciation | Total ROI | Annualized |
|---|---|---|---|
| 0% (flat) | $0 | −10% | −2.1% |
| 1% | $9,180 | 12% | 2.3% |
| 2% | $18,729 | 35% | 6.2% |
| 3% | $28,669 | 59% | 9.7% |
| 4% | $39,015 | 84% | 13.0% |
At 0% appreciation, the Memphis deal loses money. At 4%, it is excellent. This sensitivity is why the ROI calculator lets you adjust appreciation rate — always run best case, expected case, and worst case. For market-specific appreciation data, check FRED median home price data and NAR market statistics. For housing price trends, see NAR housing statistics.
5 Common ROI Mistakes
1. Using Gross ROI Instead of Net
Why: Gross ROI ignores selling costs. When you sell a $209K property, you pay 6–8% in agent commissions and closing costs ($12,500–$16,700). That wipes out half the appreciation gain.
Fix: Always deduct selling costs from your exit value. The ROI calculator includes a selling cost field.
2. Assuming Constant Appreciation
Why: Markets cycle. A property that appreciates 5% for 3 years might depreciate 3% in year 4. Using a straight-line assumption overstates returns in the short term.
Fix: Use conservative appreciation (2–3%) for baseline. Run the calculator at 0% to see your downside. If the deal only works with 4%+ appreciation, it is speculation, not investment.
3. Ignoring Principal Paydown
Why: Investors focused on cash flow forget that every mortgage payment builds equity. On a $144K loan at 7%, tenants pay down $8,451 in 5 years — that is real return you can access via refinance or sale.
Fix: Include paydown in your ROI calculation. The rental property ROI calculator computes this automatically.
4. Comparing ROI Across Different Hold Periods
Why: 59% ROI over 5 years and 201% ROI over 10 years look very different, but the annualized rates (9.7% vs 11.7%) are closer. Raw ROI without annualization makes longer holds look artificially better.
Fix: Always compare annualized ROI, not total ROI. Or use IRR which automatically adjusts for time.
5. Not Including Tax Benefits
Why: Residential rental property depreciates over 27.5 years. On a $180K property with $30K land value, that is $5,455/year in paper losses that offset your rental income. At a 24% tax bracket, that saves $1,309/year in taxes.
Fix: Factor depreciation into your total return. Use the depreciation calculator to estimate your annual deduction. Read the depreciation guide for details.
Frequently Asked Questions
What is a good ROI for a rental property?
Total annualized ROI above 10% is considered good — it beats the stock market’s long-term average. Above 15% is excellent, typically achieved through value-add strategies or strong appreciation markets. Below 7% is marginal and may not justify the effort of active property management. Use the rental property ROI calculator to check any deal.
How is rental property ROI different from cash-on-cash return?
Does rental property ROI include appreciation?
What appreciation rate should I use in the ROI calculator?
Should I invest in a rental property with negative cash flow but high ROI?
How does leverage affect rental property ROI?
What is the difference between ROI and IRR for rental property?
Related Calculators and Guides
- Rental Property ROI Calculator — Total return with appreciation + paydown
- Cash-on-Cash Calculator — Annual cash yield
- Cap Rate Calculator — Unlevered property yield
- IRR Calculator — Time-weighted total return
- NOI Calculator — Operating income breakdown
- Property Cash Flow Calculator — Monthly projections
- Depreciation Calculator — Tax benefit calculation
- Rental Property Calculator — Full deal analysis
- Mortgage Calculator — Payment scenarios
- All 30+ Calculators
Blog guides:
Leave a Reply