Last updated: October 9, 2026 · Originally published: October 7, 2026 · By Alex Petrov
I get this question at least once a week: “What is a good cash on cash return?” And my answer is always the same — it depends. It depends on your strategy, the market you buy in, the interest rate on your loan, and what you are trying to accomplish with the property. But “it depends” is not helpful when you are staring at a deal and need a quick yes-or-no answer. So here are the real benchmarks I use when I analyze deals in 2026, along with the context that makes those numbers mean something.
A quick note before we go further: if you want to run your own numbers right now, open the cash-on-cash calculator and plug in your deal. Everything I talk about below — you can verify in 30 seconds with that tool.
Cash-on-Cash Return: The 30-Second Refresher
Cash-on-cash return measures how much cash income you earn relative to how much cash you invested. The formula:
Cash-on-Cash Return = Annual Pre-Tax Cash Flow / Total Cash Invested x 100
Say you put $60,000 into a rental (down payment, closing costs, initial repairs) and it generates $4,800/year in net cash flow after mortgage, taxes, insurance, management, maintenance, and vacancy. Your cash-on-cash return is $4,800 / $60,000 = 8.0%.
This metric only measures the cash yield — the money that hits your bank account each month. It ignores appreciation, principal paydown, and tax benefits. That is both its strength and its limitation. For a full picture of total returns, see the ROI comparison guide which covers four different return metrics side by side.
Cash-on-cash is a “first filter” metric. If a deal does not meet your CoC threshold, you move on. If it does, you dig deeper into net operating income, DSCR, and total return projections.
What Is a Good Cash on Cash Return in 2026?
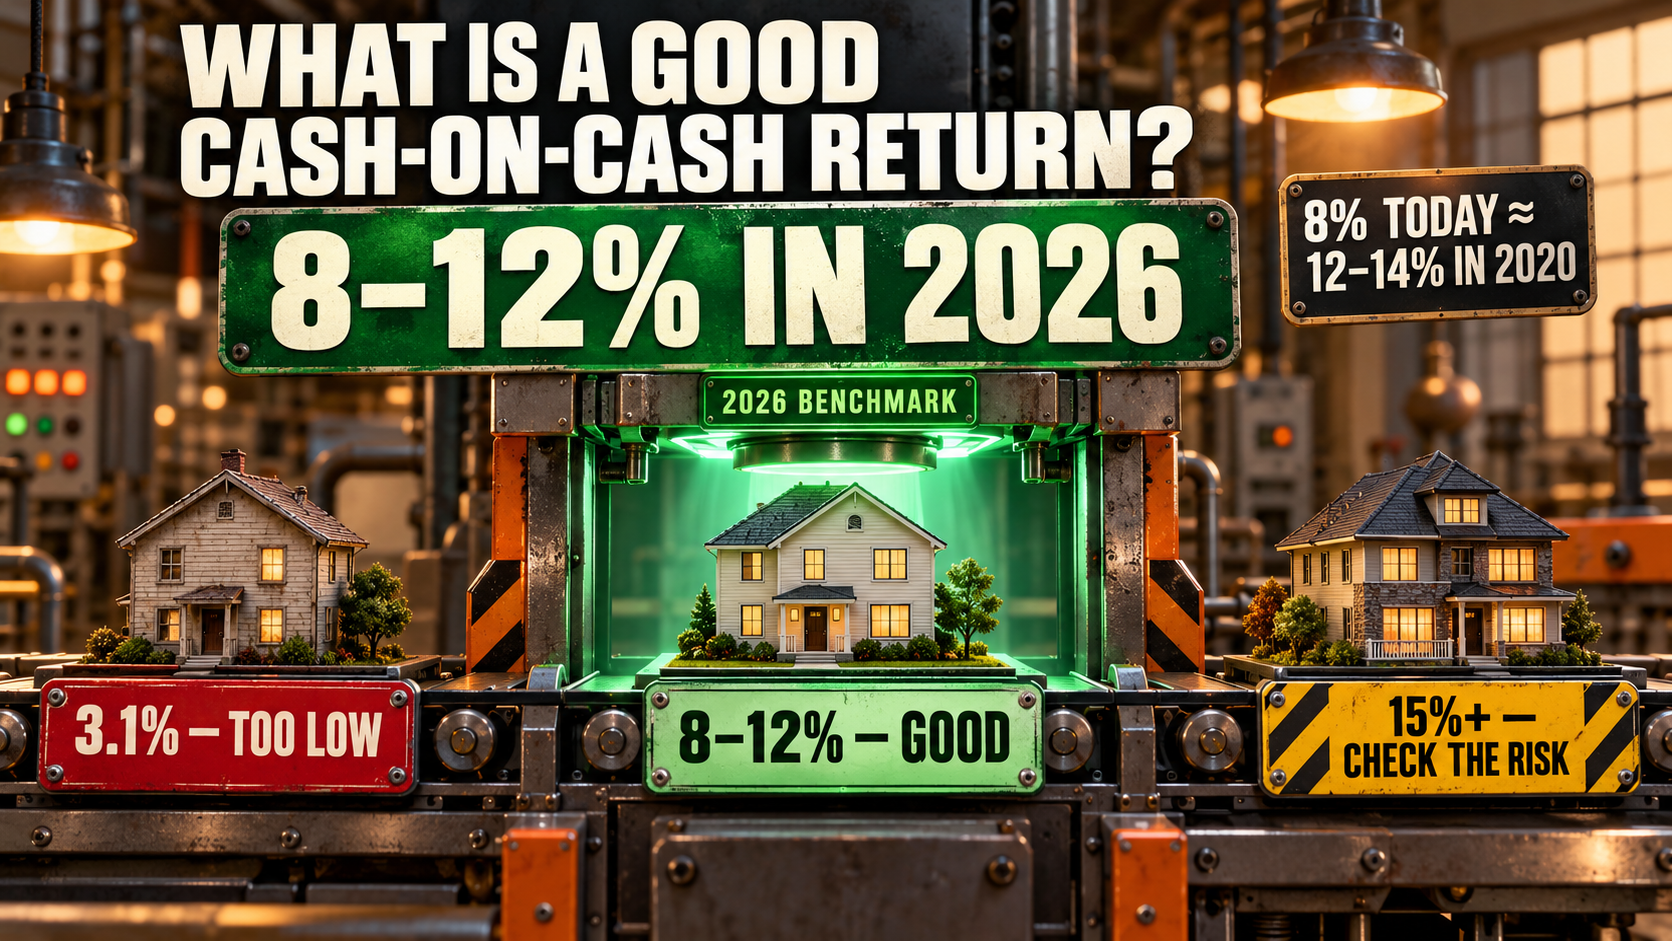
Here is the short answer: 8-12% is considered a good cash on cash return for a standard buy-and-hold rental property in 2026. That range assumes conventional financing at 6.5-7.0%, 25% down, and typical operating expenses.
But that single number is almost useless without context. An 8% CoC in San Diego means something very different than 8% in Memphis. And an 8% CoC on a BRRRR deal where you recovered all your cash is technically infinite — so the metric breaks down entirely.
Here is how I actually think about “good” returns:
| Rating | Cash-on-Cash Range | What It Means |
|---|---|---|
| Excellent | 12%+ | Top-tier deal. Rare in 2026 without value-add or off-market pricing. Verify the numbers twice. |
| Good | 8–12% | Strong deal by current standards. Achievable in Midwest and Southeast markets with disciplined buying. |
| Acceptable | 5–8% | Average for many markets. Worth doing if appreciation upside or equity build is strong. |
| Below Average | 2–5% | Marginal. Only makes sense in appreciation markets where you expect 5%+ annual price growth. |
| Poor / Negative | Below 2% | You are paying to own. Negative cash flow means you subsidize the investment from your W-2. |
Run your specific deal through the cash-on-cash calculator to see exactly where it falls on this scale.
Cash-on-Cash Benchmarks by Investment Strategy
The “good” number shifts dramatically depending on your strategy. A house hacker and a BRRRR investor should not be measuring themselves against the same bar. Here is what I target for each strategy in the current rate environment:
| Strategy | Good CoC Target | Typical Range (2026) | Why It Differs |
|---|---|---|---|
| Buy-and-Hold (Turnkey) | 8–12% | 3–10% | Standard rental. No sweat equity. Returns depend entirely on market and purchase price. |
| BRRRR | 15–25%+ (or infinite) | 12–infinite | If refinance recovers all cash, CoC is infinite. The metric measures cash-out efficiency. |
| House Hack | 0–5% (on total cost) | -5% to 10% | You live there. Even 0% CoC beats paying full rent/mortgage from your pocket. |
| Value-Add | 10–15% | 8–18% | Forced appreciation plus higher rents after rehab push CoC above market rate. |
| Short-Term Rental (Airbnb) | 12–20% | 5–25% | Higher revenue but higher expenses and management intensity. Wide variance by location. |
| Section 8 / Affordable | 8–14% | 6–15% | Guaranteed rent with vouchers. Lower vacancy but potentially higher maintenance. |
The biggest takeaway from this table: strategy determines the benchmark. A 6% CoC on a turnkey rental in Charlotte is below average. A 6% CoC on a house hack where you eliminated your housing payment is excellent — because you also save $1,500/month in rent you would have paid elsewhere.
If you are running a BRRRR, the BRRRR calculator will show you the cash-on-cash both before and after refinance, which matters more than the post-refi number alone.
Cash-on-Cash Benchmarks by Market Tier
Market class matters as much as strategy. A Class A property in a gateway city and a Class C duplex in a small Midwest town are different investments with different risk profiles and different return expectations.
| Market Tier | Examples | Typical CoC (2026) | Good CoC Target | Trade-Off |
|---|---|---|---|---|
| Gateway / Class A | San Francisco, NYC, LA, Seattle | -3% to 1% | 2%+ is rare and good | Appreciation play. Cash flow almost never positive at current rates. |
| Sun Belt / Class A-B | Austin, Nashville, Tampa, Raleigh | 0% to 4% | 4–6% | Population growth + appreciation. Cash flow thin but improving as rents catch up to prices. |
| Secondary / Class B | Chattanooga, Clarksville, Huntsville, Boise | 3% to 7% | 7–10% | Balanced. Some appreciation, reasonable cash flow. Sweet spot for many investors. |
| Midwest / Class B-C | Cleveland, Indianapolis, Memphis, Fort Wayne | 4% to 9% | 8–12% | Cash flow market. Lower appreciation but income-producing from day one. |
| Rural / Class C-D | Small towns, tertiary markets | 8% to 15%+ | 12%+ | High yield on paper. Higher vacancy, harder to manage, limited tenant pool, lower liquidity. |
Notice the inverse relationship: the markets with the highest cash-on-cash returns tend to have the lowest appreciation and the most management headaches. And the markets with the best appreciation produce the worst cash flow. This is not a coincidence — it is the market pricing risk and growth potential.
For a deeper look at which cities produce the best returns right now, see the best cities to invest in real estate in 2026.
Why 8% Today Is Better Than 12% in 2020
I talk to investors who say, “I only buy deals that produce 12% cash-on-cash.” And when I ask them when they last bought something, they say 2019 or 2020. They have not bought a property in six years because their benchmark did not adjust with the rate environment.
Here is the math that explains why:
In 2020, the 30-year fixed mortgage rate averaged 3.11% (FRED, 30-Year Fixed Rate Mortgage Average). In September 2026, it sits around 6.6%. On a $200,000 loan, that difference looks like this:
| Factor | 2020 (3.1% Rate) | 2026 (6.6% Rate) | Difference |
|---|---|---|---|
| Monthly P&I on $200K loan | $856 | $1,279 | +$423/mo |
| Annual P&I | $10,272 | $15,348 | +$5,076/yr |
| Cash flow impact (same rent) | — | $5,076 less cash flow | — |
| CoC impact (same $65K invested) | — | ~7.8% lower CoC | — |
That $423/month difference in mortgage payment translates directly into lower cash-on-cash return. If a deal that produced 12% CoC in 2020 exists in the same market with the same rent and price today, it now produces roughly 4-5% CoC. The property did not get worse. The financing got more expensive.
This is the single most important context for evaluating CoC in 2026: an 8% cash-on-cash return today represents equivalent deal quality to a 12-14% return in 2020. The hurdle rate must adjust with interest rates, or you will never buy anything.
The U.S. Census Bureau new residential sales data shows construction starts still lag behind household formation, which means rents will continue to rise and cash flow metrics will gradually recover — but not to 2020 levels until rates drop below 5%.
I wrote a deeper analysis of this dynamic in the cash flow vs. appreciation article if you want to understand the full picture of returns beyond cash-on-cash alone.
Worked Example 1: A Good Deal (8.7% CoC)
Let me walk through a real deal structure I would consider “good” in the current market. This is a Class B duplex in Indianapolis.
Property: Duplex, Indianapolis (Class B neighborhood)
Purchase Price: $225,000
Monthly Rent: $1,100/unit x 2 = $2,200/mo total

Cash Invested:
  Down Payment (25%):       $56,250
  Closing Costs (3%):        $6,750
  Minor Repairs:              $3,000
  Total Cash In:             $66,000

Annual Income & Expenses:
  Gross Rent:                $26,400
  Vacancy (6%):              -$1,584
  Property Tax:              -$2,700
  Insurance:                 -$1,980
  Management (8%):           -$1,985
  Maintenance (8%):          -$1,985
  CapEx Reserve (5%):        -$1,241
  Effective Gross Income:    $14,925  (NOI)
  Mortgage P&I ($168,750 @ 6.75%, 30yr): -$9,190
  Annual Cash Flow:          $5,735

Cash-on-Cash Return: $5,735 / $66,000 = 8.7%
This deal works because: (1) the rent-to-price ratio is 0.98%, which is above the threshold for positive cash flow at current rates, (2) it is a duplex so expenses per unit are lower, and (3) Indianapolis property taxes are moderate compared to Illinois or New Jersey.
The cap rate on this deal is 6.6% ($14,925 NOI / $225,000), which is healthy for a Class B market. And the DSCR is 1.62, well above the 1.25 minimum most lenders want to see.
Plug your own numbers into the cash-on-cash calculator to see if your deal beats this benchmark.
Worked Example 2: A Mediocre Deal (3.1% CoC)
Now compare with a deal that looks fine on paper but produces a mediocre return. This is a single-family rental in Raleigh, NC.
Property: SFR, Raleigh (Class A- neighborhood)
Purchase Price: $365,000
Monthly Rent: $2,100/mo

Cash Invested:
  Down Payment (25%):       $91,250
  Closing Costs (3%):       $10,950
  Total Cash In:            $102,200

Annual Income & Expenses:
  Gross Rent:                $25,200
  Vacancy (5%):              -$1,260
  Property Tax:              -$3,285
  Insurance:                 -$2,555
  Management (9%):           -$2,155
  Maintenance (7%):          -$1,676
  CapEx Reserve (5%):        -$1,197
  NOI:                       $13,072
  Mortgage P&I ($273,750 @ 6.75%, 30yr): -$9,884
  Annual Cash Flow:          $3,188

Cash-on-Cash Return: $3,188 / $102,200 = 3.1%
This Raleigh deal is not terrible. 3.1% is above zero, and the property sits in a market with strong population growth and 4-5% annual appreciation. But strictly on a cash-on-cash basis, your $102K is earning less than a high-yield savings account (currently 4.5-5.0% APY with zero risk).
The question becomes: do you believe the appreciation and equity buildup will make the total return worth tying up $102K for a 3.1% cash yield? That is a strategic question, not a math question. See the IRR guide for how to model total return over a hold period.
Red Flags: When High Cash-on-Cash Means High Risk
A high cash-on-cash return is not always a good thing. In fact, some of the worst deals I have seen advertised “15-20% CoC” returns. Here is what to watch for:
1. Unrealistic Vacancy Assumptions
If the seller’s pro forma uses 3% vacancy in a market where NAR data shows 8-10% vacancy, the CoC is inflated. Always run your own vacancy estimate. In most markets, 5-8% vacancy is realistic for a well-located property. In Class C/D areas, budget 10-12%.
2. Deferred Maintenance Hiding Behind Low CapEx
A property with a 25-year-old roof, original HVAC, and galvanized plumbing will need $30,000+ in capital expenditures within the first few years. If the seller’s analysis shows $500/year in CapEx, the CoC return is a fantasy. I budget 5-8% of gross rent for CapEx depending on the property age and condition.
3. Class D Neighborhoods With “Amazing” Returns
A $60,000 house renting for $900/month looks like a 14% CoC return on paper. In reality, you face higher vacancy (tenants leave more often), higher eviction costs, more property damage between tenants, higher insurance premiums, and difficulty finding quality property management. The actual realized return after all that friction is often 4-6%, not 14%. I have seen new investors lose money on “high-yield” Class D properties because the spreadsheet ignored real-world costs.
4. Short-Term Rental Projections Based on Peak Season
An Airbnb listing that grosses $4,000/month in July does not gross $4,000/month in February. Annualizing peak-season revenue produces an inflated CoC. Use actual trailing 12-month revenue data (AirDNA, PriceLabs, or the host’s tax returns) to calculate true annual cash flow.
5. Seller Financing With a Balloon Payment
Seller financing at 4% interest with 10% down looks like a CoC dream — until the 5-year balloon comes due and you need to refinance at 7% or come up with $180,000 in cash. That “18% CoC” was temporary, and the refinance kills it. Always model the post-balloon economics.
6. Ignoring Property Management Costs
Self-managing saves 8-10% of gross rent, which can add 3-5% to your CoC return. But self-management is not free — it costs your time, your availability, and your sanity. If you would not work for $15/hour (the effective rate of self-managing one property), do not count the “savings” as real return. I always include management fees in my analysis even when I self-manage, so I know what the deal produces on its own merits.
The bottom line: if a deal promises more than 12% CoC in the current rate environment without a value-add component, investigate hard before committing. Either you found a genuinely mispriced asset (rare), or the numbers are wrong (common).
How Interest Rates Change the “Good” Benchmark
Cash-on-cash return is more sensitive to interest rates than any other factor. Here is how the same property performs at different rate levels:
| Mortgage Rate | Monthly P&I ($168,750 loan) | Annual Cash Flow | Cash-on-Cash Return |
|---|---|---|---|
| 4.0% | $806 | $10,453 | 15.8% |
| 5.0% | $906 | $9,253 | 14.0% |
| 6.0% | $1,012 | $7,981 | 12.1% |
| 6.75% (current) | $1,095 | $6,985 | 10.6% |
| 7.5% | $1,180 | $5,965 | 9.0% |
| 8.0% | $1,238 | $5,269 | 8.0% |
Using the Indianapolis duplex from the earlier example (but isolating the rate variable), every 1% increase in mortgage rate drops cash-on-cash by roughly 2 percentage points. This is why the “good” benchmark moved from 12% in 2020 to 8% in 2026 — same deal quality, different financing cost.
If rates drop to 5.5% (which some forecasters expect by late 2027), the same deals producing 8% today would produce 11-12% — and the market would reprice properties upward. Investors who buy at 8% CoC today and refinance later at a lower rate get a double benefit: higher cash flow AND higher property value.
Track your deal’s sensitivity to rate changes using the rental property calculator, which includes a sensitivity table for different rate scenarios.
Cash-on-Cash vs. Other Return Metrics
Cash-on-cash is one number in a dashboard of metrics. Here is how it compares and when to use each:
| Metric | What It Measures | When to Use It | Calculator |
|---|---|---|---|
| Cash-on-Cash | Annual cash yield on invested capital | First filter — does the deal pay you? | CoC Calculator |
| Cap Rate | Property’s income yield (no financing) | Comparing properties across markets | Cap Rate Calculator |
| NOI | Operating income before debt service | Evaluating property operations | NOI Calculator |
| DSCR | Cash flow coverage of debt payments | Loan qualification and risk assessment | DSCR Calculator |
| IRR | Total return including all sources | Comparing deals over different hold periods | IRR Guide |
I never make a buy decision on cash-on-cash alone. A deal with 6% CoC but 5% annual appreciation and strong principal paydown may outperform a 10% CoC deal in a flat market over a 10-year hold. Use the ROI comparison framework to evaluate total return.
How to Improve Cash-on-Cash Return on a Deal
If you found a property you like but the CoC is below your target, here are the levers you can pull — ranked by impact:
1. Negotiate a Lower Purchase Price
Every $10,000 reduction in purchase price on a $200K property improves CoC by roughly 0.8-1.0%. This is the most direct lever. Ask for seller concessions, credits for deferred maintenance, or simply offer less.
2. Add a Bedroom or ADU
Converting a den, bonus room, or garage into a legal bedroom can increase rent by $200-400/month. Adding an ADU (accessory dwelling unit) in states like California, Oregon, or Texas creates a second income stream from the same property. This is the value-add strategy that turns 5% CoC into 10%+.
3. Reduce Down Payment (If DSCR Allows)
Going from 25% down to 20% down frees up cash, which increases CoC — but also increases your mortgage payment. The net effect depends on the spread between rent yield and mortgage rate. Run both scenarios in the cash-on-cash calculator to see which structure wins.
4. House Hack
Buying a duplex, living in one unit, and renting the other lets you use FHA (3.5% down) or conventional owner-occupant (5-10% down) financing. The lower down payment and lower rate dramatically improve CoC — often producing infinite CoC because your total housing cost drops below what you were paying in rent.
5. Self-Manage (Short-Term)
Eliminating the 8-10% management fee adds $1,500-3,000/year to cash flow on a typical rental. This alone can move a deal from 5% to 8% CoC. Just plan to hand off management once you own 3+ properties, or you will hit a ceiling on your time.
6. Refinance When Rates Drop
If you buy at 6.75% and refinance at 5.5% in two years, your monthly payment drops by $100-200 on a $200K loan. That alone can push CoC up by 1.5-3 percentage points. This is the “marry the house, date the rate” strategy that many investors are banking on.
The “Good Enough” Framework
After analyzing hundreds of deals, here is the framework I use to decide if a CoC return is “good enough” to move forward:
Step 1: Does it beat a high-yield savings account? In 2026, HYSA rates are 4.5-5.0%. If your CoC is below 5%, you need a very strong appreciation thesis to justify the risk, illiquidity, and management headaches of owning real estate.
Step 2: Does it meet the strategy-specific benchmark? Use the strategy table above. A 7% CoC on a turnkey is acceptable. A 7% CoC on a BRRRR means something went wrong with the rehab or refinance.
Step 3: What does the total return look like? Add principal paydown (~1.5-2% in year 1), expected appreciation (2-5% depending on market), and tax benefits (depreciation sheltering some or all cash flow). A 6% CoC deal in a 4% appreciation market produces roughly 12-14% total return — which beats the stock market’s historical average.
Step 4: Is the CoC sustainable? Can rents keep pace with expense inflation? Is the tenant base stable? Are there upcoming capital expenses that will eat into cash flow? A deal that shows 10% CoC today but needs a $15,000 roof next year is really a 5% deal when you amortize that cost.
For a full deal analysis workflow, see the average CoC return by market article which includes city-level benchmarks to compare your specific deal against.
What the Professionals Target
Institutional investors (REITs, private equity funds, family offices) typically target 6-8% unlevered yields (cap rates) on stabilized multifamily. With leverage, they aim for 8-12% levered cash-on-cash, which is the same range individual investors target.
The difference: institutions buy at scale, which gives them lower per-unit management costs, better insurance rates, and access to cheaper debt. A deal that produces 7% CoC for an individual investor might produce 9% for an institution running 500 units with in-house management.
This is relevant because institutional competition has compressed cap rates in many Sun Belt markets, pushing individual investor CoC returns lower. If you are competing with Blackstone for a 200-unit apartment complex in Phoenix, you are not going to hit 10% CoC. But if you are buying a $180K duplex in Fort Wayne that is too small for institutions to bother with, the competition is lighter and returns are better.
Frequently Asked Questions
What is a good cash on cash return for a rental property?
A good cash on cash return for a rental property in 2026 is 8-12% for buy-and-hold investments with conventional financing. This range accounts for mortgage rates around 6.5-7.0%. In 2020 when rates were 3%, the same deal quality produced 12-15% — so the “good” benchmark has shifted downward. Anything above 8% is solid by current standards. Below 5%, you should question whether the deal justifies the effort over a risk-free savings account earning 4.5-5%.
Is 5% cash-on-cash return acceptable?
A 5% cash-on-cash return is acceptable in appreciation markets (Sun Belt, Class A/B neighborhoods) where you expect 3-5% annual property value growth on top of the cash yield. In a pure cash flow market (Midwest, Class C), 5% is below average and you should negotiate a lower price or find a higher-rent property. The total return — including principal paydown, appreciation, and tax benefits — matters more than CoC alone. A 5% CoC deal with 4% appreciation and 2% principal paydown produces 11% total return, which is competitive with stock market averages.
What cash-on-cash return should I expect with a BRRRR strategy?
A well-executed BRRRR should produce 15-25% cash-on-cash or technically “infinite” return if the refinance recovers all your invested cash. The strategy works by buying below market value, rehabbing to force appreciation, refinancing at the new higher value, and pulling out your original investment. If you leave zero cash in the deal and still collect positive cash flow, the CoC is mathematically infinite. If you leave some cash in, target at least 15% CoC to justify the additional risk and effort compared to a turnkey purchase.
Why do some investors accept negative cash-on-cash returns?
Investors in gateway and high-appreciation markets (San Francisco, Austin, Miami) sometimes accept negative cash-on-cash returns of -2% to -5% because they expect 5-8% annual appreciation. Their thesis is that total return — appreciation plus equity buildup — will far exceed the monthly cash subsidy. This is a bet on price growth, not income. It works when markets appreciate as expected and fails badly when they flatten or decline. Most financial advisors recommend avoiding negative cash flow deals unless you have significant reserves and a long time horizon (7+ years).
How do I calculate cash-on-cash return on my specific deal?
Divide your annual pre-tax cash flow by your total cash invested. Annual cash flow = gross rent minus vacancy, property tax, insurance, management, maintenance, CapEx reserves, and mortgage payment. Total cash invested = down payment + closing costs + any upfront repairs. For example: $4,800 annual cash flow / $60,000 total cash invested = 8.0% cash-on-cash return. Use the cash-on-cash calculator to run the numbers automatically — it accounts for all expense categories and shows you where your deal falls on the good-to-poor scale.
Bottom Line
A good cash on cash return in 2026 is 8-12% for standard buy-and-hold rentals. But “good” is relative to your strategy, your market, and the current interest rate environment. The investors who are still buying deals in this market are the ones who adjusted their benchmarks from 12% (the 2020 standard) to 8% (the 2026 standard) and are building a portfolio that will perform even better when rates eventually drop.
Do not chase high CoC numbers in risky markets or inflate your projections with optimistic assumptions. A honest 8% return in a stable market with good tenants beats a theoretical 15% return in a Class D neighborhood where nothing goes according to plan.
Run your next deal through the cash-on-cash calculator, compare it against the benchmarks in this article, and make your decision based on real numbers — not gut feel.
Leave a Reply