Last updated: September 21, 2026 · Originally published: August 7, 2026 · By Alex Petrov
Real Estate InvestingAug 7, 202612 min read2,769 words
{
“@context”: “https://schema.org”,
“@type”: “FAQPage”,
“mainEntity”: [
{
“@type”: “Question”,
“name”: “What is an NOI calculator used for?”,
“acceptedAnswer”: {
“@type”: “Answer”,
“text”: “An NOI calculator computes Net Operating Income by subtracting vacancy loss and operating expenses from gross rental income. Investors use it to determine a property’s earning power, calculate cap rate, qualify for DSCR loans, and benchmark performance against comparable properties.”
}
},
{
“@type”: “Question”,
“name”: “What is the NOI formula?”,
“acceptedAnswer”: {
“@type”: “Answer”,
“text”: “NOI = Gross Scheduled Income − Vacancy Loss − Operating Expenses. Operating expenses include property taxes, insurance, repairs, maintenance, property management, utilities, and reserves. Mortgage payments, depreciation, and income taxes are NOT included.”
}
},
{
“@type”: “Question”,
“name”: “Does NOI include mortgage payments?”,
“acceptedAnswer”: {
“@type”: “Answer”,
“text”: “No. NOI is calculated before debt service. Mortgage principal and interest payments are excluded from the NOI calculation. That is what distinguishes NOI from cash flow — cash flow subtracts the mortgage payment from NOI.”
}
},
{
“@type”: “Question”,
“name”: “What is a good NOI margin for a rental property?”,
“acceptedAnswer”: {
“@type”: “Answer”,
“text”: “A good NOI margin (NOI ÷ Gross Income) varies by property type: single-family rentals typically run 45–55%, small multifamily 50–60%, and commercial properties 60–70%. Lower margins signal high expense ratios that deserve scrutiny.”
}
},
{
“@type”: “Question”,
“name”: “How do lenders use NOI?”,
“acceptedAnswer”: {
“@type”: “Answer”,
“text”: “Lenders divide NOI by the annual debt service (mortgage payments) to get the Debt Service Coverage Ratio (DSCR). Most commercial lenders require a DSCR of at least 1.25, meaning NOI must be 25% higher than annual mortgage payments.”
}
},
{
“@type”: “Question”,
“name”: “Can NOI be negative?”,
“acceptedAnswer”: {
“@type”: “Answer”,
“text”: “Yes. If operating expenses exceed effective gross income, NOI is negative. This typically signals a distressed property, excessive vacancies, or an unrealistic asking price. A property with negative NOI cannot support any debt service.”
}
},
{
“@type”: “Question”,
“name”: “How is NOI used to value a property?”,
“acceptedAnswer”: {
“@type”: “Answer”,
“text”: “Property Value = NOI ÷ Cap Rate. If a property produces $60,000 NOI and the local market cap rate is 6%, the implied value is $1,000,000. This income-approach valuation method is the standard for commercial and multifamily real estate.”
}
}
]
}
Quick Answer: What Does the NOI Calculator Do?
NOI = Gross Scheduled Income − Vacancy Loss − Operating Expenses
Enter your rental income and expenses and the NOI calculator instantly returns Net Operating Income, expense ratio, and implied property value at your target cap rate. Three calculation modes let you find NOI, reverse-engineer required income, or pinpoint maximum allowable expenses.
Every serious real estate investor eventually opens an NOI calculator — and for good reason. Net Operating Income is the single number that drives cap rate valuations, DSCR loan approvals, and property-level performance benchmarks. Before a lender underwrites your deal, before an appraiser assigns value, before a buyer makes an offer, they calculate NOI. Understanding how that number is built — and how to use a calculator to stress-test it — is one of the highest-leverage skills in real estate analysis.
This guide walks through the NOI formula in detail, shows you how to use all three modes of our calculator, and works through two complete examples — a 12-unit apartment and a single-family rental — so you can see exactly how the math plays out in practice.
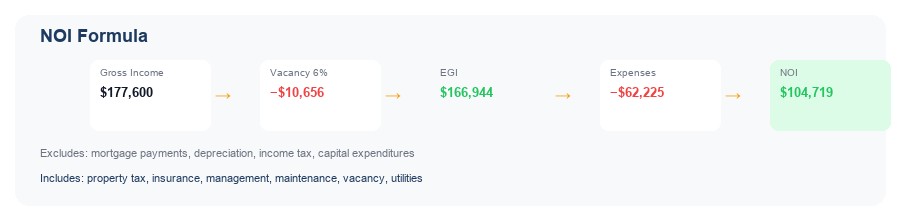
NOI = Gross Income − Vacancy − Operating Expenses
The NOI Formula: What Goes In, What Stays Out
Net Operating Income has a deceptively simple formula. Getting the inputs right, however, is where most investors stumble. According to the National Association of Realtors, misclassified expenses are among the most common errors in income property analysis.
The Three-Step Formula
Gross Scheduled Income (GSI)
 − Vacancy & Credit Loss
= Effective Gross Income (EGI)
 − Operating Expenses
= Net Operating Income (NOI)
Gross Scheduled Income is what the property would earn at 100% occupancy at market rents. For a 12-unit building where all units rent at $1,200/month, GSI is $172,800/year.
Vacancy and credit loss accounts for units sitting empty between tenants and tenants who don’t pay. The Federal Reserve’s rental vacancy data (FRED) shows national rates typically range from 5–8% for multifamily. Applying 6% to $172,800 gives a vacancy deduction of $10,368, leaving an Effective Gross Income of $162,432.
Operating expenses are all costs required to keep the property running. These include:
Property taxes
Insurance premiums
Property management fees (typically 8–12% of collected rent)
Repairs and maintenance
Utilities paid by the landlord
Landscaping and snow removal
Capital expenditure reserves
Pest control, trash, administrative costs
What Is NOT Included in NOI
This is where even experienced investors make errors. The following are explicitly excluded from NOI:
Mortgage payments — neither principal nor interest. NOI is pre-debt.
Depreciation — a non-cash accounting deduction per IRS Publication 946, not an operating expense.
Income taxes — owner-level tax obligations are not property expenses.
Capital improvements — roof replacements, renovations that add value are capitalized, not expensed.
Loan origination fees or points — financing costs, not operations.
How to Use the NOI Calculator: Three Calculation Modes
Our NOI calculator is built around three distinct modes, each designed for a different analytical question. Here is how each one works.
Mode 1: Find NOI (Standard Mode)
This is the most common use case. You know your income and expenses; you want the NOI.
Enter Gross Scheduled Income. Input total potential rent at 100% occupancy, annualized. Include all rent income — base rent plus any ancillary income like parking, laundry, or storage fees.
Enter your vacancy rate. Use your actual trailing 12-month vacancy if you own the property. For acquisitions, use market data or budget conservatively at 7–10%.
Enter each operating expense. The calculator accepts individual line items for taxes, insurance, management, repairs, utilities, and reserves. You can also enter a lump sum if you are working from a broker’s pro forma.
Review results. The calculator returns NOI, your expense ratio (total expenses ÷ EGI), and the implied property value if you input a target cap rate.
Mode 2: Find Required Income
You have a target NOI — perhaps driven by the DSCR requirement on your loan — and need to know what gross income the property must generate to hit it. Enter your expenses and your target NOI, and the calculator solves backward for the required Gross Scheduled Income and the implied occupancy needed to achieve it.
Mode 3: Find Maximum Expenses
You are buying at a fixed price, you know the cap rate in the market, and therefore you know what NOI the deal requires. Enter your income and your required NOI, and the calculator tells you the maximum operating expense budget you cannot exceed. This mode is particularly useful for evaluating value-add properties where you need to know how much renovation cost the numbers can absorb.
For deals where you are simultaneously calculating DSCR, open the DSCR calculator alongside the NOI results — it accepts NOI directly so you do not have to retype anything.
Worked Example 1: 12-Unit Apartment Building
Meet Sarah, a multifamily investor evaluating a 12-unit apartment in Austin, Texas. The listing shows a cap rate of 6.2% and asks $1.85 million. Before she trusts those numbers, she builds her own NOI analysis using the NOI calculator.
Step 1: Gross Scheduled Income
Unit Mix
Count
Monthly Rent
Annual Income
1-Bedroom
8
$1,100
$105,600
2-Bedroom
4
$1,450
$69,600
Laundry income
—
—
$2,400
Gross Scheduled Income
$177,600
Note that Sarah’s GSI is slightly different from the listing’s $14,400/month figure ($172,800) because she is also capturing the laundry income that the broker lumped elsewhere.
Step 2: Vacancy and Credit Loss
Austin’s Class B multifamily vacancy runs around 6% per market data from the Fannie Mae Multifamily Research team. Sarah applies 6%:
$177,600 × 6% = $10,656 vacancy loss Effective Gross Income = $177,600 − $10,656 = $166,944
Step 3: Operating Expenses
Expense
Annual Amount
Property taxes
$18,200
Insurance
$6,400
Property management (9%)
$15,025
Repairs and maintenance
$8,800
Common area utilities
$3,600
Landscaping
$2,400
Capital reserves ($500/unit)
$6,000
Administrative / legal
$1,800
Total Operating Expenses
$62,225
Step 4: NOI Result
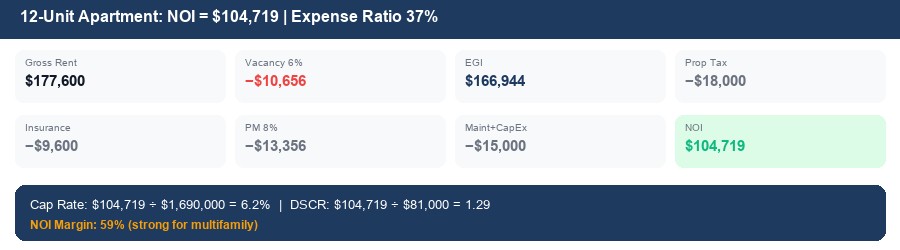
NOI = $166,944 − $62,225 = $104,719
Expense ratio: $62,225 ÷ $166,944 = 37.3% (well within normal range for multifamily).
Now Sarah checks the broker’s claimed cap rate. At $1,850,000:
Implied Cap Rate = $104,719 ÷ $1,850,000 = 5.66%
The broker claimed 6.2%. The difference? The broker used a lower expense figure and did not include reserves. Sarah’s analysis reveals the deal is priced about 8% higher than the advertised cap rate implies. She uses the Texas cap rate calculator to verify local market benchmarks before making her offer. For deals in other Sun Belt markets she also keeps the Florida cap rate calculator bookmarked for comparisons.
Worked Example 2: Single-Family Rental
Marcus owns a single-family rental in suburban Phoenix. The home rents for $2,200/month ($26,400/year). He is refinancing and needs to calculate NOI for the lender’s DSCR underwriting.
12-unit apartment: NOI $104,719, cap rate 6.2%, expense ratio 37%
NOI = $24,288 − $10,329 = $13,959
Expense ratio: $10,329 ÷ $24,288 = 42.5%
Marcus’s lender requires a 1.25 DSCR. Annual debt service on his proposed refinance is $10,800. DSCR = $13,959 ÷ $10,800 = 1.29 — he qualifies. The rental property calculator confirmed these numbers aligned with his overall cash-on-cash return target.
What Is a Good NOI? Margin Benchmarks by Property Type
NOI by itself is a dollar figure. To evaluate whether that NOI is healthy, calculate the NOI margin: NOI divided by Effective Gross Income. Here are typical ranges:
Property Type
Typical NOI Margin
Expense Ratio
Notes
Single-Family Rental
45–55%
45–55%
Higher maintenance per unit, lower management scale
Small Multifamily (2–4 units)
48–58%
42–52%
Economy of scale begins here
Mid-Size Multifamily (5–50 units)
50–60%
40–50%
Professional management typically 8–10%
Large Multifamily (50+ units)
55–65%
35–45%
Scale advantages in management and maintenance
Retail / Strip Mall
60–72%
28–40%
NNN leases shift expenses to tenants
Office
55–68%
32–45%
Vacancy risk varies significantly post-2020
A margin dramatically below these ranges — say, 30% on a multifamily — signals either inflated expenses, deferred maintenance reserves being ignored, or a seller’s pro forma that overstates income. See the guide to increasing NOI on rental properties for specific strategies to close the gap.
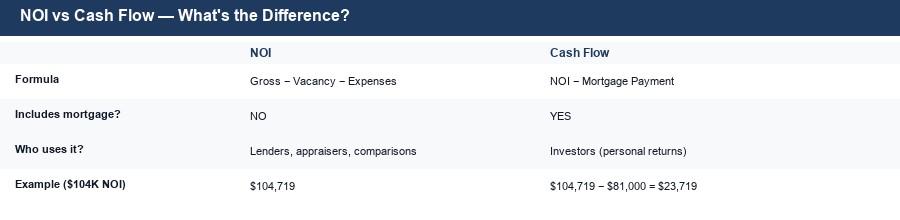
NOI excludes mortgage; cash flow includes it — different metrics for different audiences
NOI vs. Cash Flow: The Critical Difference
New investors frequently confuse NOI and cash flow. They are related, but different metrics that answer different questions. The confusion is covered in depth in the NOI vs cash flow comparison, but here is the condensed version:
Factor
NOI
Cash Flow
Mortgage principal
Excluded
Deducted
Mortgage interest
Excluded
Deducted
Operating expenses
Deducted
Deducted
Depreciation
Excluded
Excluded
Income taxes
Excluded
Excluded
Purpose
Property value, cap rate, DSCR
Investor return, equity build
Affected by financing?
No
Yes
Formula
EGI − Operating Expenses
NOI − Debt Service
NOI is a property-level metric. Cash flow is an investor-level metric. Two investors can buy the same property, produce identical NOI, and have completely different cash flows — because one paid all cash and one used 75% leverage. The rental property cash flow calculation guide explains how to bridge from NOI to net cash flow.
How NOI Connects to Cap Rate and DSCR
NOI is the engine that drives two of the most important metrics in commercial real estate underwriting.
NOI and Cap Rate
Cap Rate = NOI ÷ Property Value
Rearranged to solve for value: Property Value = NOI ÷ Cap Rate
If your property produces $85,000 NOI and you are in a market where comparable assets trade at a 5.5% cap rate, the implied value is $85,000 ÷ 0.055 = $1,545,455. This is the income approach to valuation, and it is the primary method used for multifamily and commercial assets. Use the cap rate calculator to work both sides of this equation.
When evaluating deals in specific markets, local cap rate data matters enormously. A 6% cap rate in Miami means something very different than 6% in rural Ohio. The state-level tools — like the Texas cap rate calculator and Florida cap rate calculator — incorporate regional market data to put your numbers in context.
NOI and DSCR
DSCR = NOI ÷ Annual Debt Service
Lenders set a minimum DSCR — most commercial lenders require 1.20 to 1.30, per standard Fannie Mae multifamily guidelines. A DSCR of 1.25 means the property generates 25% more NOI than required to make the mortgage payments. If your DSCR falls below the threshold, the loan does not get approved — regardless of your personal income or credit score.
Example: A property with $90,000 NOI and annual debt service of $72,000 has a DSCR of 1.25 — right at the typical threshold. Plug these numbers into the DSCR calculator to model how rate changes or loan amount adjustments affect your coverage ratio.
5 NOI Mistakes That Distort Your Analysis
Using an NOI calculator only produces accurate results when the inputs are honest. These five errors are the ones that most frequently cause investors to overpay or misunderstand a deal.
1. Skipping Management Fees When Self-Managing
If you manage the property yourself today, that saves cash — but it does not change what the property is worth. Any buyer who purchases from you will pay a property manager. Your NOI analysis must include a market-rate management fee (typically 8–12% of collected rent) even if you personally are not paying it. Leaving this out inflates NOI and leads to overpaying.
2. Forgetting Capital Reserves
Reserves for capital expenditures — HVAC replacement, roof, appliances, plumbing — are real operating costs. They do not appear on a monthly bank statement, but they will appear eventually. Standard practice is to reserve $500–$1,500 per unit per year for multifamily, or 5–10% of rental income for SFR. Brokers routinely exclude reserves from pro formas to make NOI look higher.
3. Using Gross Income Instead of Effective Gross Income
Running your expense calculations against GSI — before vacancy — overstates the base and understates your expense ratio. Always deduct vacancy first to reach EGI, then calculate expense percentages. A management fee of “10% of rents collected” should be applied to EGI, not GSI.
4. Accepting the Seller’s Expense Numbers at Face Value
Seller-provided operating statements have a structural incentive to understate expenses. Always request Schedule E tax returns for the trailing two years and reconcile them against the pro forma. Discrepancies between what the seller reports to the IRS and what appears on the marketing pro forma are revealing. Read more about this and other due diligence tactics in the net operating income guide.
5. Including One-Time Items in Recurring NOI
A year with unusually low maintenance costs — maybe the seller deferred every non-emergency repair before listing — will make NOI look better than it really is. Similarly, a one-time insurance payout or legal settlement can inflate income. Stabilized, recurring NOI is what you are buying. Strip out non-recurring items before running your analysis in the NOI calculator.
Frequently Asked Questions
What is an NOI calculator used for?
An NOI calculator computes Net Operating Income by subtracting vacancy loss and operating expenses from gross rental income. Investors use it to determine a property’s earning power, calculate cap rate, qualify for DSCR loans, and benchmark performance against comparable properties.
What is the NOI formula?
NOI = Gross Scheduled Income − Vacancy Loss − Operating Expenses. Operating expenses include property taxes, insurance, repairs, maintenance, property management, utilities, and reserves. Mortgage payments, depreciation, and income taxes are NOT included.
Does NOI include mortgage payments?
No. NOI is calculated before debt service. Mortgage principal and interest payments are excluded from the NOI calculation. That is what distinguishes NOI from cash flow — cash flow subtracts the mortgage payment from NOI.
What is a good NOI margin for a rental property?
A good NOI margin (NOI ÷ Gross Income) varies by property type: single-family rentals typically run 45–55%, small multifamily 50–60%, and commercial properties 60–70%. Lower margins signal high expense ratios that deserve scrutiny.
How do lenders use NOI?
Lenders divide NOI by the annual debt service (mortgage payments) to get the Debt Service Coverage Ratio (DSCR). Most commercial lenders require a DSCR of at least 1.25, meaning NOI must be 25% higher than annual mortgage payments. Use the DSCR calculator to check your coverage before applying.
Can NOI be negative?
Yes. If operating expenses exceed effective gross income, NOI is negative. This typically signals a distressed property, excessive vacancies, or an unrealistic asking price. A property with negative NOI cannot support any debt service and usually requires significant repositioning before financing is possible.
How is NOI used to value a property?
Property Value = NOI ÷ Cap Rate. If a property produces $60,000 NOI and the local market cap rate is 6%, the implied value is $1,000,000. This income-approach valuation method is the standard for commercial and multifamily real estate. Use the cap rate calculator to run both directions of this equation.
Related Calculators and Tools
NOI analysis rarely happens in isolation. These tools work alongside the NOI calculator to give a complete picture of any rental property deal:
NOI Calculator — Calculate net operating income, expense ratio, and implied property value in three modes.
Cap Rate Calculator — Convert NOI into a cap rate or use a cap rate to back into implied property value.
DSCR Calculator — Divide NOI by annual debt service to check loan qualification.
Rental Property Calculator — Full investment analysis including cash flow, cash-on-cash return, and equity build.

Leave a Reply