Last updated: September 24, 2026 · Originally published: August 6, 2026 · By Alex Petrov
Real Estate InvestingAug 6, 202615 min read3,653 words
{
“@context”: “https://schema.org”,
“@type”: “FAQPage”,
“mainEntity”: [
{
“@type”: “Question”,
“name”: “What is an Airbnb calculator?”,
“acceptedAnswer”: {
“@type”: “Answer”,
“text”: “An Airbnb calculator is a tool that estimates short-term rental revenue, net operating income, and cash flow by combining your nightly rate, occupancy percentage, cleaning fees, property management fees, and operating expenses. It helps investors compare STR income against long-term rental income before purchasing or converting a property.”
}
},
{
“@type”: “Question”,
“name”: “How accurate is an Airbnb revenue calculator?”,
“acceptedAnswer”: {
“@type”: “Answer”,
“text”: “Accuracy depends on the quality of your inputs. Using real comp data from AirDNA or local Airbnb listings for nightly rate, and verified occupancy rates for your specific market, will produce estimates within 10-15% of actual performance. Calculators that rely on optimistic assumptions will overstate returns.”
}
},
{
“@type”: “Question”,
“name”: “What occupancy rate should I use for an Airbnb calculator?”,
“acceptedAnswer”: {
“@type”: “Answer”,
“text”: “Use market-specific occupancy rates: beach markets typically run 65-80%, urban/city markets 55-70%, and rural or mountain markets 40-55%. New listings usually underperform market averages by 10-15% in the first 90 days while building reviews. Always model a conservative scenario first.”
}
},
{
“@type”: “Question”,
“name”: “How much does it cost to set up a property for Airbnb?”,
“acceptedAnswer”: {
“@type”: “Answer”,
“text”: “Initial furniture and setup costs typically range from $5,000 to $15,000 for a standard 1-3 bedroom property, depending on current condition and furnishing level. Higher-end markets or properties marketed as luxury may require $20,000 or more. This one-time cost should be factored into your break-even analysis.”
}
},
{
“@type”: “Question”,
“name”: “Does Airbnb collect taxes on my behalf?”,
“acceptedAnswer”: {
“@type”: “Answer”,
“text”: “Airbnb collects and remits occupancy taxes in many jurisdictions automatically, but not all. You are responsible for verifying which local, state, and county taxes apply to your property, obtaining required STR permits, and filing income taxes on rental income. Requirements vary significantly by city and county.”
}
},
{
“@type”: “Question”,
“name”: “Is Airbnb more profitable than long-term rental?”,
“acceptedAnswer”: {
“@type”: “Answer”,
“text”: “In many markets, Airbnb generates 1.5x to 2.5x the gross revenue of a comparable long-term rental. However, STR involves higher operating costs (cleaning, supplies, PM fees of 20-30%), more active management, greater regulatory risk, and higher vacancy during slow seasons. Net profitability depends heavily on location, property type, and management approach.”
}
},
{
“@type”: “Question”,
“name”: “What expenses should I include in an Airbnb calculator?”,
“acceptedAnswer”: {
“@type”: “Answer”,
“text”: “Include: mortgage/debt service, property taxes, insurance (STR-specific policy costs 20-40% more than standard landlord policies), utilities, HOA fees, cleaning fees per turnover, property management fees (20-30% of gross revenue), Airbnb host service fee (3%), restocking supplies, maintenance and repairs, and occasional capex for furniture replacement.”
}
}
]
}
Quick Answer: How to Use an Airbnb Calculator
Enter your nightly rate, estimated occupancy percentage, cleaning fee, property management fee, and monthly operating expenses. The calculator returns annual gross revenue, net operating income (NOI), and break-even occupancy — so you know exactly what utilization you need to cover costs before you commit to converting a property.
Published: August 6, 2026 · Last updated: August 6, 2026
You’re staring at a single-family home that’s been renting long-term for $1,800/month, and a neighbor tells you she’s clearing $3,200/month on Airbnb with the same floor plan. Before you give your tenant notice and order a ring doorbell, you need an airbnb calculator — a tool that turns nightly rate, occupancy, and expense estimates into a defensible revenue and cash flow projection. This guide walks through exactly how to build that projection, with two full worked examples, a side-by-side STR vs. LTR comparison, and the five most common calculation mistakes that cause investors to lose money in their first year.
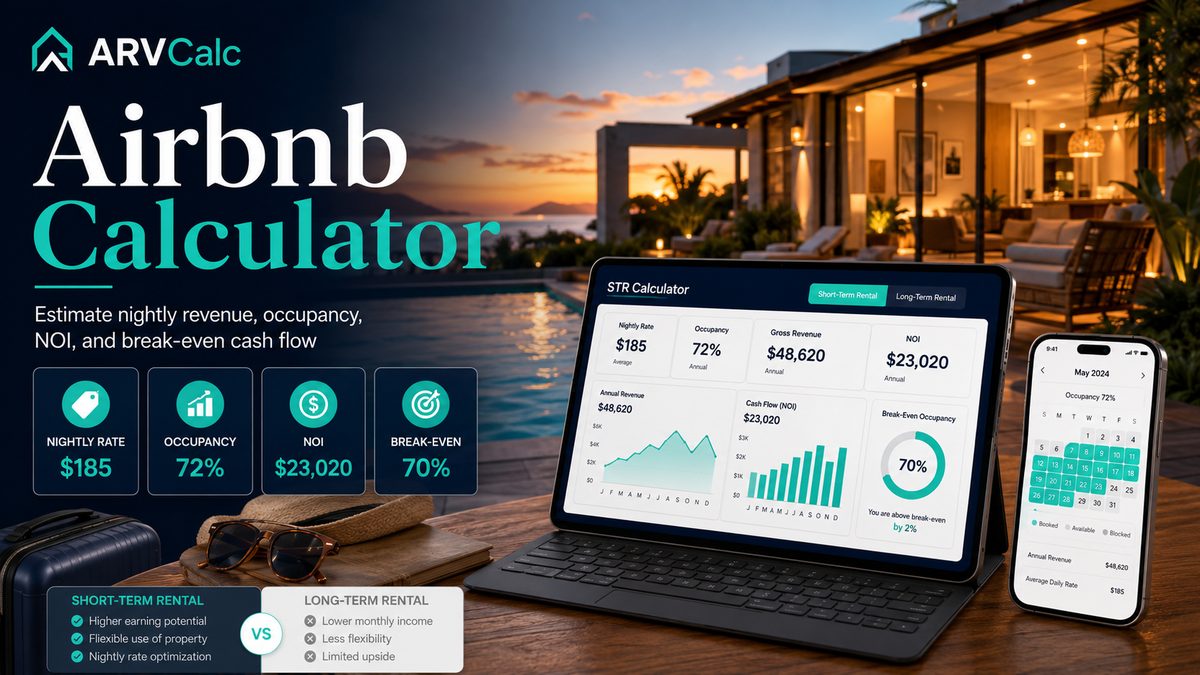
If you want to skip straight to the numbers, open the ArvCalc Airbnb STR Calculator in a second tab and follow along. Every formula is what that tool runs under the hood.
A well-built airbnb calculator is not just a revenue multiplier. It models the full income statement for a short-term rental: gross revenue, gross operating expenses, NOI, and — if you include financing — cash flow after debt service. Here are the inputs that matter and why each one affects your bottom line.
Core Inputs
Nightly rate. Your average rate across all bookings. This is not your listing price — it’s the blend of peak-season rates, mid-week discounts, and last-minute deals. Using your peak rate as an average is one of the most expensive mistakes in STR underwriting.
Occupancy percentage. The share of available nights that are booked. A 365-night year at 70% occupancy means 255.5 booked nights. Market occupancy varies significantly — more on benchmarks below.
Cleaning fee per turnover. If you charge guests a cleaning fee but pay a cleaner, this may be close to a wash. If you manage cleaning yourself, the fee becomes revenue. The calculator needs to know your net cleaning cost.
Property management fee. Full-service STR managers typically charge 20–30% of gross revenue. Some charge a flat monthly fee plus a booking fee. This is the single largest operating expense for most passive STR owners.
Airbnb host service fee. Airbnb charges hosts approximately 3% of the booking subtotal. This is deducted before you receive payment and must be included as an expense.
Fixed monthly expenses. Mortgage/debt service, property taxes, insurance, HOA fees, utilities (which STR owners typically pay, unlike LTR landlords), and internet.
Variable monthly expenses. Supplies restocking (toiletries, coffee, paper goods), minor maintenance, and a repair reserve (typically 1–2% of property value annually).
Setup/furniture costs. A one-time expense of $5,000–$15,000 for most 1–3 bedroom properties, higher for luxury or larger homes. This affects your payback period and break-even analysis even though it’s a sunk cost by year two.
How the Math Flows
The airbnb calculator builds the income statement in this sequence:
Airbnb generates higher revenue but requires more management and capital
How to Estimate Nightly Rate for the Airbnb Calculator
The most consequential input in any airbnb calculator is nightly rate, and the most common error is using aspirational pricing rather than actual comp data. Here are the three research methods that produce defensible estimates.
Method 1: AirDNA Market Data
AirDNA aggregates booking data from millions of Airbnb and Vrbo listings and provides average daily rate (ADR), occupancy, and revenue data at the zip code and neighborhood level. For a specific property, filter by bedroom count, property type, and distance from your target address. AirDNA’s “Market Minder” tool shows monthly seasonality curves — critical for understanding how much revenue shifts between January and July in your market.
One note: AirDNA data reflects listed prices, not always cleared prices. During high-demand periods, actual bookings may occur below listing price if hosts use aggressive dynamic pricing. Use the “Revenue” metric rather than “ADR” to get the most accurate blended rate picture.
Method 2: Manual Airbnb Comp Search
Search Airbnb directly for your target market, filtering by property type and bedroom count. Look at listings with 20+ reviews — these are established performers. Check their pricing calendar 60–90 days out to see actual listed rates by season. Calculate a rough monthly average across 3–5 comparable listings. This is free and often more granular than paid data tools for niche markets.
Method 3: Zillow and Long-Term Rental Comps
Zillow‘s rent estimate tool gives you a long-term rental benchmark. A common rule of thumb is that a well-run STR in a solid market generates 1.5x–2.5x the monthly long-term rent. If Zillow puts monthly rent at $1,800, your STR monthly revenue target should be $2,700–$4,500 to justify the extra effort and risk. If comp data doesn’t support that range, the conversion may not pencil out.
How to Estimate Occupancy for Your Airbnb Calculator
Occupancy is the second most important variable in the airbnb calculator — and the one most commonly inflated during underwriting. Here are market-level benchmarks and the adjustments to apply for new listings.
Market-Type Benchmarks
Market Type
Typical Occupancy Range
Seasonality Risk
Beach/Coastal Resort
65–80%
High — summer-heavy
Major Urban / City Center
55–70%
Moderate — event-driven spikes
Near Theme Parks / Attractions
60–75%
Moderate — school calendar
Mountain / Ski
50–70%
High — winter-heavy
Rural / Small Town
40–55%
Very high — limited demand drivers
Suburban / Transitional
45–60%
Moderate
New Listing Discount
New listings on Airbnb typically underperform market averages by 10–15% for the first 60–90 days while accumulating reviews. A market running 70% occupancy is more accurately modeled at 58–62% for month one through three. Run both scenarios in the Airbnb STR Calculator to see how the ramp-up period affects first-year cash flow.
Seasonality Adjustments
Annual average occupancy masks monthly variance that is critical for cash flow management. A beach rental at 75% annual occupancy might run 90%+ in July and 40% in January. If your mortgage payment is $2,200/month and January STR income is $900, you need reserves to cover the gap. Model month-by-month using AirDNA’s seasonality data, not just annual averages. Our vacancy rate guide covers seasonal vacancy modeling in detail.
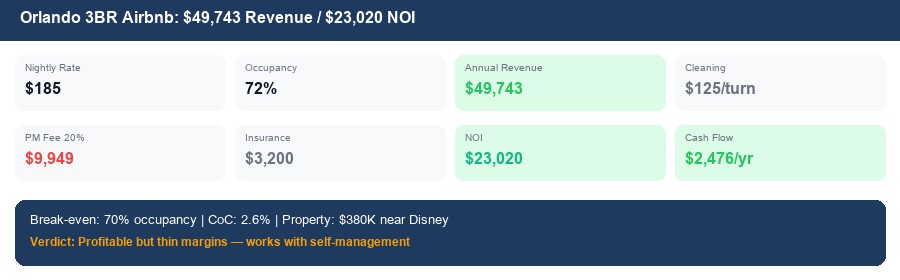
Worked Example 1: Orlando STR near Disney (3BR)
This is the kind of deal an investor considers when running an airbnb calculator for the first time in a tourism market. Here’s the full pro forma.
Orlando: Property Details
Location: Kissimmee / Four Corners area, ~8 miles from Disney
Property: 3BR/2BA single-family home, 1,450 sq ft
Purchase price: $340,000
Down payment: 25% = $85,000
Loan: $255,000 at 7.1%, 30-year = $1,712/month P&I
This deal produces modest cash flow at 72% occupancy with only 2 percentage points of buffer above break-even. The real return comes from appreciation in the Orlando corridor and tax depreciation benefits. For cap rate context, run these numbers through the Cap Rate Calculator — at $340K purchase and $23,020 NOI, cap rate is 6.77%. That’s within market range for tourism-adjacent STRs in Florida. See also our Florida rental property calculator for state-specific tax and expense context.
Compare this to long-term rental: at $1,900/month LTR with 8% vacancy and standard landlord expenses, annual cash flow on the same financing would likely be negative ($200–$400/month loss). The STR converts a cash-flow-negative deal into a modestly positive one — though with considerably more management intensity.
Worked Example 2: Austin Downtown Condo
Not every market makes STR math work the same way. Run the same airbnb calculator framework on an Austin downtown condo and the story is different — and illustrates why market selection matters as much as the calculator itself.
Austin: Property Details
Location: Austin, TX — downtown/East 6th area
Property: 1BR/1BA condo, 720 sq ft
Purchase price: $385,000
Down payment: 25% = $96,250
Loan: $288,750 at 7.1%, 30-year = $1,940/month P&I
This deal doesn’t work as an STR investment at current pricing and financing costs. Break-even occupancy of 93.7% is unachievable in any sustainable market. Texas’s high property tax rate (~2.1% effective) is the primary culprit — it adds over $8,000/year that a Florida investor wouldn’t face at the same price point. The long-term rental alternative (est. $2,100/month, 95% occupancy) produces gross rent of $23,940 against fixed expenses of $38,561 — also negative, making this a pure appreciation play at current prices.
Before walking away from Austin entirely, check whether a higher-demand property type (3BR house near the Domain or South Congress) changes the math. Use our STR Calculator to test scenarios quickly. Also see our Airbnb cap rate article for how to benchmark NOI-to-price ratios by market.
Airbnb Calculator vs. Long-Term Rental: Full Comparison
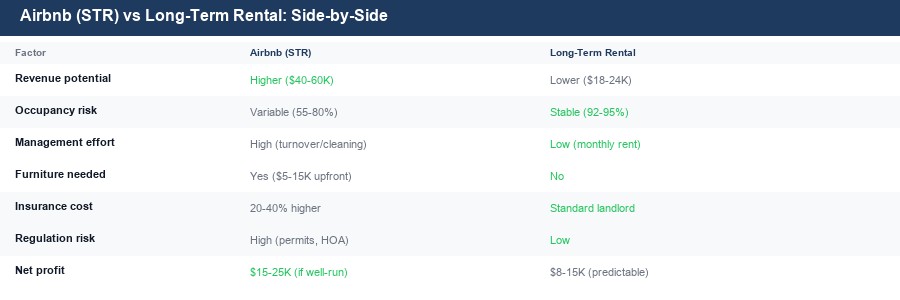
Running an airbnb calculator is only useful when you can compare the result to your alternative — which is usually a long-term rental. Here’s a structured comparison across the dimensions that matter most to investors.
Factor
Airbnb / STR
Long-Term Rental
Gross Revenue Potential
1.5x–2.5x LTR in strong markets
Baseline — predictable monthly
Vacancy Risk
Higher — seasonal, platform-dependent
Lower — typically 5–8% annually
Operating Expenses
40–60% of gross revenue
25–40% of gross revenue
Management Effort
High — guest communication, turnovers, pricing
Low — annual lease, fewer touchpoints
Insurance Cost
20–40% higher than LTR policy
Standard landlord policy
Utility Costs
Owner-paid in most STR setups
Tenant-paid in most LTR setups
Regulatory Risk
High and growing — many cities restricting STR
Low — well-established legal framework
Financing Availability
Harder — lenders use LTR rent for DSCR
Standard investor financing available
Wear and Tear
Higher — more turnovers, higher traffic
Lower — typically one household
Tax Complexity
Higher — STR rules, occupancy tax, Schedule C vs. E
Standard Schedule E treatment
For a detailed LTR analysis on any property, run it through the Rental Property Calculator. For a head-to-head STR comparison, use the Airbnb STR Calculator and compare NOI figures side by side. Our Airbnb income guide covers real investor case studies in more detail.
STR Regulations to Check Before You Run Your Airbnb Calculator
Running an airbnb calculator that shows positive cash flow is only valuable if you can legally operate the property as an STR. Regulatory compliance is the step most first-time STR investors skip — and it’s the one that can turn a profitable deal into a total write-off.
City and County Permits
Most major U.S. cities now require a short-term rental permit or license. Some cities cap the total number of STR permits issued. Others require owner-occupancy (you must live in the property for a minimum number of days per year). Check your municipality’s planning or zoning department website directly — requirements change frequently. AirDNA’s regulation tracker provides a useful starting point, but always verify with local government.
HOA Rules
If your property is in an HOA, check the CC&Rs before assuming STR is permitted. Many HOAs explicitly prohibit rentals under 30 days. Some grandfather existing short-term rentals but ban new applications. A condo association that bans STR after you purchase is a worst-case scenario — verify this before closing, not after.
Zoning Restrictions
Some municipalities use zoning overlays to restrict STR to specific districts. Areas near tourist attractions may be zoned to permit STR while residential neighborhoods have outright bans. Check both the zoning code and any recent city council ordinances. Resources like Mashvisor’s STR regulation database and local real estate attorney consultations are worthwhile investments before purchase.
Tax Registration and Collection
Most states and many counties require STR operators to collect and remit transient occupancy tax (TOT), hotel tax, or lodging tax. While Airbnb collects and remits these taxes on your behalf in many jurisdictions, you are ultimately responsible for compliance. Register with your state’s department of revenue, check county requirements, and verify whether Airbnb’s collection covers your specific jurisdiction or whether you must remit separately. See also the state-by-state lodging tax requirements database for a useful starting point.
Insurance Requirements
Standard homeowner’s or landlord policies typically exclude commercial short-term rental activity. You need an STR-specific policy or a commercial endorsement. Airbnb’s AirCover provides some host protection, but it is not a substitute for a dedicated insurance policy. STR-specific insurance from providers like Proper Insurance or CBIZ typically costs 20–40% more than a standard landlord policy — budget accordingly in your calculator inputs.
5 Airbnb Calculator Mistakes That Cost Investors Real Money
Even investors who use an airbnb calculator religiously make errors in how they populate the inputs. These are the five mistakes that most consistently lead to first-year underperformance.
Mistake 1: Using Peak Occupancy as Your Annual Average
A property that runs 90% occupancy in July and August will likely run 40–50% in January and February if you’re in a seasonal market. Your annual average might be 62%, but if you modeled 90% when building your pro forma, your actual cash flow will be roughly 30% below projections. Use AirDNA’s monthly occupancy breakdown and build a weighted average, not a peak assumption.
Mistake 2: Ignoring Seasonality in Cash Flow Planning
Related to Mistake 1, but distinct: even if you get the annual average right, modeling flat monthly income will mislead you on reserve requirements. If your mortgage is $2,000/month and your January STR income is $1,100, you need $900 in reserves to stay current. Build a monthly cash flow model, not just an annual total. The Airbnb STR Calculator surfaces monthly variance automatically.
Mistake 3: Forgetting Property Management Fees
Many first-time STR investors plan to self-manage, then switch to a PM company after six months of handling 2 a.m. guest emergencies. If you underwrite the deal assuming self-management and the deal only works with that assumption, you’ve built fragility into your model. Always run the calculator with PM fees included (20–30%), then treat self-management as upside — not a requirement.
Mistake 4: Underestimating Cleaning Costs and Turnover Frequency
At a 2–3 night average stay length and 70% occupancy, a property turns over 85–130 times per year. Each cleaning in a furnished property takes longer than a quick apartment walkthrough. Professional cleaners charge $80–$175 per cleaning for a 2–3 bedroom home. At 100 turnovers × $110 = $11,000/year in cleaning costs alone. This is a real operating expense, not an offset by the cleaning fee if your fee doesn’t fully cover it.
Mistake 5: Omitting Furniture and Setup Costs from Break-Even Analysis
The $5,000–$15,000 you spend furnishing a property before the first guest arrives is real capital at risk. It affects your true payback period and return on invested capital. A deal with $3,000/year cash flow that required $12,000 in setup costs has a 4-year payback just on furniture — before you count the down payment. Always include setup costs in your total capital deployed when calculating cash-on-cash return.
What is an Airbnb calculator and what does it calculate?
An Airbnb calculator estimates short-term rental revenue, net operating income, and cash flow by combining nightly rate, occupancy percentage, cleaning fees, property management fees, and fixed and variable operating expenses. More advanced versions include break-even occupancy analysis and comparisons to long-term rental income.
How much can I realistically make on Airbnb?
Income varies enormously by market, property type, and management quality. A 3BR home near a major tourist attraction in a permissive STR market might generate $45,000–$65,000/year in gross revenue. A 1BR condo in a heavily regulated urban market might generate $28,000–$38,000. After operating expenses, NOI typically runs 40–60% of gross revenue. Use the STR Calculator with your specific market data for a realistic estimate.
What occupancy rate should I assume in an Airbnb calculator?
Use market-specific data from AirDNA or comparable listing analysis. Broad benchmarks: beach/resort markets 65–80%, major cities 55–70%, rural/mountain 40–55%. Reduce your estimate by 10–15% for the first 60–90 days of operation while you accumulate reviews. Model a conservative scenario and a realistic scenario, not an optimistic one.
What is a good cap rate for an Airbnb property?
STR properties typically target cap rates of 6–10% in competitive markets, with tourism-heavy markets often trading at 5.5–7.5% and tertiary markets at 8–12%. Cap rate is calculated on NOI before debt service divided by purchase price. Calculate yours with the Cap Rate Calculator and compare to the Airbnb cap rate benchmarks guide.
How do I find the right nightly rate for my market?
Use three sources: AirDNA for aggregated market ADR and occupancy data, direct Airbnb listing searches for comparable properties with 20+ reviews, and Zillow rent estimates as a long-term rental benchmark. Cross-check all three. Your target nightly rate should be the blended average across all booking periods, not your peak-season listing price.
Is Airbnb still profitable in 2026?
Yes, in the right markets with correct underwriting. The STR market has become more competitive with increased supply in popular markets, and regulations have tightened in many cities. Properties with genuine demand drivers — proximity to attractions, unique features, or underserved markets — continue to outperform long-term rental income. The deals that no longer work are those that relied on pandemic-era occupancy and nightly rate spikes.
What’s the difference between gross revenue and NOI in an Airbnb calculator?
Gross revenue is total income before any expenses — nightly rate times booked nights plus cleaning fees received. NOI (net operating income) is gross revenue minus all operating expenses (PM fees, insurance, taxes, utilities, supplies, maintenance) but before debt service. NOI is the most important metric for comparing deals on an apples-to-apples basis regardless of financing structure. Cash flow is NOI minus your mortgage payment.
Related Calculators and Resources
Use these tools alongside the airbnb calculator to build a complete investment analysis:
Airbnb STR Calculator — the main tool: nightly rate, occupancy, expenses, NOI, and break-even occupancy in one place
Rental Property Calculator — full LTR analysis including DSCR, GRM, and cash-on-cash return for comparison
Cap Rate Calculator — benchmark your NOI-to-price ratio against market standards
Leave a Reply