Last updated: September 24, 2026 · Originally published: August 5, 2026 · By Alex Petrov
Real Estate InvestingAug 5, 202611 min read2,631 words
{
“@context”: “https://schema.org”,
“@type”: “FAQPage”,
“mainEntity”: [
{
“@type”: “Question”,
“name”: “What is a cap rate calculator used for?”,
“acceptedAnswer”: {
“@type”: “Answer”,
“text”: “A cap rate calculator helps real estate investors measure the annual return on an income-producing property independent of financing. Enter the property’s net operating income (NOI) and purchase price, and the calculator instantly outputs the capitalization rate as a percentage.”
}
},
{
“@type”: “Question”,
“name”: “What is the formula for cap rate?”,
“acceptedAnswer”: {
“@type”: “Answer”,
“text”: “Cap Rate = Net Operating Income (NOI) ÷ Current Property Value × 100. NOI is gross rental income minus all operating expenses (vacancy, property taxes, insurance, maintenance, management fees), but before mortgage payments.”
}
},
{
“@type”: “Question”,
“name”: “What is a good cap rate for a rental property in 2026?”,
“acceptedAnswer”: {
“@type”: “Answer”,
“text”: “A good cap rate depends on the market and property type. In high-demand metros, 4–5% is typical for multifamily. In secondary markets like the Midwest or Southeast, 6–8% is common. Single-family rentals often trade at 5–7%. Anything above 9% signals higher risk or a distressed asset.”
}
},
{
“@type”: “Question”,
“name”: “Does cap rate include the mortgage?”,
“acceptedAnswer”: {
“@type”: “Answer”,
“text”: “No. Cap rate is calculated before debt service (mortgage payments). This makes it a financing-neutral metric so investors can compare properties regardless of how they are financed. To factor in your loan, use the cash-on-cash return or DSCR instead.”
}
},
{
“@type”: “Question”,
“name”: “Can I use a cap rate calculator to find property value?”,
“acceptedAnswer”: {
“@type”: “Answer”,
“text”: “Yes. Run the calculator in reverse: Property Value = NOI ÷ Cap Rate. If a building produces $24,000 NOI and the local market cap rate is 6%, the implied value is $400,000. This is called the income approach to valuation and is widely used by appraisers and commercial brokers.”
}
},
{
“@type”: “Question”,
“name”: “What expenses go into NOI for cap rate?”,
“acceptedAnswer”: {
“@type”: “Answer”,
“text”: “NOI includes: gross scheduled rent minus vacancy allowance (5–10%), then subtract property taxes, insurance, property management fees (8–10% of rent), routine maintenance and repairs, landscaping, utilities paid by landlord, and a capital expenditure reserve. Do NOT subtract mortgage principal or interest.”
}
},
{
“@type”: “Question”,
“name”: “How is cap rate different from cash-on-cash return?”,
“acceptedAnswer”: {
“@type”: “Answer”,
“text”: “Cap rate ignores financing and uses total property value as the denominator. Cash-on-cash return divides annual pre-tax cash flow (after mortgage payments) by the actual cash invested (down payment + closing costs). Two investors buying the same property can have very different cash-on-cash returns depending on their loan terms, but they will always share the same cap rate.”
}
}
]
}
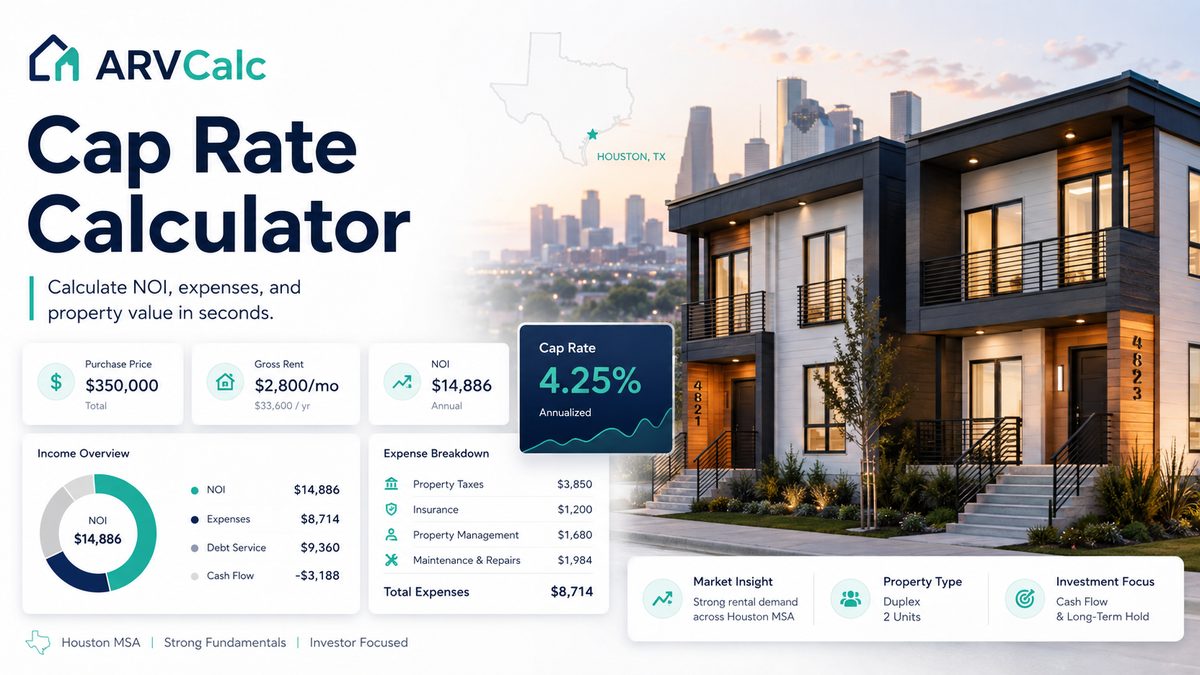
You are looking at a $350,000 duplex in Houston. The listing says rents are $2,800 per month. Before you make an offer, you need one number: the cap rate. Using a cap rate calculator takes less than two minutes — enter gross income, operating expenses, and purchase price, and you instantly know whether this deal clears your return threshold or belongs in the discard pile. This guide walks through the formula, both worked examples, common mistakes, and every feature inside the calculator so you leave ready to underwrite any deal with confidence.
Quick Answer
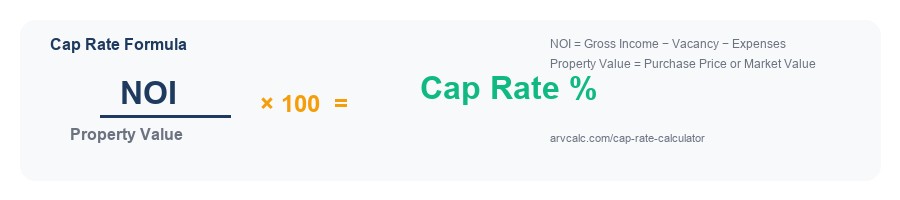
Cap rate = NOI ÷ Property Value × 100.
Open the cap rate calculator, enter your gross rent, vacancy rate, operating expenses, and purchase price. The calculator outputs your cap rate in seconds — no spreadsheet required.
Cap Rate = NOI / Property Value × 100
The Cap Rate Formula Explained
The capitalization rate is the ratio of a property’s net operating income to its market value:
Cap Rate (%) = NOI ÷ Property Value × 100
Each variable has a precise definition that matters when you plug numbers into a cap rate calculator.
Net Operating Income (NOI)
NOI is gross rental income minus all operating expenses — but explicitly before mortgage payments. This financing-neutral design lets you compare a free-and-clear property against a heavily leveraged one on equal footing. Use our NOI calculator to compute this number precisely before feeding it into the cap rate tool.
Operating expenses that reduce NOI include:
Vacancy and credit loss (industry standard: 5–10% of gross rents)
Property taxes
Landlord-paid insurance
Property management fees (typically 8–10% of collected rent)
Routine maintenance and repairs
Landlord-paid utilities
Capital expenditure reserve (roof, HVAC, appliances)
Landscaping and pest control
Expenses that do not reduce NOI: mortgage principal, mortgage interest, depreciation, and income tax. These are financing or accounting items, not property-level operating costs.
Property Value
Use the agreed purchase price when analyzing a deal pre-close. Use the current appraised or market value when evaluating an asset you already own. The denominator drives everything: a lower value produces a higher cap rate, which is why buyers and sellers often disagree on what cap rate a property “deserves.”
Why Cap Rate Is Financing-Neutral
Because NOI excludes debt service, the cap rate stays constant regardless of whether you pay cash, put 25% down, or use a commercial bridge loan. Two investors buying the same property at the same price will always share the same cap rate, even if their loan terms differ sharply. For leverage-sensitive analysis, pair the cap rate with our DSCR calculator and the rental property calculator.
How to Use the Cap Rate Calculator Step by Step
The cap rate calculator on this site supports three calculation modes. In standard (forward) mode, you provide income and expenses to find the cap rate. Here is how to fill each field:
Step 1 — Enter Gross Annual Rent
Input the total scheduled rent before any deductions. For a duplex with two units at $1,400 per month each, that is $2,800/month × 12 = $33,600 per year. The calculator accepts monthly or annual input — use whichever your rent roll shows.
Step 2 — Set Your Vacancy Rate
The default is 5%, which is appropriate for stable, low-vacancy markets. In metros with higher turnover or seasonal demand, raise this to 8–10%. The U.S. Census Bureau Housing Vacancies Survey publishes quarterly vacancy data by region and property type — a solid benchmark for your assumption.
Step 3 — Add Operating Expenses
Enter each expense category individually or use the calculator’s percentage-of-income shortcut. Common expense ratios for residential income properties run 35–50% of effective gross income. Commercial assets often run 30–45% depending on lease structure. You can also pull the NOI directly from your underwriting model using our NOI calculator and skip this step.
Step 4 — Enter Purchase Price
This is the total acquisition cost: contract price plus closing costs. Many investors input only the contract price and add closing costs separately to understand the “all-in” cap rate versus the nominal cap rate.
Step 5 — Read the Output
The calculator displays cap rate as a percentage, alongside NOI, effective gross income, and total operating expenses. You can also view the implied property value at your target cap rate — useful for making offers in reverse.
Worked Example 1: Houston Duplex at $350,000
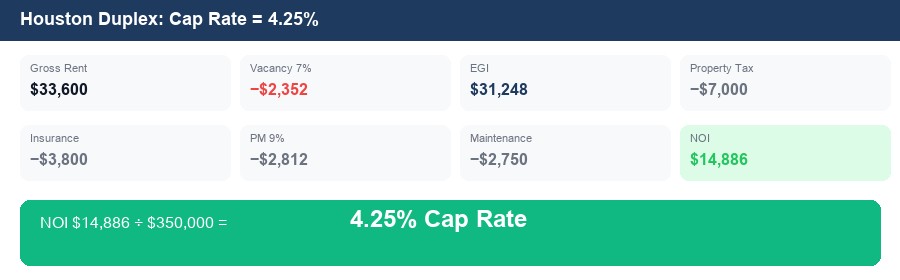
Let us underwrite the Houston duplex from the opening scenario using the cap rate calculator.
Houston duplex: NOI $14,886 ÷ $350,000 = 4.25% cap rate
A 4.25% cap rate is on the lower end for a Houston duplex. According to cap rates by state for 2026, Houston residential cap rates average 5.1–6.0% in suburban submarkets. This deal may need price negotiation, a rent increase plan, or expense reduction to pencil out. You can see how Houston stacks up versus other markets on the Texas cap rate calculator page.
At 3.21%, this Jacksonville SFR produces a thin cap rate. Florida insurance costs have risen sharply since 2022 — a dynamic documented by the National Association of Realtors in its state housing outlook reports. The buyer would need to either negotiate price down to approximately $220,000 (to reach a 3.8% cap rate) or pursue a value-add strategy with rent increases. Explore similar deals on the Florida cap rate calculator page.
What Is a Good Cap Rate in 2026?
There is no universal “good” cap rate — acceptable ranges shift by property type, location, and interest rate environment. The full guide to good cap rates by property type covers this in depth. Here is a 2026 reference table:
Property Type
Gateway Markets
Secondary Markets
Tertiary / Rural
Small Multifamily (2–4 units)
3.5–5.0%
5.5–7.0%
7.0–9.5%
Single-Family Rental
3.0–4.5%
5.0–6.5%
6.5–9.0%
Apartment Buildings (5+ units)
4.0–5.5%
5.5–7.5%
7.5–10%
Retail Strip / NNN
5.0–6.5%
6.5–8.0%
8.0–11%
Industrial / Flex
4.5–6.0%
6.0–7.5%
7.5–10%
Cap rates move inversely to property values. When the Federal Reserve raised the federal funds rate aggressively in 2022–2023, cap rates expanded by 100–150 basis points across most asset classes, as documented by FRED (Federal Reserve Economic Data). With rates stabilizing in 2025–2026, cap rate compression has slowed but not reversed in most markets. Always compare a deal’s cap rate against the 10-year Treasury yield plus a risk premium — this spread tells you whether you are being compensated for the illiquidity and management burden of real estate.
Cap Rate by State: Quick Reference
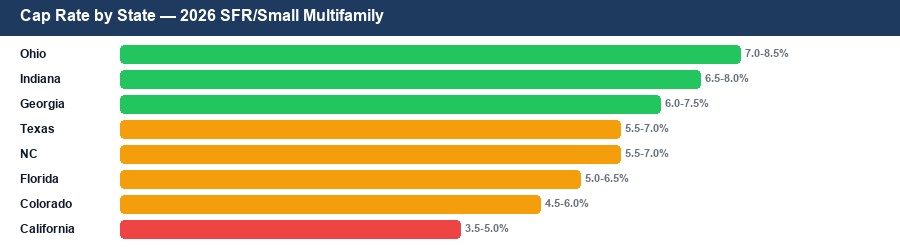
Market cap rates differ substantially across states due to local tax burdens, insurance costs, rent growth trajectories, and demand dynamics. The table below shows median residential cap rates compiled from transaction data for early 2026. For deep analysis, visit the full cap rate by state guide for 2026.
State
Median Cap Rate
Key Driver
Texas
5.3%
High property taxes offset strong rent growth
Florida
4.8%
Rising insurance costs compress returns
Ohio
7.1%
Affordable entry prices, stable rents
Indiana
7.4%
Low purchase prices, growing Midwest demand
California
3.2%
Sky-high valuations, rent control restrictions
Georgia
5.9%
Atlanta metro demand and suburban growth
Michigan
7.8%
Highest yields in the Midwest
Arizona
4.6%
Strong appreciation history, compressed cap rates
Cap rate ranges by state — Ohio and Indiana highest, California and Florida lowest
3 Calculator Modes: Forward, Reverse Value, Reverse NOI
The cap rate calculator operates in three modes, each answering a different investor question.
Mode 1 — Forward: Find the Cap Rate
Input: NOI + Property Value Output: Cap Rate %
Use this before making an offer. You know the asking price and you have underwritten the income and expenses. The calculator confirms whether the deal meets your minimum return threshold.
Example: NOI = $21,000, Price = $350,000 → Cap Rate = 6.0%
Mode 2 — Reverse: Find the Property Value
Input: NOI + Target Cap Rate Output: Implied Market Value
Use this when a seller is negotiating price. If the local market trades at 6.5% and the property produces $19,500 NOI, the justified price is $300,000 — not the $340,000 the seller is asking. This is the income approach used by commercial real estate appraisers and referenced in Fannie Mae’s multifamily underwriting guidelines.
Example: NOI = $19,500, Market Cap Rate = 6.5% → Value = $300,000
Mode 3 — Reverse: Find the Required NOI
Input: Property Value + Target Cap Rate Output: Required NOI
Use this for value-add analysis. You are buying a distressed property at $280,000 and want to reach a 7% cap rate after renovation. The calculator tells you the NOI target is $19,600/year. You can then reverse-engineer the rent and expense assumptions needed to hit that number.
Example: Value = $280,000, Target Cap Rate = 7.0% → Required NOI = $19,600
For full income property modeling across all three scenarios, the rental property calculator adds cash flow, cash-on-cash return, and five-year appreciation projections in one tool.
5 Cap Rate Mistakes That Distort Your Analysis
Even experienced investors make these errors when using a cap rate calculator. Each one can make a mediocre deal look like a great one — or vice versa.
Mistake 1 — Using Gross Rent Instead of NOI
The most common error: dividing gross rent by purchase price and calling that the cap rate. Gross rent includes no deductions. Real NOI after vacancy, taxes, insurance, management, and repairs is often 40–55% lower than gross rent on a residential property. A property showing a “7% cap rate” on gross rent may be a 3.8% deal in reality. Always compute true NOI first — use the NOI calculator to get this right.
Mistake 2 — Ignoring Vacancy
Assuming 0% vacancy is fantasy underwriting. Even Class A properties in tight markets experience some turnover loss. The Census Bureau Housing Vacancy Survey shows rental vacancy rates between 5.5% and 7.0% nationally. Use a market-appropriate vacancy rate — never zero.
Mistake 3 — Omitting Capital Expenditure Reserves
The roof, HVAC, water heater, and appliances will eventually need replacement. Excluding CapEx from operating expenses overstates NOI and inflates cap rate. A practical rule: reserve $1,000–$2,500 per unit per year depending on property age and condition.
Mistake 4 — Including Mortgage Payments in Expenses
Cap rate is explicitly a pre-financing metric. Including principal and interest payments in your expense line produces a lower NOI, which then yields an artificially low cap rate. Your deal will look worse than it is, and you cannot compare it against other properties with different loan terms. Strip debt service out entirely. Use the DSCR calculator to analyze leverage separately.
Mistake 5 — Using Asking Price Instead of Market Value
An overpriced listing produces an artificially low cap rate, which leads some investors to incorrectly discard a deal that could be negotiated to a better price. Run the reverse mode of the cap rate calculator to find what the property is worth at your target cap rate, then use that figure as your maximum offer price.
A cap rate calculator helps real estate investors measure the annual return on an income-producing property independent of financing. Enter the property’s NOI and purchase price, and the calculator instantly outputs the capitalization rate as a percentage. It is used for quick deal screening, offer price negotiation, and comparing properties across different markets.
What is the formula for cap rate?
Cap Rate = Net Operating Income (NOI) ÷ Current Property Value × 100. NOI equals gross rental income minus vacancy, property taxes, insurance, maintenance, management fees, and reserves — but before mortgage payments.
What is a good cap rate for a rental property in 2026?
It depends on market and property type. In high-demand metros, 4–5% is typical for multifamily. In secondary Midwest and Southeast markets, 6–8% is common. Single-family rentals often trade at 5–7%. Anything above 9% signals higher risk or a distressed asset that requires careful scrutiny.
Does cap rate include the mortgage?
No. Cap rate is calculated before debt service. This makes it a financing-neutral metric so investors can compare properties regardless of how they are financed. To factor in your loan, use the cash-on-cash return or the DSCR alongside cap rate.
Can I use a cap rate calculator to find property value?
Yes — use the reverse mode. Property Value = NOI ÷ Cap Rate. If a building produces $24,000 NOI and the local market cap rate is 6%, the implied value is $400,000. This is the income approach to valuation used by commercial appraisers and institutional investors.
What expenses go into NOI for cap rate?
NOI includes: gross scheduled rent minus vacancy allowance (5–10%), then subtract property taxes, insurance, property management fees, routine maintenance and repairs, landscaping, landlord-paid utilities, and a capital expenditure reserve. Do not subtract mortgage principal or interest — those are excluded by definition.
How is cap rate different from cash-on-cash return?
Cap rate ignores financing and uses total property value as the denominator. Cash-on-cash return divides annual pre-tax cash flow (after mortgage payments) by the actual cash invested (down payment plus closing costs). Two investors buying the same property can have very different cash-on-cash returns depending on their loan terms, but they will always share the same cap rate.
Related Calculators
Cap Rate Calculator — find cap rate, implied value, or required NOI instantly
NOI Calculator — build a full income and expense schedule before calculating cap rate
Leave a Reply