
Last updated: September 15, 2026 · Originally published: August 8, 2026 · By Alex Petrov
Cash-on-cash return measures how much cash income you earn each year relative to the cash you put into a deal. If you invest $44,000 in a rental property and it generates $4,400 in annual pre-tax cash flow, your cash-on-cash return is 10%. The metric only counts real dollars — the rent checks you collect minus every expense and every mortgage payment. Use the cash-on-cash return calculator to run the number in under 60 seconds before you make an offer.
What Is Cash-on-Cash Return?
Cash-on-cash return (CoC) tells you the annual pre-tax yield on the actual dollars you invested. It ignores appreciation, tax benefits, and principal paydown — on purpose. Those are real benefits, but they are hard to pocket today. CoC measures the cash you hold in your hand at the end of the year.
That narrowness is exactly why investors like it. You can compare a rental property in Indianapolis to a money-market fund, a REIT, or another rental in Phoenix on the same footing. Apples to apples.
Cash-on-Cash Return Formula
The cash-on-cash return formula is:
Cash-on-Cash Return = Annual Pre-Tax Cash Flow ÷ Total Cash Invested × 100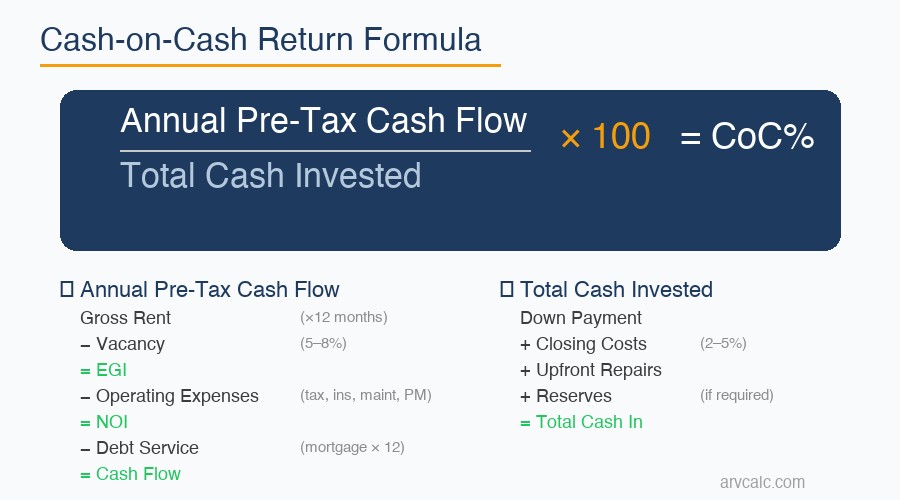
Where:
- Annual Pre-Tax Cash Flow = Net Operating Income (NOI) − Annual Debt Service
- Total Cash Invested = Down payment + Closing costs + Any upfront repairs
The NOI calculator breaks down the top half of that equation if you want to see those numbers first. NOI equals effective gross income (gross rent minus vacancy) minus all operating expenses — taxes, insurance, maintenance, management fees. Everything except the mortgage.
The mortgage payment then comes out of NOI to give you cash flow. Divide that by your cash in, and you have cash-on-cash return.
One critical point: total cash invested is not just the down payment. If you paid $44,000 down and $6,600 in closing costs, your denominator is $50,600. Investors who forget closing costs inflate their CoC by 10–15% before they even close.
How to Use Our Cash-on-Cash Return Calculator
The cash-on-cash calculator runs in three modes. Each solves a different question.
Mode 1: Standard — Find Your Cash-on-Cash Return
This is the default mode. You enter the deal details and get the return.
Step 1 — Enter the purchase price and financing. Input purchase price, down payment percentage, interest rate, and loan term. The calculator computes your monthly mortgage payment automatically. Or enter the payment directly if you already have a quote from your lender.
Step 2 — Enter income. Monthly gross rent, plus any other income (laundry, parking, storage). Set a vacancy rate. For most single-family rentals, 5–8% is realistic. For multifamily in tight markets, 3–5%.
Step 3 — Enter operating expenses. Property tax (annual), insurance (annual), maintenance (many investors use 8–10% of gross rents as a rule of thumb), property management (typically 8–12% of collected rents), HOA if applicable, utilities you pay.
Step 4 — Enter total cash invested. Down payment plus closing costs plus any renovation budget you’re putting in at purchase.
Hit calculate. The cash on cash return calculator shows your annual cash flow, monthly cash flow, and CoC percentage. It also shows NOI and the cap rate, so you can cross-reference with the cap rate calculator.
Mode 2: Reverse — Find the Rent You Need
You have a property under consideration and a target CoC return. What rent do you need to hit that target?
Enter the purchase price, financing terms, operating expenses (excluding rent), your target CoC percentage, and your total cash invested. The calculator works backward to give you the minimum monthly rent required. Compare that to actual market rents. If market rent is $1,400 and you need $1,850, walk away.
This mode is most useful when you’re analyzing a deal quickly and don’t want to run scenarios manually. It also pairs well with the rental property calculator for a fuller picture.
Mode 3: Reverse — Find the Maximum Purchase Price
You know the rent, you know your target return, you know what financing you can get. What’s the most you should pay?
Enter the monthly rent, vacancy rate, operating expenses, financing terms, and target CoC. The calculator tells you the maximum purchase price that still hits your return. Use this as your ceiling going into negotiations. If the seller wants more, you know exactly how much of your return you’re trading away for every extra $10,000 you pay.
This is one of the most underused features in the cash on cash return calculator. Investors who use it walk into every negotiation knowing exactly where their number breaks down.
Worked Example 1: Houston Single-Family Rental
Property: 3-bed/2-bath in northwest Houston suburb
Purchase price: $220,000
Down payment: 20% ($44,000)
Loan: $176,000 at 7.0%, 30-year fixed
Rent: $1,950/month (self-managed)
Step 1: Calculate Monthly Mortgage Payment
Using the standard amortization formula at 7.0% on $176,000 for 30 years:
Monthly payment = $1,171/month
Annual debt service = $1,171 × 12 = $14,052
You can verify this in the investment property mortgage calculator.
Step 2: Calculate Effective Gross Income
Gross annual rent: $1,950 × 12 = $23,400
Less vacancy (5%): − $1,170
Effective Gross Income (EGI): $22,230
Step 3: Calculate Operating Expenses
| Expense | Annual Amount | Basis |
|---|---|---|
| Property tax | $4,070 | 1.85% effective rate on $220K |
| Insurance | $1,200 | Standard HO-6 / landlord policy |
| Maintenance | $1,872 | 8% of gross rents |
| Total Operating Expenses | $7,142 |
No property management fee — this investor is self-managing.
Step 4: Calculate NOI
NOI = EGI − Operating Expenses
NOI = $22,230 − $7,142 = $15,088
The NOI calculator automates this step.
Step 5: Calculate Annual Cash Flow
Annual Cash Flow = NOI − Annual Debt Service
Annual Cash Flow = $15,088 − $14,052 = $1,036
Step 6: Calculate Cash-on-Cash Return
Cash-on-Cash Return = $1,036 ÷ $44,000 × 100 = 2.4%Result: 2.4% cash-on-cash return. That sits in the “below average” tier (see the benchmark table below). The property is cash-flow positive — barely — but it does not generate meaningful yield on your $44,000 down payment. Houston’s property tax burden is the main culprit. If rents rise or you refinance at a lower rate, the return improves. If you add a property manager, it goes negative.
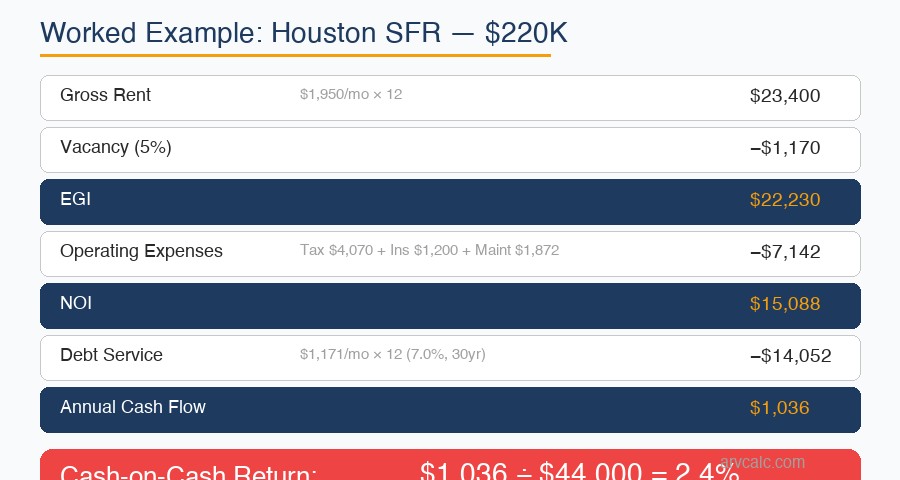
This is exactly the kind of deal the cash on cash return calculator catches before you commit. The listing looked fine on paper at $1,950/month rent. The calculator reveals you’re working for $86/month.
For the full picture including appreciation and equity, run it through the real estate ROI calculator.
Worked Example 2: Indianapolis Duplex
Property: Duplex in east Indianapolis
Purchase price: $175,000
Down payment: 25% ($43,750)
Loan: $131,250 at 7.0%, 30-year fixed
Rent: $1,100/unit × 2 units = $2,200/month total (property managed)
Step 1: Mortgage Payment
Monthly payment = $873/month
Annual debt service = $873 × 12 = $10,479 (rounded: $10,476)
We’ll use $10,476 based on precise amortization ($873 × 12).
Step 2: Effective Gross Income
Gross annual rent: $2,200 × 12 = $26,400
Less vacancy (7%): − $1,848
Effective Gross Income: $24,552
Duplex vacancy is set at 7% — higher than SFR because you lose 50% of income when one unit turns over. Some investors model each unit separately; the net result is similar.
Step 3: Operating Expenses
| Expense | Annual Amount | Basis |
|---|---|---|
| Property tax | $1,575 | 0.9% effective rate on $175K |
| Insurance | $1,400 | Landlord policy, duplex |
| Maintenance | $2,112 | 8% of gross rents |
| Property management | $2,640 | 10% of collected rents |
| Total Operating Expenses | $7,727 |
Step 4: NOI
NOI = $24,552 − $7,727 = $16,825Step 5: Annual Cash Flow
Annual Cash Flow = $16,825 − $10,476 = $6,349Step 6: Cash-on-Cash Return
Cash-on-Cash Return = $6,349 ÷ $43,750 × 100 = 14.5%Result: 14.5% cash-on-cash return. This is an excellent deal by any standard. Indianapolis’s lower purchase price, lower tax rate, and strong rent-to-price ratio produce a CoC return that beats most stock market averages — with a fully managed, passive asset.
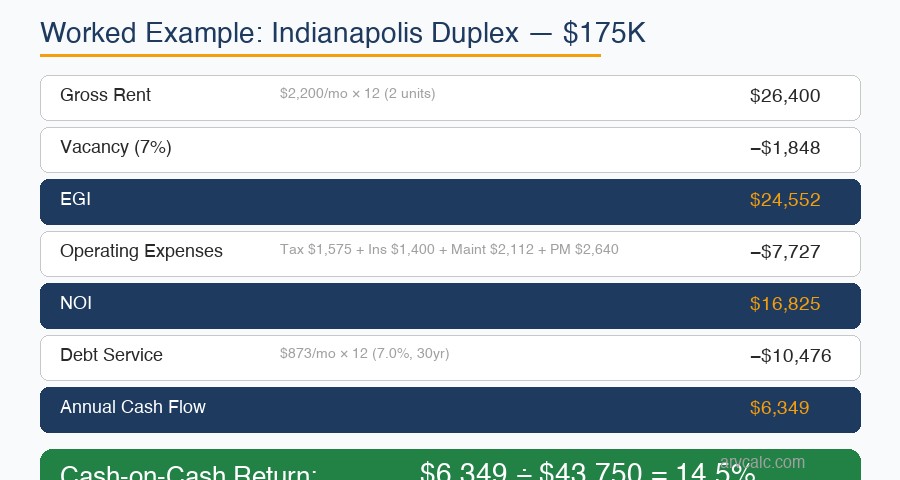
The side-by-side comparison here is instructive. Two deals, nearly identical cash invested (~$44,000). One returns $86/month. The other returns $529/month — and that’s after paying a property manager. The cash-on-cash calculator makes this contrast visible in 60 seconds.
To stress-test the Indianapolis deal — what happens if vacancy goes to 12%? If maintenance runs 12%? — use the property cash flow calculator for sensitivity analysis.
Cash-on-Cash Return vs. Cap Rate vs. ROI
These three metrics get used interchangeably by people who shouldn’t be investing. They measure different things. Here’s the breakdown:
| Metric | What It Measures | Includes Debt? | Includes Cash? | Best Used For |
|---|---|---|---|---|
| Cash-on-Cash Return | Annual cash yield on cash invested | Yes | Yes | Comparing leveraged deals; evaluating passive income |
| Cap Rate | Property’s income yield independent of financing | No | No | Comparing properties across markets; estimating value |
| Total ROI | Total return including appreciation + equity | Yes | Yes | Long-term wealth building analysis |
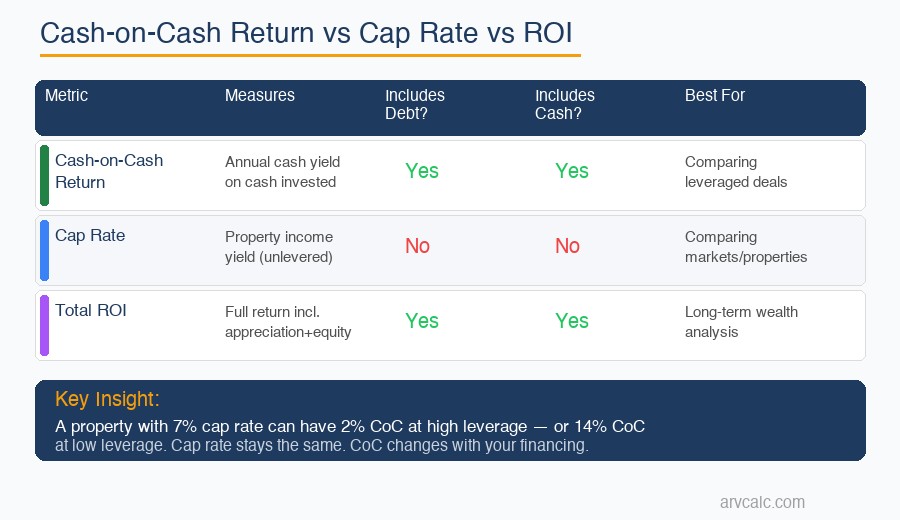
Cap rate pretends you paid all cash$2. It divides NOI by purchase price. That makes it useful for comparing two properties in different markets or evaluating a market’s pricing — but it tells you nothing about what your actual cash return will be with a mortgage. Read the full breakdown in what is a good cap rate for rental property. Use the cap rate calculator alongside the CoC calculator.
Total ROI adds appreciation, tax benefits, and principal paydown to cash flow. It gives you the full picture of wealth creation but requires assumptions about future appreciation that may not materialize. The real estate ROI calculator handles that math.
Cash-on-cash return focuses on one question: what am I actually collecting in cash this year per dollar I invested? For investors who need cash flow — whether to supplement income, qualify for more loans, or cover personal expenses — CoC is the primary metric. For context on how these fit together, see the full rental property analysis guide.
What Is a Good Cash-on-Cash Return in 2026?
There is no universal number. A good CoC depends on your market, your risk tolerance, and what you’re comparing it to. But the industry has developed rough tiers that most experienced investors agree on.
At 7%+ mortgage rates, these benchmarks have compressed compared to the 2018–2021 era. Properties that hit 8% CoC in today’s environment are genuinely performing. The sub-5% deals were more common in low-rate periods when appreciation was the primary return driver.
| Cash-on-Cash Return | Tier | Interpretation |
|---|---|---|
| > 12% | Excellent | Strong cash flow; likely a value-add deal, secondary market, or seller concession. Worth moving fast. |
| 8% – 12% | Good | Solid returns above most alternatives. Typical for well-bought Midwest and Southeast deals in 2026. |
| 5% – 8% | Average | Acceptable if appreciation upside is strong or if the deal is in a tight supply market. Don’t overpay. |
| 3% – 5% | Below Average | Marginal cash flow. Requires appreciation to justify the capital deployment. High risk if rents fall. |
| < 3% | Poor | Not a cash-flow investment. You are keyly speculating on appreciation. Know that going in. |
Context matters. A 6% CoC on a Class A apartment in Austin is a different risk profile than 6% on a C-class SFR in a secondary market. According to NAR research, single-family investor returns have compressed since 2022 as home prices and interest rates rose simultaneously.
The Federal Reserve’s 30-year mortgage rate data shows rates oscillating between 6.5% and 7.5% through 2025–2026. At those rates, properties purchased at 2021 prices frequently show sub-5% CoC. Markets where price-to-rent ratios are low — Indianapolis, Cleveland, Memphis, Kansas City — tend to produce the strongest CoC in the current environment.
For an alternative perspective on how institutional investors benchmark returns, BiggerPockets’ investor resources provide useful market context. Fannie Mae’s research also publishes rental market data relevant to underwriting decisions.
For geographic context on rent trends, the Census Bureau’s Housing Vacancy Survey is the most reliable source for vacancy rates by market. Use market vacancy data — not national averages — when you set your vacancy assumption in the cash-on-cash return calculator.
5 Common Mistakes When Calculating Cash-on-Cash Return
Mistake 1: Using Gross Rent Instead of Effective Gross Income
What happens: You use $2,200/month × 12 = $26,400 as your income figure without subtracting vacancy.
Why it matters: Even a 5% vacancy rate on a $26,400 annual rent means $1,320 less income. Over a 10-year hold, that’s $13,200 in income you projected but never received. It inflates your CoC by 1–2 percentage points and makes bad deals look acceptable.
Fix: Always apply a vacancy rate before calculating NOI. Use local market data from the Census Bureau HVS or a local property manager’s experience. The cash on cash return calculator has a dedicated vacancy rate field — use it.
Mistake 2: Excluding Closing Costs from Total Cash Invested
What happens: You divide annual cash flow by the down payment only, ignoring the $6,000–$9,000 you paid at closing.
Why it matters: On a $44,000 down payment with $7,000 in closing costs, your real cash invested is $51,000. Using $44,000 in the denominator overstates your CoC by about 16%. It can make a 6% deal look like a 7% deal — meaningful when your target is 6%+.
Fix: Add down payment + closing costs + initial repair budget + any reserves you funded at close. That total is your denominator. The investment property down payment guide breaks down all the cash you need to bring to a closing.
Mistake 3: Forgetting Capital Expenditure Reserves
What happens: You model maintenance as 8% of gross rents but don’t budget separately for big-ticket items — roof, HVAC, water heater, windows.
Why it matters: A $12,000 roof replacement in year 4 is not a surprise; it’s a planned expense. If you haven’t reserved for it, it hits your cash flow as a shock and your actual CoC collapses that year. The 8% maintenance budget covers small repairs, not capital replacements.
Fix: Add a CapEx reserve line — typically 5–10% of gross rents on top of maintenance. For older properties (20+ years), budget higher. For newer construction with remaining warranties, budget lower. The rental property calculator has separate fields for maintenance and CapEx reserves.
Mistake 4: Using the Listed Rent, Not Market Rent
What happens: The seller tells you the property rents for $1,800/month. You model $1,800/month. You close. The tenant leaves. Market rent is $1,500.
Why it matters: Sellers have every incentive to show you high rents — whether through above-market leases, related-party tenants, or simply optimistic projections. Modeling inflated rent produces inflated CoC, and you paid for income that doesn’t exist.
Fix: Research market rent independently before making an offer. Use Zillow Rent Zestimate, Rentometer, and local property management companies for comps. Run your CoC on market rent, not asking rent. If the deal only works at the seller’s rent figures, that’s a red flag. The rental property investment analysis guide covers rent verification in detail.
Mistake 5: Comparing CoC Across Different Leverage Levels
What happens: You compare a deal with 20% down against a deal with 30% down using CoC and declare the 20% down deal “better” because the CoC is higher.
Why it matters: Higher leverage amplifies returns — in both directions. A 20% down deal at 10% CoC has more risk than a 30% down deal at 8% CoC, but the surface comparison misses that. You’re comparing different capital structures, not different deals.
Fix: When comparing deals with different down payments, also compare the DSCR (debt-service coverage ratio) to understand how much cushion exists above the mortgage payment. Use the deal analysis framework to evaluate both risk and return together. The real estate deal analysis checklist walks through all the numbers in sequence.
Frequently Asked Questions About Cash-on-Cash Return
What is a good cash-on-cash return for a rental property in 2026?
In 2026, with 30-year mortgage rates between 6.5% and 7.5%, most experienced investors target 8% or higher cash-on-cash return as a baseline for a solid deal. Returns above 12% are excellent and typically come from value-add opportunities, below-market purchases, or secondary markets with strong rent-to-price ratios. Returns below 5% signal that you are relying heavily on appreciation rather than cash flow to justify the investment. Use the cash-on-cash return calculator to check any deal against these benchmarks before making an offer.
How is cash-on-cash return different from cap rate?
Does cash-on-cash return include principal paydown?
What should I include in total cash invested?
Can cash-on-cash return be negative?
How does a DSCR loan affect cash-on-cash return?
How does cash-on-cash return change if I use a hard money loan?
Related Calculators and Resources
The cash-on-cash return is one piece of a complete deal analysis. These tools and guides fill in the rest:
- Cash-on-Cash Return Calculator — Run standard, reverse-rent, and reverse-price calculations
- Cap Rate Calculator — Evaluate property performance independent of financing
- NOI Calculator — Build out your net operating income line by line
- Rental Property Calculator — Full deal analysis including appreciation, equity, and tax impact
- Property Cash Flow Calculator — Project monthly and annual cash flow with sensitivity ranges
- DSCR Calculator — Check whether your deal meets DSCR loan requirements
- Investment Property Mortgage Calculator — Model different rate and term scenarios
- Hard Money Loan Calculator — Analyze short-term bridge financing costs
- Real Estate ROI Calculator — Total return including appreciation and equity
- All Calculators — Full suite of real estate investment tools
Relevant guides from the blog:
- The Complete Cash-on-Cash Return Guide
- Net Operating Income: How to Calculate NOI for Rental Properties
- How to Calculate Rental Property Cash Flow
- How to Analyze a Rental Property Investment
- What Is a Good Cap Rate for Rental Property?
- DSCR Loans: Complete Guide for 2026
- Investment Property Down Payment Guide
- Investment Property Interest Rates: What to Expect
- Real Estate Deal Analysis Checklist
Leave a Reply