Last updated: September 24, 2026 · Originally published: August 13, 2026 · By Alex Petrov
The multifamily property calculator analyzes apartment building deals the way commercial lenders do — unit-by-unit income, detailed operating expenses, NOI, debt service coverage, and cash-on-cash return. If you are evaluating a duplex, fourplex, or 20-unit building, this calculator runs the full underwriting in under two minutes. No signup required.
What Does the Multifamily Calculator Do
The calculator takes three categories of input and produces the metrics lenders and investors care about:
| Input | What You Enter |
|---|---|
| Income | Number of units, rent per unit (or total), other income (laundry, parking, storage), vacancy rate |
| Expenses | Property tax, insurance, maintenance, property management, utilities, HOA, CapEx reserves |
| Financing | Purchase price, down payment %, interest rate, loan term |
| Output | What It Tells You |
|---|---|
| NOI | Net Operating Income — property performance before debt |
| Cap Rate | NOI ÷ Purchase Price — unlevered yield |
| DSCR | NOI ÷ Debt Service — does it qualify for a loan? |
| Cash-on-Cash | Annual cash flow ÷ cash invested — your yield |
| Cash Flow | Monthly and annual after all expenses + mortgage |
| Per-Unit Metrics | Price/unit, rent/unit, expense/unit — for comp analysis |
The per-unit metrics are what separates multifamily analysis from single-family. A 12-unit building at $1.2M is $100K/unit. If comparable buildings trade at $120K/unit, you are buying at a discount. The multifamily calculator surfaces these numbers automatically.
How to Use the Multifamily Calculator: Step by Step
Mode 1: Standard — Analyze a Deal
Step 1 — Enter property details. Purchase price, number of units, and unit mix if applicable. For a uniform building (all 2BR units at the same rent), enter total units and rent per unit. For mixed buildings, enter total gross rent directly.
Step 2 — Enter income. Monthly rent per unit (or total), plus other income. Set vacancy rate — 5% for Class A in tight markets, 8–10% for Class B/C, 12%+ for value-add with current vacancies. The calculator computes Effective Gross Income (EGI).
Step 3 — Enter operating expenses. Property tax (annual), insurance, maintenance (most multifamily operators budget 10–15% of EGI), property management (8–10% for on-site, 5–8% for third-party), utilities the owner pays, CapEx reserves (5–10% of EGI). Use the NOI calculator if you want to isolate this step.
Step 4 — Enter financing. Purchase price, down payment percentage (typically 25–30% for multifamily), interest rate, and loan term. Commercial multifamily loans often use 25-year amortization with a 5-year or 10-year balloon — enter the amortization period, not the balloon term.
Step 5 — Read results. The multifamily property calculator shows NOI, cap rate, DSCR, cash flow (monthly and annual), cash-on-cash return, and per-unit metrics. It also shows a color-coded tier badge (Excellent / Good / Average / Below Average / Poor) based on your cash-on-cash return.
Mode 2: Reverse — Find Maximum Purchase Price
You know the rent, you know your target cap rate or cash-on-cash return, and you know expenses. What is the most you should pay? Enter all inputs except purchase price, set your target return, and the calculator works backward to give you the maximum purchase price. Walk into every negotiation knowing your ceiling.
Mode 3: Reverse — Find Required Rent
You have a building under contract and a target return. What rent do you need to hit that target? This mode is especially useful for value-add multifamily — you are buying at current (below-market) rents and need to know what post-renovation rents must be to justify the purchase price plus rehab budget.
Worked Example 1: Memphis 12-Unit Apartment — $960,000
Property: 12-unit apartment building, all 2BR/1BA units
Purchase price: $960,000 ($80,000/unit)
Down payment: 25% ($240,000)
Loan: $720,000 at 7.25%, 25-year amortization
Rent: $950/unit/month × 12 units = $11,400/month total
Other income: $200/month (laundry)
Step 1: Effective Gross Income
Gross annual rent: $11,400 × 12 = $136,800
Other income: $200 × 12 = $2,400
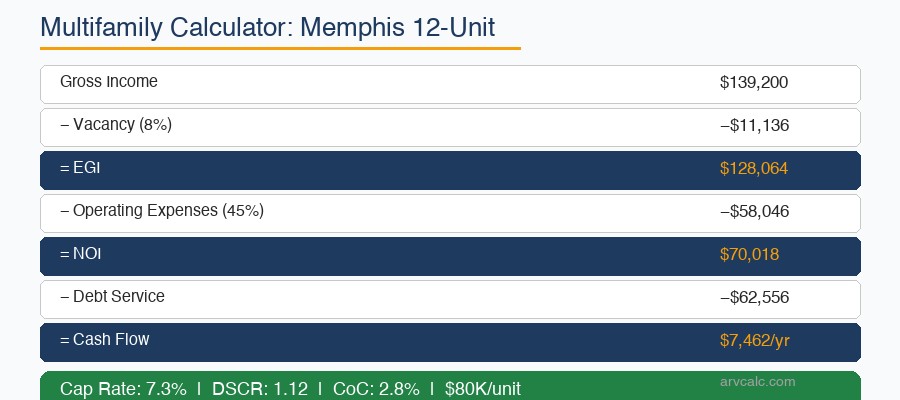
Gross income: $139,200
Less vacancy (8%): −$11,136
Effective Gross Income: $128,064
Step 2: Operating Expenses
| Expense | Annual | Basis |
|---|---|---|
| Property Tax | $11,520 | 1.2% of $960K |
| Insurance | $7,200 | $600/unit — multifamily policy |
| Maintenance | $13,680 | 10% of gross rent |
| Property Management | $12,806 | 10% of EGI |
| Utilities (owner-paid) | $6,000 | Water/sewer/trash — $500/mo |
| CapEx Reserves | $6,840 | 5% of gross rent |
| Total Operating Expenses | $58,046 | 45.3% expense ratio |
A 45% expense ratio is typical for a 12-unit building where the owner pays water/sewer. For larger buildings (50+ units) with on-site management, expect 50–55%. For small multifamily (2–4 units) with tenant-paid utilities, expect 35–40%. Cross-check your NOI in the NOI calculator.
Step 3: NOI and Cap Rate
NOI = $128,064 − $58,046 = $70,018
Cap Rate = $70,018 ÷ $960,000 = 7.3%
A 7.3% cap rate on a 12-unit in Memphis is strong — above the 6–7% threshold where most multifamily investors get interested. Compare this to market cap rates using the cap rate calculator. For context on what makes a good cap rate, read the cap rate guide.
Step 4: Cash Flow and Returns
Monthly P&I: $5,213 (25-year amortization at 7.25%)
Annual debt service: $62,556

Annual cash flow = $70,018 − $62,556 = $7,462
Monthly cash flow = $622

Total cash invested = $240,000 (down) + $28,800 (closing 3%) = $268,800
Cash-on-Cash Return = $7,462 ÷ $268,800 = 2.8%

DSCR = $70,018 ÷ $62,556 = 1.12
Result: 2.8% cash-on-cash, 7.3% cap rate, DSCR 1.12. The property generates positive cash flow ($622/month) and has a solid cap rate. The DSCR of 1.12 is below the 1.25 threshold most lenders require — this deal needs either a larger down payment (30% pushes DSCR to 1.30) or a lower interest rate. Run the scenario in the multifamily calculator and adjust the down payment slider to see the breakpoint.
Check DSCR qualification in the DSCR calculator. For financing options, see DSCR loans guide and investment property interest rates.
Worked Example 2: Austin 4-Plex — $520,000
Property: 4-unit building in east Austin
Purchase price: $520,000 ($130,000/unit)
Down payment: 25% ($130,000)
Loan: $390,000 at 7.0%, 30-year fixed
Rent: $1,400/unit/month × 4 = $5,600/month total
Income and Expenses
Gross annual rent: $67,200
Vacancy (6%): −$4,032
EGI: $63,168

Expenses:
 Property tax (2.0%): $10,400
 Insurance: $4,800 ($1,200/unit)
 Maintenance (8%): $5,376
 PM (9%): $5,685
 CapEx (5%): $3,360
Total expenses: $29,621 (44.2% ratio)

NOI: $33,547
Cap Rate: 6.5%
Cash Flow
Monthly P&I: $2,595
Annual debt service: $31,140

Cash flow: $33,547 − $31,140 = $2,407/year ($201/month)
DSCR: 1.08
CoC: $2,407 ÷ $145,600 = 1.7%
Result: 1.7% CoC, 6.5% cap rate, DSCR 1.08. Thin but positive. The Austin fourplex has higher per-unit costs (insurance, property tax) and a lower rent-to-price ratio than the Memphis 12-unit. This illustrates why per-unit economics matter — $80K/unit in Memphis produces better returns than $130K/unit in Austin at similar rents.
Run both deals side by side in the multifamily property calculator to compare. For the full investment analysis framework, see how to analyze rental property.
Key Multifamily Metrics: What to Target
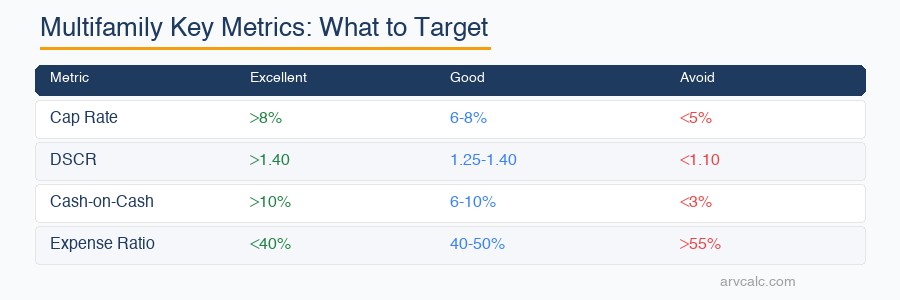
| Metric | Excellent | Good | Marginal | Avoid |
|---|---|---|---|---|
| Cap Rate | >8% | 6–8% | 5–6% | <5% |
| Cash-on-Cash | >10% | 6–10% | 3–6% | <3% |
| DSCR | >1.40 | 1.25–1.40 | 1.10–1.25 | <1.10 |
| Expense Ratio | <40% | 40–50% | 50–55% | >55% |
| Price/Unit | Market-dependent | Below replacement cost | At market | Above comps |
These benchmarks shift by market and property class. A 6% cap rate in Columbus, Ohio is strong; a 6% cap rate in Manhattan is exceptional. Always compare within the same market and property type. The cap rate by state guide provides market-level context.
Multifamily vs Single-Family: When to Scale Up
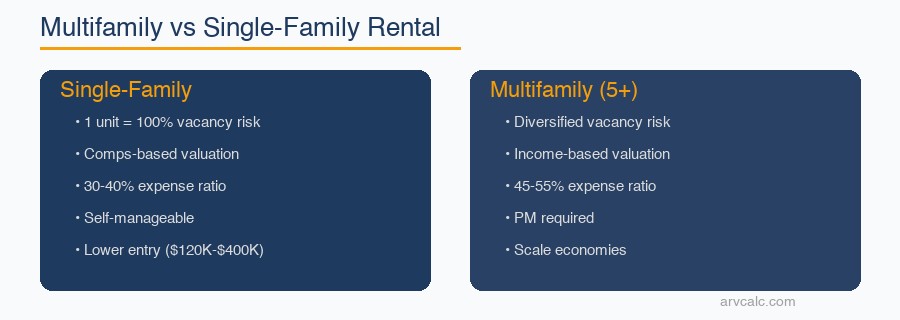
| Factor | Single-Family (1 unit) | Small Multi (2–4) | Commercial Multi (5+) |
|---|---|---|---|
| Financing | Conventional/DSCR | Conventional/DSCR | Commercial loan |
| Down Payment | 20–25% | 20–25% | 25–35% |
| Valuation | Comps-based | Comps or income | Income-based (NOI ÷ cap rate) |
| Expense Ratio | 30–40% | 35–45% | 45–55% |
| Management | Self or PM | PM recommended | PM required |
| Vacancy Impact | 100% or 0% | 25% per unit | 8–10% per unit |
| Scale Benefit | None | Moderate | Significant — lower cost/unit |
The biggest advantage of multifamily: vacancy risk diversification. When your SFR tenant leaves, you lose 100% of income. When one tenant in a 12-unit leaves, you lose 8%. That is why commercial lenders use DSCR — it captures this risk difference. Calculate your DSCR in the DSCR calculator.
5 Common Multifamily Mistakes
1. Using SFR Expense Ratios on Multifamily
Why it matters: SFR expense ratios run 30–40%. Multifamily runs 45–55% because of common area maintenance, higher insurance per building, and owner-paid utilities (water/sewer/trash). Underestimating expenses by 10% on a $140K EGI building means $14,000 less NOI — enough to flip a deal from positive to negative.
Fix: Use 45% as your starting point for 5–20 units, 50% for 20–50 units. Verify against the T-12 (trailing 12-month) operating statement from the seller.
2. Ignoring CapEx Reserves
Why it matters: A 12-unit building needs a new roof ($40K–$60K) every 20 years, HVAC units ($3K–$5K each) every 15 years, and parking lot resurfacing ($8K–$15K) every 10 years. If you do not reserve 5–10% of gross rent, these costs hit as cash flow emergencies.
Fix: Budget 5% minimum for newer buildings, 8–10% for buildings over 30 years old. The multifamily calculator has a dedicated CapEx field.
3. Trusting the Seller’s Pro Forma
Why it matters: Sellers present pro forma income (projected rents after improvements) — not actual income. A building showing $950/unit on the pro forma may currently collect $800/unit with 15% vacancy. Your purchase price should reflect actual income, not projections.
Fix: Underwrite based on the T-12 actual operating statement. Use pro forma rents only for your value-add upside calculation. The rental property calculator helps model both scenarios.
4. Not Checking Per-Unit Comps
Why it matters: A $960K building sounds expensive until you calculate $80K/unit. If comparable buildings sell at $100K–$110K/unit, you are getting a 20–27% discount. Per-unit pricing is how commercial brokers and lenders evaluate multifamily — not total price.
Fix: Research per-unit sale prices for comparable buildings in the same submarket. The multifamily property calculator shows price/unit automatically.
5. Using 30-Year Amortization for Commercial Loans
Why it matters: SFR investors default to 30-year terms. Commercial multifamily loans (5+ units) typically use 25-year amortization with a 5 or 10-year balloon. The shorter amortization means higher monthly payments and lower cash flow than you expected. A $720K loan at 7.25% costs $5,213/mo over 25 years vs $4,912/mo over 30 years — $301/mo less cash flow.
Fix: Enter 25 years (not 30) as the loan term in the calculator for any commercial multifamily loan. Use the investment property mortgage calculator to compare amortization schedules.
Frequently Asked Questions
What is a good cap rate for a multifamily property in 2026?
For small to mid-size multifamily (5–50 units), cap rates of 6–8% are considered good in most markets in 2026. Class A properties in gateway cities may trade at 4–5%. Class B/C properties in secondary markets (Memphis, Cleveland, Indianapolis) regularly hit 7–9%. The key is comparing within the same market and property class. Use the multifamily property calculator to calculate the exact cap rate for any deal.
What expense ratio should I use for a 12-unit building?
How is a multifamily property valued differently from a single-family?
What DSCR do lenders require for multifamily loans?
Should I include CapEx reserves in my multifamily analysis?
What is the 50% rule in multifamily real estate?
How do I calculate price per unit for a multifamily property?
Related Calculators and Guides
- Multifamily Property Calculator — Full apartment building analysis
- Cap Rate Calculator — Forward and reverse cap rate
- NOI Calculator — Net Operating Income breakdown
- Cash-on-Cash Calculator — Yield on invested capital
- DSCR Calculator — Loan qualification check
- Rental Property Calculator — Single-family analysis
- Property Cash Flow Calculator — Monthly cash flow projection
- Investment Property Mortgage Calculator — Compare loan scenarios
- Real Estate ROI Calculator — Total return with appreciation
- All 30+ Calculators
Guides from the blog:
- What Is a Good Cap Rate for Rental Property?
- How to Analyze a Rental Property Investment
- Net Operating Income (NOI) Guide
- DSCR Loans: Complete Guide for 2026
- Investment Property Down Payment Guide
- Investment Property Interest Rates 2026
- Cap Rate by State: Best Markets 2026
- How to Calculate Rental Property Cash Flow
Sources: Fannie Mae Multifamily · FRED Rental Vacancy Data · HUD Multifamily Programs · Census Housing Survey · NAR Research
Leave a Reply