Published: October 2, 2026 · By Alex Petrov
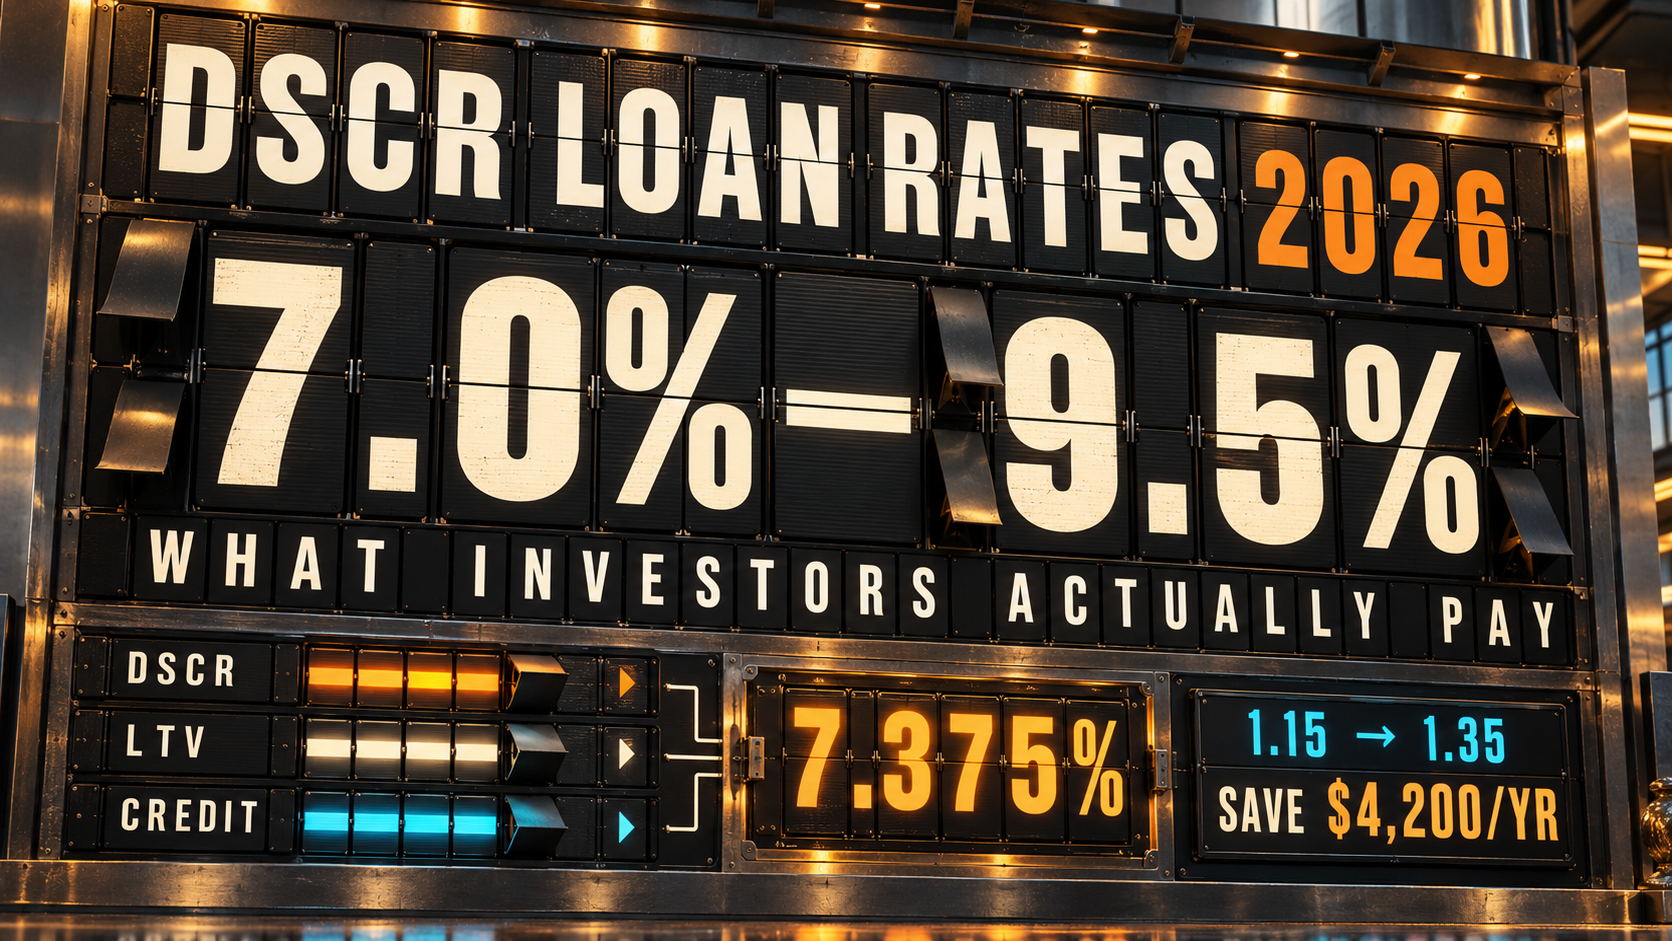
I closed my ninth DSCR loan in June 2026 at 7.375%. My eighth, on a similar property six months earlier, came in at 7.875%. Same lender tier, same credit score, same LTV. The only difference: the property’s DSCR ratio was 1.35 instead of 1.15. That 0.20 bump in debt service coverage saved me half a point on the rate — and about $4,200 per year in interest on a $350,000 loan.
DSCR loan rates in 2026 range from roughly 7.0% to 9.5%, depending on five or six variables that most investors don’t fully control until they understand how lenders price these loans. This article breaks down the exact rate ranges I’ve seen across multiple states, explains what pushes your rate higher or lower, and shows you how small changes in your deal structure translate into real dollars. If you want to model specific scenarios on your own property, the DSCR calculator will give you monthly payment and cash flow numbers in about 30 seconds.
DSCR Loan Rates in 2026 — The Current Range
The Federal Reserve’s H.15 release shows the 10-year Treasury yield hovering around 4.25–4.50% through mid-2026. DSCR loan rates are priced as a spread above this benchmark — typically 275 to 500 basis points, depending on risk factors. That puts the floor near 7.0% for the strongest borrower profiles and the ceiling around 9.5% for higher-risk deals.
Here is a snapshot of what investors are actually paying right now:
| Borrower Profile | Credit Score | LTV | DSCR Ratio | Property Type | Rate Range |
|---|---|---|---|---|---|
| Strong | 740+ | 65–70% | 1.30+ | SFR | 7.0–7.5% |
| Good | 720–739 | 70–75% | 1.20–1.29 | SFR / Duplex | 7.5–8.0% |
| Average | 680–719 | 75–80% | 1.10–1.19 | SFR / 2-4 Unit | 8.0–8.75% |
| Below Average | 660–679 | 75–80% | 1.00–1.09 | Condo / Non-warrantable | 8.75–9.5% |
| Minimum Qualifying | 640–659 | 70–75% | 0.75–0.99 (no-ratio) | Mixed | 9.0–9.5%+ |
These ranges come from rate sheets I’ve collected from seven lenders between January and September 2026. Your actual quote depends on how many of these factors line up in your favor — and which lender tier you work with. I’ll cover lender tiers in detail below.
One thing that surprises first-time DSCR borrowers: these rates are not the same as investment property interest rates on conventional loans. DSCR loans skip income verification entirely, so the lender charges a premium for that flexibility. If you want to compare both paths side by side, read the DSCR vs conventional loan breakdown.
What Drives Your DSCR Rate
Six factors determine where you land on the rate spectrum. I’m listing them in order of impact — the first two move your rate the most.
1. DSCR Ratio (Biggest Single Factor)
The debt service coverage ratio measures whether the property’s rental income covers the loan payment. A DSCR of 1.25 means the property generates 25% more income than the monthly debt obligation. Lenders build rate tiers around specific DSCR breakpoints:
- 1.25+ DSCR: Best pricing. Most lenders drop the rate by 25–50 bps once you cross 1.25.
- 1.00–1.24 DSCR: Standard pricing. The property covers the payment, but there’s no cushion.
- Below 1.00 (no-ratio or negative cash flow): Significant rate premium, usually 75–150 bps above standard. Some lenders won’t go below 1.00 at all.
Run your numbers through the DSCR calculator before you submit a loan application. If you’re at 1.18, it might be worth raising the rent by $50/month or putting slightly more down to push past 1.25 and grab the rate break.
2. Loan-to-Value (LTV)
LTV affects DSCR loan pricing almost as much as the ratio itself. The common tiers:
- 65% LTV or below: Best rates. You’re putting 35%+ down, so the lender’s risk is minimal.
- 70–75% LTV: Standard pricing.
- 75–80% LTV: Rate premium of 25–75 bps. Not every lender goes to 80%.
If you’re weighing different down payment amounts, use the rental property calculator to see how cash-on-cash return changes at each LTV level. Sometimes a lower LTV gives you a better rate but kills your leverage and overall return.
3. Credit Score
DSCR lenders don’t verify your income, but they absolutely pull your credit. The score tiers that affect pricing:
- 740+: Best rate tier
- 720–739: +12.5 to +25 bps
- 700–719: +25 to +50 bps
- 680–699: +50 to +75 bps
- 660–679: +75 to +125 bps
- 640–659: +125 to +200 bps (limited lender availability)
For the full list of DSCR loan requirements beyond credit score — reserve months, entity structure, property condition — that guide has everything.
4. Property Type
Single-family rentals get the best DSCR rates. Each step away from a standard SFR adds basis points:
- SFR (1 unit): Base pricing
- 2-4 units: +0 to +25 bps
- Condos (warrantable): +25 to +50 bps
- Non-warrantable condos: +50 to +100 bps
- 5-8 units: +50 to +125 bps (fewer lenders available)
- Short-term rentals (Airbnb): +50 to +100 bps, and many lenders use 75% of STR income
5. Prepayment Penalty Structure
Most DSCR loans come with a prepayment penalty, and accepting a longer penalty period lowers your rate. Common structures:
- 5-year step-down (5-4-3-2-1): Lowest rate, typically 25–50 bps below the no-prepay option
- 3-year step-down (3-2-1): Moderate rate discount, 12.5–25 bps below no-prepay
- No prepayment penalty: Highest rate
If you plan to hold the property for five years or longer, the 5-year prepay option usually makes financial sense. If you might refinance within two years, pay the premium for a shorter penalty or none at all.
6. Loan Amount
Very small loans (under $100,000) and very large loans (over $2 million) often carry rate adjustments. The sweet spot for best pricing is $150,000 to $1,500,000. Below $100K, some lenders add 25–50 bps or simply won’t do the deal.
DSCR Rates by State
DSCR loan rates vary by state because lenders adjust for foreclosure timelines, landlord-tenant laws, property tax burdens, and local market risk. Judicial foreclosure states (where the lender must go through court) tend to carry a slight premium because it takes longer to recover the collateral if the borrower defaults.
Here are the ranges I’ve seen for a baseline profile: 720 credit, 75% LTV, 1.20+ DSCR, single-family rental, 30-year fixed with 3-year prepay.
| State | Rate Range (Baseline Profile) | Foreclosure Type | Notes |
|---|---|---|---|
| Florida | 7.50–8.25% | Judicial | High lender competition keeps rates reasonable despite judicial process. Insurance costs affect DSCR ratio. |
| Texas | 7.25–8.00% | Non-judicial | Fast foreclosure + strong rental demand = competitive rates. No state income tax helps investor cash flow. |
| Ohio | 7.50–8.25% | Judicial | Low purchase prices mean smaller loan amounts, which can push rates up on sub-$100K deals. |
| Georgia | 7.25–8.00% | Non-judicial | Atlanta metro drives most DSCR volume. Strong population growth. |
| Tennessee | 7.25–8.00% | Non-judicial | Nashville and Memphis markets. No state income tax. |
| Indiana | 7.50–8.25% | Judicial | Indianapolis has good rent-to-price ratios but longer foreclosure timelines. |
| North Carolina | 7.25–8.00% | Non-judicial | Raleigh-Durham and Charlotte driving lender interest. Power of sale foreclosure. |
| Michigan | 7.50–8.50% | Non-judicial (by advertisement) | Detroit sub-$100K properties often carry rate premiums due to small loan size. |
If you’re investing in a specific state, we have detailed guides with local DSCR lender information for Florida, Texas, Ohio, Georgia, Tennessee, Indiana, and North Carolina.
Keep in mind: the state-level differences are smaller than the borrower-profile differences. A strong borrower in Ohio will still beat a weak borrower in Texas by 100+ basis points. Focus on your DSCR ratio, LTV, and credit score first — then worry about state-level adjustments.
Rate Tiers — How Lenders Price DSCR Loans
Not all DSCR lenders charge the same spread. The market breaks into three rough tiers, and knowing which tier you’re working with explains a lot of the rate variation investors see.
Tier 1: Direct Non-QM Lenders (Best Rates)
These are large companies that originate DSCR loans, package them into securities, and sell them on the secondary market. They have the lowest cost of capital because they’re keyly acting as conduits to institutional bond buyers. Rate range: 7.0–8.0% for qualifying profiles.
Tier 1 lenders are efficient but rigid. They have strict overlay requirements, automated underwriting, and limited flexibility on exceptions. If your deal doesn’t fit their box, they’ll decline rather than negotiate.
Tier 2: Correspondent Lenders and Large Brokers
These lenders originate under their own name but sell loans to Tier 1 aggregators. They add a small margin for their services. Rate range: 7.25–8.5%. The extra 25–50 bps buys you more flexibility on underwriting and sometimes a smoother closing process.
Tier 3: Retail Brokers and Small Shops
Brokers shop your deal to multiple Tier 1 and Tier 2 lenders and add their own origination fee. Rates: 7.5–9.5%. The wide range exists because some brokers are well-connected and pass through competitive pricing, while others mark up heavily.
My recommendation: get at least one quote from a Tier 1 lender as a baseline, then see if a Tier 2 or broker can match or beat it. Sometimes the broker has access to a rate sheet you can’t get directly.
Worked Example #1 — Same Property at 7.5% vs 8.5%
Let me show you how a single percentage point changes the math on a real deal. I’ll use a property I looked at in Memphis earlier this year.
Property details:
- Purchase price: $285,000
- Down payment: 25% ($71,250)
- Loan amount: $213,750
- Monthly rent: $2,100
- Property taxes: $225/month
- Insurance: $135/month
- Management: $168/month (8%)
- Vacancy/maintenance reserve: $210/month (10%)
| Metric | At 7.5% Rate | At 8.5% Rate | Difference |
|---|---|---|---|
| Monthly P&I (30-yr fixed) | $1,494 | $1,643 | +$149/month |
| Total monthly expenses | $2,232 | $2,381 | +$149/month |
| Monthly cash flow | -$132 | -$281 | -$149/month |
| Annual cash flow | -$1,584 | -$3,372 | -$1,788/year |
| DSCR ratio | 1.08 | 0.98 | -0.10 |
| Total interest paid (30 yrs) | $324,090 | $377,730 | +$53,640 |
At 7.5%, this property barely breaks even — the DSCR is 1.08, and monthly cash flow is slightly negative after reserves. At 8.5%, the deal is clearly negative cash flow, the DSCR drops below 1.00, and you’d actually have a harder time qualifying for the loan in the first place. That one percentage point is the difference between a deal that works and one that doesn’t.
Plug your own numbers into the DSCR calculator to see exactly where your deal lands at different rate assumptions.
Worked Example #2 — How Improving DSCR from 1.1 to 1.3 Drops Your Rate
This example shows the reverse angle: same rate quote process, but you’ve improved the property’s DSCR ratio before applying. I’m using an actual rental I refinanced in Q1 2026.
Property: Single-family in suburban Atlanta. Appraised at $310,000. Existing loan balance: $220,000.
Scenario A — DSCR 1.10 (before rent increase):
- Monthly rent: $1,950
- PITIA (principal, interest, taxes, insurance, association): $1,773
- DSCR: 1.10
- LTV: 71%
- Credit score: 735
- Rate quoted: 8.125%
Scenario B — DSCR 1.30 (after lease renewal at market rate):
- Monthly rent: $2,275 (renewed lease at market, up $325)
- PITIA: $1,750 (slightly lower because the better rate reduced payment)
- DSCR: 1.30
- LTV: 71%
- Credit score: 735
- Rate quoted: 7.50%
| Metric | DSCR 1.10 (8.125%) | DSCR 1.30 (7.50%) | Improvement |
|---|---|---|---|
| Monthly P&I | $1,638 | $1,538 | -$100/month |
| Monthly cash flow | $177 | $525 | +$348/month |
| Annual cash flow | $2,124 | $6,300 | +$4,176/year |
| Cash-on-cash return | 2.4% | 7.0% | +4.6 points |
| Total interest over loan life | $369,680 | $333,680 | -$36,000 |
The combined effect is dramatic: the higher rent increases income and earns a lower rate, which decreases expenses. That $325/month rent bump didn’t just add $3,900/year in gross rent — it also triggered a rate reduction worth another $1,200/year in interest savings. The cap rate calculator can help you evaluate whether the higher rent is sustainable for the market.
How to Get the Lowest DSCR Rate
After closing eight DSCR loans and quoting on at least twenty more, here are the specific tactics that actually move the needle on rate.
Push Your DSCR Above 1.25
This is the single most effective rate reduction strategy. If you’re sitting at 1.18, do whatever it takes to cross 1.25: raise rent to market, reduce the loan amount by putting more down, or challenge the insurance quote to lower PITIA. The 1.25 breakpoint typically saves 25–50 bps.
Drop LTV to 70% or Below
If you have the capital, going from 75% LTV to 70% LTV often saves 12.5–25 bps. On a $300,000 loan, that extra $15,000 in down payment might save you $37–75 per month. Whether that’s worth it depends on your return requirements — check the rental property calculator to compare scenarios.
Accept a 5-Year Prepayment Penalty
If you plan to hold the property for five or more years, the 5-4-3-2-1 prepay structure saves 25–50 bps over the no-prepay option. That’s real money: on a $250,000 loan, 37.5 bps equals $78/month or $937/year.
Get Quotes From Multiple Lender Tiers
Don’t just call one broker. Get at least three quotes: one from a Tier 1 direct lender, one from a Tier 2 correspondent, and one from a broker who shops multiple wholesale channels. The spread between the best and worst quote on the same deal is often 50–100 bps.
Lock When Treasuries Dip
DSCR rates follow the 10-year Treasury. If the Treasury drops 15–20 bps on a weak jobs report or Fed announcement, call your lender that day and lock. Rate sheet pricing updates daily at most lenders, and a well-timed lock can save you a quarter point.
Fix Your Credit Before Applying
The difference between a 715 and 740 credit score is often 25–37.5 bps on a DSCR loan. If you’re close to a tier boundary (720 or 740), it may be worth spending 60–90 days cleaning up credit before submitting the application. Pay down revolving balances below 30% utilization and dispute any inaccuracies.
DSCR Rates vs Hard Money vs Conventional
Investors often weigh DSCR loans against other financing options. Here’s how the rates compare as of mid-2026:
| Loan Type | Rate Range | Term | Income Verification | Best For |
|---|---|---|---|---|
| DSCR Loan | 7.0–9.5% | 30-year fixed or 5/6 ARM | None (property income only) | Buy-and-hold investors, scaling a portfolio |
| Hard Money Loan | 10.0–14.0% | 6–24 months | Minimal | Fix-and-flip, bridge financing, fast close |
| Conventional Investment | 6.75–7.75% | 30-year fixed | Full (W-2, tax returns) | First 1-4 investment properties with W-2 income |
| Portfolio Loan (Bank) | 7.25–8.50% | 5-10 year balloon, 25-yr amortization | Varies | Local bank relationship, flexible terms |
Conventional loans are cheaper, but they cap out at 10 financed properties per borrower (Fannie Mae guidelines), and the income documentation requirements get brutal if you’re self-employed or own multiple LLCs. DSCR loans have no property count limit and no tax return requirement — that’s the premium you’re paying for.
Hard money is a different animal entirely. Those loans are short-term bridge products for acquisitions and rehabs, not long-term holds. If you’re comparing hard money costs, the hard money loan calculator will show you the total cost including points and fees. Many investors use hard money to acquire and rehab, then refinance into a DSCR loan for the long-term hold — a strategy called BRRRR.
The CFPB’s loan comparison tool provides general mortgage rate data, but note that their numbers reflect owner-occupied conventional loans — DSCR rates will always be higher because the loan is non-QM and the property is investor-owned.
What Drives Your Rate Higher — Mistakes to Avoid
I’ve watched investors overpay on DSCR rates because of avoidable errors. Here are the most common ones.
Using Projected Rent Instead of Actual Lease
Lenders calculate DSCR using the lesser of the actual lease amount or the appraiser’s rent estimate. If you’re buying a vacant property and projecting $2,200/month in rent but the appraiser estimates $1,950, the lender uses $1,950. That lower number drops your DSCR and raises your rate. Sign a lease at market rate before the appraisal if possible.
Ignoring Insurance in the DSCR Calculation
DSCR = Gross Rent / PITIA. That “I” includes insurance, and in states like Florida, insurance can run $3,000–5,000/year on a single-family rental. An expensive insurance policy lowers your DSCR and costs you a rate tier. Shop insurance aggressively — a $1,000 annual savings on insurance could move your DSCR from 1.15 to 1.25 and drop your rate by 37.5 bps.
Applying With the Wrong Entity Structure
Some lenders charge a premium for loans to LLCs, while others only lend to LLCs. If you’re set up as a trust or sole proprietor and the lender’s best pricing is for LLC borrowers, you’ll pay more. Ask about entity preferences before you apply.
Not Shopping the Prepayment Penalty
Taking the default 5-year prepay when you plan to sell in three years is a costly mistake. If you sell in year two, you’d owe 4% of the loan balance as a penalty — over $8,000 on a $200K loan. Match the prepay term to your actual hold period. Use the DSCR calculator to model different hold periods and see total costs.
Applying to One Lender and Accepting Their First Quote
DSCR rate sheets vary significantly between lenders. I’ve seen 75 bps of spread on identical deal profiles submitted to three different lenders on the same day. Always get multiple quotes. The five minutes it takes to submit a second application can save you thousands over the loan term.
Choosing a Cash-Out Refi at Maximum LTV
Cash-out refinances above 70% LTV typically add 25–50 bps versus a rate-and-term refi or a purchase loan at the same LTV. If you’re refinancing to pull equity, keep the cash-out LTV at 70% or below to stay in the best rate tier. You can check what the equity looks like using the investment property mortgage rates guide.
Where DSCR Rates Are Headed
I’m not going to pretend I can predict interest rates. But the mechanics are straightforward: DSCR rates follow the 10-year Treasury plus a risk spread. As of September 2026, the Freddie Mac Primary Mortgage Market Survey shows conventional 30-year rates around 6.5%, and the spread between conventional and DSCR has been running 75–200 bps over the past 18 months.
If the Fed continues its current rate path, DSCR loan rates in the 7.0–8.0% range for strong borrowers are likely to hold through year-end. The spread itself has been compressing slightly as more capital enters the DSCR securitization market — more buyers for DSCR-backed bonds means lenders can price more aggressively.
My approach: don’t wait for rates to drop. If the deal cash flows at today’s rate, close it. If rates drop a point next year, refinance. The property isn’t going to wait for a rate cut, and neither is the seller.
DSCR Loan Rates FAQ
What is the average DSCR loan rate in 2026?
The average DSCR loan rate for a well-qualified borrower (720+ credit, 75% LTV, 1.20+ DSCR, single-family rental) is approximately 7.5–8.0% as of mid-2026. Rates below 7.5% are available for stronger profiles (740+ credit, lower LTV, higher DSCR ratio), and rates above 8.5% are common for lower credit scores, higher LTV, or property types beyond standard SFR. The DSCR calculator can estimate your monthly payment at any rate you input.
Are DSCR loan rates higher than conventional mortgage rates?
Yes. DSCR loan rates are typically 75–200 basis points (0.75–2.0%) higher than conventional investment property mortgage rates. As of 2026, conventional investment property rates run 6.75–7.75%, while DSCR rates run 7.0–9.5%. The premium reflects two factors: DSCR loans are non-qualified mortgages (non-QM), so they carry additional regulatory risk for lenders, and they require no income verification, meaning the lender relies solely on the property’s cash flow. For a full comparison, see our DSCR vs conventional loan guide.
Can I get a DSCR loan below 7%?
Sub-7% DSCR rates are rare in 2026 but not impossible. To get there, you’d need a strong combination: 760+ credit score, 60–65% LTV, DSCR above 1.30, single-family property, 5-year prepayment penalty, and a Tier 1 direct lender. Even then, rates in the 6.75–6.99% range are unusual and depend on specific rate sheet promotions or portfolio pricing from a lender looking to build volume. For most investors, 7.25–7.75% represents a strong rate.
Do DSCR loan rates vary by state?
Yes, but the variation is smaller than most investors expect. State-level differences typically amount to 25–50 bps, driven by foreclosure type (judicial vs. non-judicial), landlord-tenant regulations, and local market risk. Non-judicial foreclosure states like Texas, Georgia, Tennessee, and North Carolina tend to have slightly lower rates because the lender can recover collateral faster if the borrower defaults. Judicial states like Florida, Ohio, and Indiana may carry a small premium. Your personal credit, LTV, and DSCR ratio affect your rate far more than the state.
How do I lock in the best DSCR rate?
Five steps: (1) Push your DSCR ratio above 1.25 before applying — raise rents to market, reduce insurance costs, or increase your down payment. (2) Keep your credit score above 740 if possible. (3) Accept a 5-year prepayment penalty if your hold period supports it. (4) Get at least three quotes from different lender tiers — one direct lender, one correspondent, one broker. (5) Lock your rate on a day when the 10-year Treasury dips, since DSCR rate sheets reprice based on Treasury movements. For detailed cash flow modeling at different rates, use the DSCR calculator.
Related Calculators and Guides
Use these tools to model your DSCR loan scenario and compare financing options:
- DSCR Calculator — Calculate your debt service coverage ratio and see monthly payments at any interest rate
- Rental Property Calculator — Full cash flow analysis including mortgage, expenses, and returns
- Cap Rate Calculator — Evaluate property value based on net operating income
- Hard Money Loan Calculator — Compare short-term bridge loan costs before refinancing into a DSCR loan
- DSCR Loan Requirements Guide 2026 — Full qualification checklist: credit, reserves, entity structure
- DSCR vs Conventional Loan — Side-by-side comparison of both loan types
- How to Use the DSCR Calculator — Step-by-step walkthrough with screenshots
- Investment Property Interest Rates — Broader rate trends across all investment loan types
- Investment Property Mortgage Rates Guide — Detailed breakdown of conventional and portfolio lending rates
Leave a Reply